An Empirical Analysis o f Changes in the Structure o f
Wages and Employment in OECD Countries
Thesis submitted for the degree o f Doctor o f Philosophy (Ph.D.)
by Marco Manacorda
ProQuest Number: U643914
All rights reserved
INFORMATION TO ALL USERS
The quality of this reproduction is dependent upon the quality of the copy submitted.
In the unlikely event that the author did not send a complete manuscript and there are missing pages, these will be noted. Also, if material had to be removed,
a note will indicate the deletion.
uest.
ProQuest U643914
Published by ProQuest LLC(2016). Copyright of the Dissertation is held by the Author.
All rights reserved.
This work is protected against unauthorized copying under Title 17, United States Code. Microform Edition © ProQuest LLC.
ProQuest LLC
789 East Eisenhower Parkway P.O. Box 1346
Abstract
This work uses a variety o f micro and macro data sets in order to analyse changes in the wage
and employment structures in a number o f OECD countries over the 1970s and 1980s. I find
evidence o f a generahsed rise in the relative demand for skilled labour across all countries
analysed. The US (in the 1980s) and the UK, however, are the only two countries where a
deceleration in the relative supply o f skilled labour produced an increased imbalance between
the demand and the supply o f skills. Such an increased imbalance is able to explain the rise in
returns to skills which occurred over the 1980s. As continental Europe is concerned, an
analysis o f the Italian labour market illustrates that the rising trend in the demand for skills was
counteracted by institutional rigidities, which kept the wage structure relatively unchanged.
The analysis suggests that wage rigidities and shifts in demand are jointly responsible for the
Table o f Contents
List o f Tables... 4
List o f Figures...6
Acknowledgements...8
Introduction... 10
Chapter 1: Skill-Biased Change and Labour Market Performance in OECD Countries...13
Chapter 2: Skill-Biased Change in OECD Countries: Further analysis... 53
Chapter 3: Changes in Earnings Inequality in Italy in the 1980s and the Effect of Institutions... 100
Chapter 4: Changes in the Structure o f Earnings in Italy in the 1980s: Changing Institutions or Changing Market Forces?... 180
Chapter 5: A Simple Model o f the Labour Market: US vs. Continental Europe... 216
List o f Tables
Chapter 1 :
Table 1 : The Labour Demand Equation in 6 OECD Countries Dependent Variable: In (N1/N2) Constrained Estimation.
Table 2: Annual Growth Rates, in Supply, Employment and Demand for Skills.
Table 3: Annual Changes in the Skilled Unemployment Rate and the Impact of Mismatch. Table 4: Annual Changes in the Unskilled Unemployment Rate and the Impact o f
Mismatch.
Table 5: Annual Changes in the Aggregate Unemployment Rate and the Impact of Mismatch.
Chanter 2:
Table 1 : Trends in Relative Employment and Wages by Education. Table 2: Simulated Changes in the Demand and Supply o f Skills.
Table 3a: Estimates o f Shifts in Demand Relative to Supply: Unrestricted Model. Table 3b: Estimates o f Shifts in Demand Relative to Supply: Restricted Model. Table 4: Estimates o f Shifts in Supply.
Table 5: R from a Regression o f Log Wages on Education.
Table 6: Box -Cox Estimates o f Shifts in Demand Relative to Supply: Restricted Model. Table 7: Breusch-Pagan test.
Chapter 3:
-Table 1: The Scala Mobile at Work: An Illustration. Table 2: Summary Statistics: Means/Proportions. Table 3: The Evolution o f the Structure o f Earnings.
Table 4: Decomposing Changes in Earnings Inequality: Ex-ante Annualised Changes. Table 5: The Effect o f the Scala Mobile on the Structure o f Earnings. Dependent Variable:
Annualised Changes in Earnings.
Table 6 : Decomposing Changes in Earnings Inequality: Ex-Post Annualised Changes. Table 7: The Effect o f the SM on Earnings Inequality via Employment Changes, 1977-93. Appendix Table A1 : The Structure o f the Compensation Package o f a Typical Worker in
Italy.
Appendix Table A5: The Composition of Gross Earnings by Decile.
Appendix Table A6: Decomposing Changes in Earnings: Ex-ante Annualised Changes. Appendix Table A7: The Evolution o f the Structure o f Earnings in the US.
Appendix Table A8: Decomposing Changes in Earnings: Ex-post Annualised Changes.
Chapter 4:
Table 1: Changes in the Structure o f Earnings: Relative Log Earnings by Cell. Table 2: Changes in the Structure o f Earnings. Dependent Variable: Annualised
Proportional Changes in Earnings by Cell.
Table 3: Changes in the Scala Mobile. Dependent Variable: Annualised Proportional Contingent Changes in Earnings by Cell.
Table 4: The Effect o f Scala Mobile on the Structure of Earnings. Dependent Variable: Annualised Proportional Earnings Changes by Cell.
List o f Figures
Chapter 1 :
Figure 1: The Standardised Unemployment Rate in 11 OECD Countries, 1970-1994. Figure 2: Shares o f Skilled Individuals: 1970-1994.
Figure 3: Unemployment Rates by Education: 1970-1994. Figure 4: Skilled to Unskilled Wage Ratios: 1970-1994.
Figure 5: The Effect o f an Asymmetric Labour Demand Shift on Sectoral and Aggregate Unemployment Rates.
Chapter 2:
Figure 1 : Labour Force Shares by Education. Figure 2: Wage Bill Shares by Education.
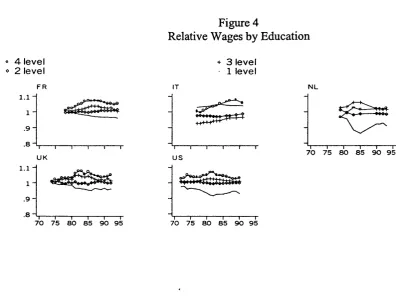
Figure 3: Relative Employment Rates by Education. Figure 4: Relative Wages by Education.
Figure 5: Estimates o f Skill Mismatch by Education Group. Figure 6: Predicted and Actual Rises in Wage Inequality.
Chapter 3:
Figure 1 : The Evolution o f the 9-1 Log Decile Earnings Gap in Italy and the US and the Ex- Ante Effect o f the SM.
Figure 2: The Evolution of the 9-1 Log Decile Earnings Gap in Italy and the Evolution of the Scala Mobile by Gender.
Figure 3: Actual Changes in the Distribution o f Earnings by Percentile.
Figure 4: Decomposing Changes in the Distribution o f Earnings by Percentile: Ex-ante Effects.
Figure 5: The Ex-ante Effect of the SM on the Female-Male Earnings Differential by Percentile and the Actual Earnings Change.
Figure 6: The Change in the Female-Male Earnings Differential by Percentile in the US. Figure 7: The Evolution of Actual and Latent Earnings Inequality in Italy by Gender. Figure 8: The Evolution of Actual and Latent Earnings Inequality in Italy.
Chapter 4:
Figure 3: The Inflation Rate.
Figure 4: The Decline in the Scala Mobile Toughness.
Figure 5: Changes in the Gender Earnings Gap by Education.
Figure 6: The Effect o f the Scala Mobile on the Average Return to One Extra-Year o f Education.
Acknowledgements
In writing this dissertation I have benefited from the help o f many people. Steve Machin and
Costas Meghir provided me with insightful and dedicated advising. I learnt a great deal from
my interaction with both o f them. Steve showed me the value o f empirical research in
economics and a way to make effective use o f data within a rigorous theoretical framework.
Costas's teaching proved essential to get an understanding o f the interplay between
econometric techniques and economic theory. The interaction with Costas pushed me to
expand my understanding o f economics by constantly questioning some o f my previous
assumptions.
Alan Manning has been a continuous source o f inspiration for original research and an
enlightening guide throughout my years as a graduate student.
David Card provided me with a unique amount o f stimulus and encouragement. His
intellectual vivacity and his generosity proved invaluable at several stages o f this work. I also
wish to thank him for the opportunity to visit the Center for Labor Economics at UC Berkeley.
The years at Berkeley have been among the most exciting and productive o f my graduate
studies.
Marco Pagano and Tullio Jappelli have been generous mentors. Without Marco's initial
support and encouragement I would have hardly started an economic career.
At different points o f this work I have also benefited from discussions with a number of
other people. I wish particularly to thank Richard Blundell and Steve Nickell.
Most o f this work would have not been possible without the years spent the Center for ,
Economic Performance at the LSE. I wish to thank Richard Layard for having made this
possible. During the years at the CEP, I have benefited enormously from the interaction with
Eeckhout, Maia Guell, Paul Gregg, Steve Mclnsotsh, Barbara Petrongolo and Jonathan
Introduction
This dissertation analyses the performances o f the labour markets in Europe and the US in the
1970s and 1980s. The objective o f this analysis is to get an understanding o f the interplay
between market forces (supply and demand for skills) and institutions in shaping the evolution
o f the wage and employment structures on the two sides o f the Atlantic over this time period.
For this purpose a variety o f micro and macro data sets for as many as eleven OECD countries
are used.
The basic motivation for this study comes from a few well known stylised facts. While
over the period o f observation the US experienced a remarkable rise in the level o f wage
inequality, unemployment in this country stayed essentially untrended. The reverse seems to
have happened in continental Europe, where the wage structure - more equal for a start -
remained broadly unchanged or compressed over the 1970s and 1980s, while unemployment
grew dramatically, especially among the unskilled. The UK stands somewhat between these
two extremes, with some rise in unemployment and some rise in wage inequality.
Some questions arise naturally. Can the different experiences on the two sides of the
Atlantic be rationalised in terms o f different responses to similar shocks? What is the role o f
labour market institutions in shaping these different outcomes? And what can we leam about
the functioning o f the labour market by comparing countries with different (changes in)
institutional arrangements and different (changes in) economic forces?
Chapters 1 and 2 test the hypothesis that an increase in the gap between demand and
supply o f skills has been a generalised phenomenon across the OECD, and that this can explain '
the rise in aggregate unemployment in Europe over the 1970s and 1980s. This has long been
offered as the most plausible explanation for the rise in wage inequality in the US during the
1980s. A number o f authors have suggested that this could in principle be the driving force
are rigid - as it is sometimes held to be the case in Europe - the failure o f the supply o f skills to
keep the pace with changes in demand would essentially translate into changes in the
employment structure (as opposed to changes in the wage structure), and possibly into changes
in aggregate unemployment.
Chapter 1, written together with Barbara Petrongolo, develops a simple model of the
labour market with two types o f labour and uses evidence on employment, labour force and
wage differentials by education (high and low) for several OECD countries to investigate the
occurrence and the consequences o f such an increased imbalance.
In chapter 2, co-authored with Alan Manning, the analysis o f chapter 1 is extended by
studying the fortunes of those at any given position in the skills distribution, as opposed to
those with any given level o f education. The advantage o f this approach over the one in chapter
1 is double. First, it allows to circumvent the problem o f defining comparable levels o f
education across countries. Second, it accounts for the circumstance that the secular trend
towards higher educational attainment in the population implies that the same level of
education corresponds to a different relative position in the distribution o f skills as time goes
on. Under some parametric assumptions about the (continuous) distribution o f human capital in
the population, it is shown how one can derive a one-dimensional measure o f imbalance
between supply and demand for skills which in principle does not rely on having comparable
measures o f skills across countries or over time. Also, it is shown how in the presence o f data
for (more than two) educational inputs, one can test for the validity o f the model. The empirical
analysis focuses on the experience o f five countries, a subset o f the ones which are analysed in
chapter 1, chosen based on the availability of data on prices and quantities for at least four ,
educational groups.
Chapters 3 and 4 explore the hypothesis that (changes in) wage institutions primarily
Chapter 3 uses SHIW and CPS micro data to examine changes in the wage structure in
Italy between the late 1970s and the early 1990s and explicitly compare these changes with
those that occurred in the US over the same period. The analysis concentrates on the effect o f a
wage indexation clause - the Scala Mobile - on the evolution o f earnings inequality. By
granting the same absolute wage increase to all employees as prices rose, this institution had a
potential to compress the distribution o f wages. The assumption that, in the absence o f this
institution, inequality would have evolved similarly for men and women allows to identify the
effect o f the Scala Mobile on changes in the earnings structure separately from market forces.
A problem with the analysis in chapter 3 is that the effect o f the decline in the Scala
Mobile over the trend in the wage structure is observationally equivalent to the effect o f skill-
biased (technological) change. To cope with this problem, chapter 4 studies changes in returns
to education in Italy and estimates a model which accounts simultaneously for changes in
supply and demand for skills as well as for changes in institutions (Scala Mobile). In order to
carry out this exercise, the data in chapter 3 are integrated with published data on employment
and labour force participation for workers with different levels o f education. As a consistency
check for the results in chapter 3, a different identification strategy for the Scala Mobile is
used, namely that, in its absence, the gender earnings gap would have varied at a constant rate
over the period of observation.
Finally, chapter 5 provides a very stylised model o f the labour market with two
heterogeneous inputs (skilled and unskilled labour) which is broadly able to account for the
different results found throughout this dissertation. It is shown how one can reconcile the
different labour market performances on the two sides of the Atlantic during the 1980s in terms
of similar (exogenous) changes in market forces coupled with different values o f the
Chapter 1
Skill-Biased Change and Labour Market Performance in OECD Countries
Evidence on labour market performance in OECD countries over the last two and a half
decades delivers two well-known stylised facts.
First, following the two oil shocks of the 1970s, most OECD countries
experienced remarkable rises in their unemployment rates. In the late 1980s, no more
than two decades after the first oil shock, the unemployment rate in the United States
had reverted to its pre-shock level, while in the countries o f the European Union it was
still two to three times as high as it was at the beginning o f the previous decade, and
showed a remarkable degree o f persistence. These different trends in the evolution of
unemployment across the OECD are documented in the existing literature, and have
been the subject o f a vast debate (see Bean, 1994 for a survey). Secondly, wage
inequality - both overall and between a number o f dimensions - has been steadily
increasing in the US over the 1980s. This dramatic increase in wage inequality does not
appear in most European countries. With the exception o f the UK, where wage
differentials widened during the 1980s, European countries experienced a pretty stable -
if not declining - dispersion o f earnings over this period (see for example OECD, 1993
and the evidence in chapters 3 and 4).^
It has been suggested that these pieces o f evidence can be rationalised in terms
o f the same driving force. Krugman (1994) argues that the rise in European
unemployment and the widening wage dispersion in the US might be interpreted as
market wages. The different outcomes in terms o f unemployment versus wage
inequality would then depend on the institutional setting dominating a country's labour
market. In flexible labour markets this pressure would translate into an actual widening
o f the wage distribution. In highly regulated labour markets, the forces that prevent the
widening o f earnings dispersion would instead translate the rise in the inequality o f
market wages into higher unemployment dispersion and via this into higher aggregate
unemployment. One plausible cause o f a tendency towards greater inequality is skill-
biased technological progress, increasing the relative demand for skilled labour at the
expenses o f the less-skilled.
Any increase in the relative demand for skilled labour would not cause major
labour market problems if it were matched by a parallel adjustment o f supply. Along
these hnes, this chapter is an attempt to evaluate whether and to what extent any
imbalance between the demand and the supply o f skills - that we refer to as skill
mismatch - can be held responsible for the secular rise in European unemployment.
Our analysis provides two new contributions to the debate.
The first is an explicit description o f how wage inequality and unemployment
interact in an economy with heterogeneous labour (skilled and unskilled), in which
institutions o f varying power govern the wage-setting process. The framework that we
adopt is based on the widely accepted idea, first expressed in Lipsey (1960), that wages
are relatively more responsive to unemployment when unemployment is low. The
presence o f such a convex wage-unemployment relationship implies that a given
asymmetric shock, hitting two different types o f labour and generating greater >
unemployment (and wage) dispersion, will also generate higher aggregate
' The issue o f the source o f increased wage inequality has generated some debate between those who explain it as being mainly induced by the \third world competition in those industries which are less skill intensive (see for example Murphy and Welch, 1992 and Wood, 1994), and those who reckon instead that it was mainly due to skill-biased technological progress (for some evidence in this direction see Katz and
Murphy, 1992; Berman et a l , 1994; and Machin, 1994). Others stress instead the role played by the
unemployment. In the same framework we show that the impact o f a given shock on
unemployment is negatively related to real wage flexibility.
The second element concerns the empirical documentation o f the driving force
at the basis o f the recent major developments in unemployment and wage inequality. By
focusing on the evolution o f prices and quantities o f different educational inputs for as
many as 11 OECD countries we try to determine whether a net relative demand shift
between different skill groups has in fact occurred, to distinguish its demand and supply
components, to assess its magnitude, and finally to discuss its relationship with
aggregate unemployment.
Although most o f the related literature follows a similar approach to the one
presented here, the interpretation o f the data and the conclusions drawn are sometimes
quite different. For example, Krugman (1994) points to the larger rise in unemployment
rates for the unskilled in Europe, while Nickell and Bell (1995) point out to the
circumstance that relative unemployment rates by education show similar trends across
countries. The existing literature does not provide very clear guidance on what evidence
should be given most weight (e.g. should one pay more attention to absolute or relative
differences in unemployment rates by education) and it is difficult to know what to
make o f these disparate pieces o f evidence. The contribution o f this chapter is then to
provide some guidance on how to analyse the basic data.
The chapter is organised as follows. Section I presents some descriptive
evidence on the evolution o f unemployment and wage differentials by education in a set
o f OECD countries, characterised by different labour market performances. Section II *
introduces the labour demand side o f the economy. A simple Cobb-Douglas
specification o f technology delivers testable predictions in terms o f the relationship
between relative wages and relative employment, and it is not rejected by our data. This
our set o f countries over the past two decades. Section III closes the model by
introducing a wage function that relates skill-specific wages to skill-specific
unemployment. Here we show that labour demand and supply imbalances hitting those
workers with the poorest labour market prospects can in fact worsen the aggregate
performance o f the economy, by increasing the aggregate unemployment rate. Finally,
in the same section we evaluate the impact o f increased skill mismatch on aggregate
unemployment. Section IV concludes the chapter and states our main findings.
I. Unemplovment and Wage Differentials bv Skill: Some Evidence
In this section we introduce some descriptive evidence on the evolution o f wages and
unemployment by skill in a set o f OECD countries for which data are available. The aim
o f this section is to highlight whether any sign o f increasing inequaHty in wages and/or
employment opportunities across skills can be detected and to assess whether this is a
generahsed phenomenon across the OECD. At this stage we are not able to evaluate to
what extent a shift in relative demand towards the skilled has occurred, and in order to
do so in the next section we develop an appropriate framework for thought.
Figure 1 plots the standardised unemployment rate for 11 OECD countries over
the past two and a half decades. The countries are Australia, Canada, France, Germany,
Italy, Netherlands, Norway, Spain, Sweden, United Kingdom and United States.
These countries differ substantially in their unemployment experiences. One
subset, made up o f EU countries, Austraha and Canada, shows an overall upward trend
in the unemployment rate over the period considered. Here unemployment increases
roughly monotonically until it reaches a peak around mid-1980s, then has a local
minimum in the late 1980s, followed by a further recession. Note however that the
recovery of the second half o f the 1980s does not bring unemployment back to the level
unemployment rate experiences pronounced cycles, without any definite trend. Lastly,
in the Scandinavian countries, unemployment is stable and very low until the late 1980s,
and then peaks during the last recession.
While these aggregate trends are well documented in the literature, less evidence
has been provided with regard to the skill composition o f employment and the labour
force. The educational attainment o f individuals is used here as the relevant indicator of
skill. Since education is arguably only imperfectly correlated with human capital, in the
next chapter we extend the analysis o f this chapter to allow for this imperfect
correlation. In addition, cross-country comparisons by education can be quite
problematic since educational systems vary widely across countries. In this sense, the
evidence presented below should be treated with some care, as far as international
comparisons are concerned. Again, we will try to deal with this issue in the next
chapter. Despite these caveats, we hope to be able to highlight some basic trends and to
show that they are robust to the classification used.
In what follows we adopt a dichotomous classification o f skills. We generally
define as skilled those individuals who have completed their upper secondary education
(or equivalent vocational qualification), and unskilled all the others (see the Data
Appendix for a more detailed definition o f skill categories across countries and for data
sources). Two exceptions have been made to this taxonomy, for the US and Spain,
where skilled individuals are those who have at least some college education. For the
US this procedure provides a more balanced partition between skill levels. For most
countries, in fact, there is a point in the sample period at which the two groups are ^
approximately equally sized. This allows us to keep to a "relative" definition o f skills, in
which skilled individuals are defined as those who have an education attainment above
skill levels in the original data that does not allow the same skill partition obtained for
other European countries.
Figure 2 plots the percentage of skilled people in the population o f working age
(where available), labour force and employment for each country. The relative size o f
the skilled group grows monotonically over the whole period in all countries, showing a
definite and generalised trend towards higher educational attainment.
To evaluate whether the general tendency towards a skill-upgrading was
balanced in its demand and supply components, we look at the evolution o f skill-
specific unemployment rates. Figure 3 plots the evolution o f the unemployment rates by
education for our set o f countries. For ten of the eleven countries considered the
unemployment rate o f the unskilled is above that o f the skilled. The only exception is
Italy, where unemployment is more concentrated among highly educated workers.
Although we will make this point formally in the next section, it can be shown
that, for given relative wages, an increase in the imbalance between the demand and the
supply o f skills can be identified by looking at the evolution o f the difference between
the unemployment rates o f the two groups.
We can detect two main patterns in the evolution o f skill-specific unemployment
rates. There is in fact a group o f countries where the secular increase in unemployment
is mainly concentrated among the unskilled. This is the case for the US and most EU
countries: UK, France, Germany, Italy, the Netherlands and Spain. On the other hand, in
Australia, Canada and the Scandinavian countries (with the exception o f Norway in the
last recession) no remarkable change in the difference between skill-specific *
unemployment rates has taken place. Overall, no clear correlation between the
difference in the unemployment rates and aggregate unemployment can be detected in
It is interesting to notice at this stage that the remarkably close behaviour of
population shares to labour force shares (see Figure 2) implies that non-employment
rate differentials move very much in line with unemployment rate differentials. We
therefore rule out the possibility that the different patterns o f unemployment
differentials in the various countries are driven by different patterns o f labour force
participation across skills.
Turning finally to wage differentials, the recent evolution o f wage inequality
across a number of dimensions - among which education - is extensively documented in
the literature,^ and has produced global consensus on the recognition o f a few stylised
facts. Below we will simply describe the evolution o f wage differentials between the
two educational groups already defined for our set of countries.
Figure 4 plots the evolution o f the skilled to unskilled wage ratio for a subset o f
countries for which consistent time series for wages are available: UK, Germany,
France, Italy, the Netherlands and the US. In no country except the UK and the US -
two countries where the differentials are higher in levels - can any appreciable evidence
of widening wage differentials by skill be found. In the remaining countries, wage
differentials stay basically unchanged or even fall. For Australia, Canada, Norway and
Sweden, indirect evidence based on OECD (1993,1994b Table 7.A.1) shows that in
none o f them (with the exception o f Sweden in the late 1980s, when differentials
increased moderately) can any sign o f increasing dispersion be detected.
Given our evidence, we can tentatively conclude that there seems to be some
sign o f a relative demand shift (net o f supply) towards skilled labour in the UK, France, ,
Germany, Italy, Spain and the US. Evidence o f this shift is represented by changes in
the skill distribution o f unemployment and/or in wage differentials. It is instead more
Netherlands, Sweden and Norway seem in fact to have kept the imbalance between the
demand and supply of skills to a relatively constant level over the last two decades.
It is worth noting that the only country where both relative wages and
unemployment differentials evolved against the less-skilled is the US (from the early
1980s). This seems to point to a peculiar experience o f the US labour market as
compared to the other countries. We will keep this in mind when we try to assess the
magnitude o f the shift in net relative demand towards skilled workers in the next
section.
n.
Has There Been a Shift in Net Demand?This section introduces a very simple labour market model that should shed some light
on what we mean by a shift in net labour demand and on how we can measure it.
a. Theorv
We consider an economy with heterogeneous labour, defined over 2 skill groups, that
produce a homogeneous output Y. The technology available to firms is represented by
the following Cobb-Douglas production function, involving the 2 labour inputs:
(1) y = a n “ ' n “ "
in which A represents the aggregate state o f technology, N is employment and constant
returns to scale are imposed so that ai +a2 = 1. As a rule, in the rest o f the chapter we
will denote skilled individuals by the index 1 and unskilled individuals by the index 2.
Equation (1) should be thought of as a long run reduced-form production function after
one has concentrated out the profit-maximising choice o f other inputs so it makes sense
to assume that there are constant returns in labour. Under perfect competition in the
^ See the February 1992 issue o f Quarterly Journal o f Economics, Davis (1992), Bound and Johnson
goods market, this gives W i=ai(Y/Ni) as the labour demand equation for input 1 - with
tti denoting its product share - from which the relative labour demand is:
W. a . N , a . 1, 1 - u .
(2) In— = In— - In— = In— - In— - In ,
W 2 CL 2 ^ 2 ^ 2 ^2 ^ " ^ 2
where L denotes total labour force, li=Li/L denotes group I’s labour force share, and
ui=(Li-Ni)/Li denotes its unemployment rate.
The technology parameter a i represents a relative demand indicator for group 1,
and therefore shifts in a i can be thought o f as being caused - among other factors - by
skill-biased change. Similarly, \\ represents a relative supply indicator for group 1. The
same clearly apphes to group 2.
Differentiation o f (2) gives:
W
(3) d in —
Ct 1 1.
d lln d in —
“ 2 ^2J
1- u d in
-I - U 2
Equation (3) gives the comparative static o f our economy. The first term in
brackets represents the shift in net relative demand towards group 1, that we identify as
the skilled. This term refers to a change in the skill composition o f the labour demand
(i.e. a change in relative labour demand) which is not perfectly matched by a parallel
change in the skill composition o f labour supply (i.e. a change in relative labour
supply). We refer to this imbalance as skill mismatch.
The mismatch index adopted here, d ln (a i/a2)- dln(li/l2), displays the property of
having the same absolute magnitude and opposite sign for the two groups. If this is the
case, sectoral unemployment rates move in opposite directions in the face o f a net
relative demand shock, as will be shown in the next section. This is one of the main
differences between this approach and the one followed in Nickell and Bell (1995) and
Another property o f our mismatch index - that derives directly from the Cobb-
Douglas specification o f the production fimction - is that it weights equally changes in
relative wages and changes in relative employment rates. This would not be the case
with a CES production technology, in which wage changes carry a higher weight than
changes in employment, insofar the elasticity of substitution between labour inputs
exceeds one (on this see, among others, Katz and Murphy, 1992). This is anotiier
important difference between the present analysis and Nickell and Bell's (1995), who
assume a CBS production fimction combining skilled and unskilled labour Avith an
elasticity o f substitution greater than one. However, our estimates below show that the
elasticity o f substitution between skills is not significantly different from one,
suggesting that a Cobb-Douglas production fimction is possibly a satisfactory
representation o f technology, making both the algebra and the empirical implementation
of our framework more easily tractable.^
Suppose now d ln (ai/a2)-dln(li/l2)>0, implying a positive net relative demand
shock for the skilled. Equation (3) says that this requires either a rise in relative wages
for the skilled, or a rise in their relative employment rate dln(l-U2)-dln(l-ui)<0, or both.
The way the total impact is split between employment and wage differentials depends
on the curvature and the position o f a wage-setting schedule, that 'will be introduced in
the next section. For small enough ui and U2, we can approximate dln( 1 -U2)-dln( 1 -ui) as
d(ui-U2), implying that a demand shock favouring group 1, with ui<U2, will increase the
difference between sectoral unemployment rates. In other words, if the evolution of
relative demand and supply is perfectly balanced, there is no need for relative wages to
change or for the difference between sectoral unemployment rates to change.
b. Evidence
Having set a broad framework for thought, we proceed by exploring the evolution o f the
demand and supply o f skills in our set of OECD countries. The evolution o f labour
supply can be easily assessed using labour force figures. As in most o f the related
literature, we treat labour supply as exogenous. With regard to the labour demand
indicator, below we estimate a more general specification for aggregate technology than
equation (1), and aim at giving possible measures for the evolution o f the relative
demand for skills. To keep things as general as possible, we proceed by estimating a
linear homogeneous CBS aggregate production fimction, involving two labour inputs:
(4) Y = A (a jN f’ + a2NP]f^‘’
where p = l-l/a < l, with a denoting the elasticity o f substitution between labour inputs.
The a 's are, once more, some relative productivity indexes (such that a i + a2= l ), and A
represents total factor productivity. Profit maximisation yields the following relative
demand for inputs:
N, W, a ,
(5) In—— = - o l n ——4 -c ln —^
^ 2 ^ 2 « 2
Due to lack o f data on group-specific productivities, we use a linear time trend as a
proxy for (log) relative productivities, as in Katz and Murphy (1992). Higher powers of
the time trend were included during estimation and found non significant. Moreover, a
common elasticity o f substitution across countries is imposed between the two labour
inputs, to obtain a measure o f the "average" elasticity o f substitution in OECD
countries. The intercept term and the trend coefficient are allowed to differ across
countries. Estimation is performed for those six countries on which wages are available.
N W
(6) In = + a j ^ t - a l n + 8^^
: ^ c 2 t W ^ 2 t
where c and t index respectively countries and time and 8 is an error term. In order to
improve the precision o f our estimates, estimation is performed on a system of
seemingly-unrelated equations such as (6), with the cross-equation restriction o f a
common a. The results are reported in Table 1. The fit o f all equations is close to
perfect. The estimate o f the elasticity of substitution equals 1.059 (s.e. 0.123), and a
simple t-test on a does not lead to a rejection o f the null hypothesis o = l at standard
significance levels."^
This suggests that - over our set o f OECD countries - the production fimction
can be legitimately approximated by a Cobb-Douglas specification. This in turn allows
to exploit the useful properties o f Cobb-Douglas production functions, so that we can
measure the growth rate in relative demand by estimating growth rates in wage bill
shares.
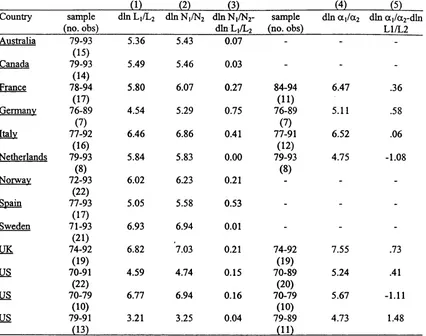
Table 2 reports estimated annual growth rates o f the following variables: relative
labour supply L1/L2, relative employment N1/N2, relative employment rates
(Ni/Li)/(N2/L2), relative demand a \/a2, relative demand net of relative supply
( a i/a2)/(li/l2). The estimates for these last two variables are computed only for those
countries for which wage data are available. Recall finally that, for small enough
unemployment rates, the growth rate in relative employment rates provides an
approximation for the change in the difference between the groups' unemployment
rates.
A few things are worth mentioning. First, all OECD countries experienced a
columns 1, 2 and 4 are significantly positive and o f comparable magmtude). Second,
this tendency towards skill upgrading meant a higher unemployment rate differential
between the unskilled and the skilled in France, Germany, Spain and Italy, and, to a
lower extent, in the UK, Norway and the US (see column 3). Third, demand for skills
grew in any o f the countries we have data for. Finally, column 5 shows that there has
been a pronounced shift in net relative demand against the unskilled in the US (during
the 1980s only) and, but to a more limited extent, in France, Germany and Italy. The
UK is somewhat in an intermediate position, with a shift in relative demand about half
the one which occurred in the US during the 1980s and about twice the one which
occurred (on average) in continental Europe. There is a strong net relative demand shift
against the skilled in the Netherlands. This is actually consistent with the fact that the
unemployment differential did not really change in this country, while wage differential
fell (see also OECD, 1993,1994b, Table 7.A.1).
Looking more in depth at the US, the magnitude o f the shift during the 1980s
appears notably higher when compared to any other country (no such distinction
between decades is made for other countries, because in no other country is such a
change found between the 1970s and the 1980s). A closer look at colunms 1 and 4
illustrates that a substantial deceleration in the evolution o f the supply o f skills - rather
than an acceleration in demand - seems responsible for the greater gap between the
demand and the supply of skills in the US during the 1980s, a fact pointed out by
several other authors (see for example Katz and Murphy, 1992).
This result might be partly due to the different classification used across the set ,
o f countries. In particular, if one is willing to assume concavity in the growth of
educational attainment in the population, this could imply that a country with higher
average skill attainment would tend to experience a less rapid growth in the proportion
of skilled workers. But this is not the case for the US. The ratio of skilled to unskilled
labour force in the US was 0.65 in 1980, and the average across the whole set of
countries was just over two thirds. And sorting countries by this ratio, the US occupies
the median position.
In conclusion, we can state that the US experienced a dramatic increase in the
gap between the demand and the supply o f skills in the 1980s, mainly due to a reduction
in the rate o f growth o f supply. This imbalance is therefore responsible for the peculiar
US experience, i.e. widening wage and unemployment differentials during the 1980s.
m . The Impact on Unemplovment
The results o f the previous section show the occurrence o f a net demand shift in the US
during the 1980s and - although to a lower extent - in the UK. Continental European
countries show evidence o f a weak increase.
The next step is to evaluate whether and to what extent these trends in skill
mismatch can be held responsible for the increase in unemployment in those countries
where a positive demand shift towards the skilled took place. In order to do so, we close
the model by combining the labour demand condition presented in section II with a
standard wage-setting relationship.
a. Theorv
The mechanism at the basis o f our model is very simple. It focuses on the idea that
wages set by workers and firms are a decreasing convex function o f unemployment,
being more responsive to unemployment variations when unemployment is low than
when it is high. This can be justified on the basis o f a bargaining model in which unions
*
and firms negotiate wages at given unemployment, and firms then chose employment at
given agreed wages.
Under the assumption that sectoral wages respond solely to sectoral
unemployment, such a convex wage function would imply that an asymmetric labour
demand shock, hitting high-unemployment workers and favouring low-unemployment
ones, would generate some dispersion in sectoral unemployment rates and therefore
increase the average unemployment rate at given average wage.
This can be easily seen from Figure 5, where the WS curve represents the wage-
setting schedule as a convex function o f the employment rate and LD represents labour
demand. Assuming for the moment that the curves WS and LD represent labour market
conditions for all types o f workers, in the initial position E there is no dispersion in real
wages or unemployment rates, and W and u therefore indicate both sectoral and average
values. If an asymmetric labour demand shock takes place, this shifts up the labour
demand schedule for skilled workers and shifts down that for unskilled workers,
therefore introducing some unemployment dispersion in the economy. Average
unemployment, being some linear combination o f ui and U2, will be situated somewhere
on the SU segment. At constant average real wage, determined by average productivity,
the aggregate unemployment rate u' would be higher than the level associated with no
unemployment dispersion u .
Below we generalise this framework, allowing for initial heterogeneity in
sectoral wage functions and labour demand functions and for endogenous changes in the
average wage, and we derive the conditions under which such an asymmetric shock can
have effects on the aggregate unemployment rate.
Sticking to a well established literature (see inter alia, Layard et a l, 1991, ch. 6)
we adopt a double-logarithmic wage function for each group i, of the form:
where Xi represents group-specific wage pressure factors, and y represents (the absolute
value of) real wage elasticity with respect to own-group unemployment. This last
parameter may vary across countries according to how labour market institutions affect
the wage-setting process, and may turn out to be a relevant aspect in the comparison of
unemployment experiences across the OECD (see chapter 4 for evidence on this).
In equation (7), wage pressure is simply defined as any force that can influence
wages at given unemployment. Typically, wage institutions can be thought o f entering
this term. In the analysis of this chapter we do not concentrate on the identification o f
these factors, but in chapters 3 and 4 we will briefly discuss the impact o f wage
institutions on unemployment in continental Europe,
The double-logarithmic specification adopted can be obtained as a log-linear
approximation to a first-order condition for wages derived firom a bargaining problem
(see Manning, 1993), and it is empirically supported by data firom a number o f countries
(see Jackman and Savouri, 1991 and Blanchflower and Oswald, 1994 for regional wage
equations and Gregg and Machin, 1994 and Manacorda and Petrongolo, 1996 for skill-
specific wage equations).
Based on the labour demand for each input i and the corresponding wage curve
we can solve for the equihbrium o f the model. If we assume that the only exogenous
variation in this economy comes firom changes in relative demand and supply o f skills,
one can show that (see Technical Appendix):
dUj =-(|)j
duj =(|)2
/ I \
a , 1, d i n d i n —
(8)
a , 1,
d i n --- d i n —
^ 2 ^2 y
where (|)i>0, (|)2>0, (j)iY<0, (|)2y<0.
A shift in net demand towards the skilled (dln(ai/a2)-dln(li/l2)>0) will rise the
skilled (dui<0). However, this effect tends to disappear as y grows. In the case o f pure
wage flexibility (y=oo), the impact o f mismatch on each unemployment rate is zero.
Everything else being equal, perfectly balanced changes in sectoral demand and
supply are consistent with constant sectoral unemployment rates and real wages. This
result naturally defines a neutrahty condition o f this model. Neutral changes in relative
labour demand and labour supply are such that sectoral unemployment rates and wages
are unaffected. This is a stronger condition than the one outlined in section U, where we
showed that, along the labour demand schedule, a zero mismatch index implies constant
relative wages and unemployment rate differentials between sectors.
Having divided the labour force into two groups, the aggregate unemployment
rate is given by u=uili+u2l2 . Therefore (and ignoring compositional effects):
(9) du = <|)
( , \
cc 1 1.
d in ---d in —
^ 2 ^2 )
where <|)>0, <|)y< 0 if
(10) - J - >W ,
W2 “ 2 ^
r
1- u V
A net relative demand shift favouring the group with better labour market prospects
(higher wages and/or lower unemployment) will tend to increase total unemployment.
This is a natural prediction o f a non-hnear model such as the one described. Any
increase in dispersion, either in wages or unemployment rates, generated by exactly
symmetric shocks for the categories involved, is bound to increase unemployment, due
to the convexities in the underlying relationships.
The whole discussion above is based the assumption o f homogeneous wage
higher among low-skill workers (see Gregg and Machin, 1994 and Blanchflower and
Oswald, 1994, although Nickell and Bell (1995) find the reverse).
In the Technical Appendix we show that if yi denotes the wage elasticity
parameter for group i, the impact o f mismatch on Ui is greater in absolute value the
higher 72 and the lower yi, and conversely for U2. Assuming a positive shift in favour of
the skilled (d ln (ai/a2)-dln(li/l2)>0 ), having yi<y2 gives a greater fall in ui and a smaller
rise in U2 with respect to the case y2= /i, therefore producing a smaller rise in aggregate
unemployment. If instead yi>y2, the effect on aggregate unemployment is magnified.
One way o f reducing the impact of sectoral labour demand and supply shocks on
unemployment is therefore to increase wage flexibility for the "losers" and reducing it
for the "winners".
b. Evidence
We are now in a position to assess quantitatively the impact o f mismatch on sectoral
and aggregate unemployment, using equations (8) and (9). In doing so we restrict the
analysis to the countries for which we have data on wages and exclude the Netherlands,
since clearly no rise in unemployment can be explained there. If anything, the trend in
net relative demand for skills is responsible for a decrease in unemployment and some
other explanations (that we have generally labelled as wage pressure) must be put
forward to account for the increase in the rate o f joblessness.
Our set o f countries is fairly representative. It includes three European countries,
with high and increasing unemployment and no increase in wage differentials, the US,
with no significant increase in unemployment and widening wage differentials, and
finally the UK, situated somewhere between these two extremes.
The results o f this exercise are reported in Tables 3-5, where we estimate the
contribution brought about by mismatch. Two alternative values o f the parameter y are
used in turn: 0.1 and 0.035. On the basis of the existing evidence, they can be taken as
upper and lower bounds for the actual value of real wage flexibility (see Blanchflower
and Oswald, 1994 and Manacorda and Petrongolo, 1996).
Tables 3 and 4 report the annual changes in skill-specific unemployment and the
contribution o f the increased imbalance between the demand and supply o f skills. In all
o f the five countries there is a tendency for mismatch to reduce skilled unemployment
and to increase unskilled unemployment. The estimates provided are somehow sensitive
to the value o f y, implying a greater contribution of mismatch to the change in
unemployment when wages are rigid. In no country except the US is mismatch able to
explain all o f the rise in the unemployment rate o f the poorly educated, and some
increase in wage pressure must be invoked to explain this trend. Analogously, since the
increase in mismatch implies a reduction in the skilled unemployment rate, some other
factors must be blamed for its modest but generalised increase. With the exception of
the US, where the rise in aggregate unemployment is negligible, only the UK shows a
substantial contribution o f mismatch to the increase in unskilled unemployment,
accounting for more than 50% o f the total rise.
Moving to aggregate unemployment. Table 5 reports the contribution o f skill
mismatch to the growth in the total rate of joblessness. Mismatch explains no more than
20% of the increase in unemployment in continental European countries, irrespective of
real wage flexibility. The relative contribution of mismatch is instead significantly
higher in the UK. Our estimates show that the increased imbalance between the demand
and the supply o f skills may account for as much as 45% o f the total rise in
unemployment between 1974 and 1992 if wages are relatively rigid. When we allow for
further wage flexibility this reduces to 28%, still leaving some rise in unemployment to
Simulations with y 19^72 (not reported in the table) give pretty similar results to
the ones reported for homogeneous y in France, Germany, Italy and the US, where the
change in unemployment explained by mismatch is however fairly small. This change is
instead significant in the UK, and it is therefore worthwhile reporting some indicative
results for yi5^2* If yi<y2, this gives an impact o f mismatch that is 31% o f the total rise
in unemployment when yi=0.035 and y2=0.05, and 25% when yi=0.08 and y2=0.1.
Conversely, if yi>y2, the imphed contribution o f mismatch to the rise in unemployment
is 55% when yi=0.05 and % y2=0.035 and 35% when yi=0.1 and y2=0.08.
To summarise, although some shift in net demand towards the skilled can be
detected in the five countries considered, only in the UK and the US - where wage and
unemployment differentials did widen - is its magnitude significant. In particular,
mismatch has the potential to explain between one fourth and one half o f the total rise in
unemployment in the UK. Overall, the UK stands out as being the only country where
the lack o f adjustment in the supply o f skills has a potential to explain the observed rise
in unemployment.
IV. Concluding Remarks
The main concern o f this chapter consisted in assessing the role played by the imbalance
between the demand and the supply o f skills in shaping the evolution o f labour market
performances across OECD countries over the last two decades. The analysis is guided
by a simple theoretical framework where aggregate technology is characterised by a
Cobb-Douglas production function involving two inputs (skilled and unskilled labour),
and wage-setting is governed by a double-log wage function. Although rather
simplified, this model proves rather enlightening in understanding the effect o f skill
When the relative demand and supply o f skills grow in the same proportion,
everything else being equal, we expect both relative wages and sectoral unemployment
rates to be unaffected. This is therefore the definition of neutrality that stems from our
model. When instead demand and supply o f skills do not grow in line with each other,
we expect that either the wage structure changes or sectoral unemployment rates move
in opposite directions, or both.
The first and probably incontrovertible result that stems from our data is that the
demand for skills increased steadily in Western countries during the period of
observation and probably long before. In continental Europe, this tendency in the
evolution o f relative demand for skills was essentially matched by an equal increase in
the relative supply o f skills but this does not seem to have happened in the US (in the
1980s) and - to some extent - in the UK. We come to this conclusion by noticing that
the increases in the relative employment rates of skilled workers in continental Europe
are of too small a magnitude to suggest that, if wages had been free to vaiy over the
period of analysis, the imbalance between the demand and supply o f skills would have
generated a change in the structure o f wages similar to the one which occurred in the
UK and the US over the same period o f observation.
At the end of the chapter we try and assess the quantitative importance o f skill
mismatch on the evolution o f unemployment across OECD economies. Skill mismatch
was negligible in continental Europe and so this cannot be blamed for the bad aggregate
performance o f its labour markets during the 1980s. In the UK instead, skill mismatch is
theoretically able to explain a substantial part o f the nearly 6 percentage points increase #
in unemployment, between 28% and 45%, across different realistic levels o f real wage
flexibility. Clearly, if one assumed that wages were perfectly flexible, then the
conclusion would be that skill mismatch is solely responsible for the rise in wage
in unemployment to be explained. We will make this point more formally in the next
chapter.
By ruling out that a shift in relative demand is mainly responsible for changes in
the employment structure and the for rise in aggregate unemployment in Europe, our
results suggest that one has to look somewhere else in order to explain the different
performances o f the labour markets on the two sides o f the Atlantic. We will try and
Data Appendix
Employment, labour force and unemployment:
Australia. Sample: 1979-1993. Source: The Labour Force Attainment, Australia.
Selection criteria: males and females, 15-64 years old. Skilled: attended highest leyel of
secondary school ayailable. Unskilled: did not attend highest leyel o f secondary school
ayailable.
Canada. Sample: 1979-1993. Source: The Labour Force Statistics, Canada. Selection
criteria: males and females, 15 years old and oyer. Skilled: with some post-secondary
education. Unskilled: up to 1983: with 13 years o f schooling (some or completed
secondary education); from 1984 onwards: with secondary education qualification.
France. Sample: 1978-1994. Source: La Population Active d'Apres VEnquete Emploi,
INSEB. Selection criteria: males and females, 15 years old and oyer. Skilled: with
baccalauréat general or yocational qualification (CAP or BEP). Unskilled: without
either o f the aboye qualifications.
Germany. Sample: 1976, 1978, 1980, 1982, 1985, 1987, 1989. Source: Mikrozenzus.
Selection criteria: males and females, 15 years old and oyer. Skilled: with yocational
qualifications {Berufsausbildung), or higher education {Fachhochschulqualifikation or
Hochschule). Unskilled: without yocational qualifications.
UK. Sample: 1974-1992. Source: General Household Survey individual record files.
Selection criteria: males, 16-64 years old; females, 16-60 years old. Skilled: with A-
level (or equivalent), including senior vocational qualification. Unskilled: with 0-level
(or equivalent), including junior yocational qualification.
Italy. Sample: 1977-1992. Source: Annuario Statistico Italiano. Selection criteria: males
scuola media superiore) including vocational qualification. Unskilled: Without
secondary school qualification.
Netherlands. Sample: 1979, 1981, 1983, 1985, 1990-1993. Source: 1979-1985:
Arbeid-skrachtetentelling; 1990-1993: Enquete Beroepssbevolking. Selection criteria:
males and females, 15 years old and over. Skilled: with senior secondary qualification,
including senior vocational training. Unskilled: with junior secondary qualification,
including junior vocational training, or below.
Norwav. Sample: 1972-1993. Source: Arbeidmarkedstatistikk (abs.), Norway. Selection
criteria: males and females, 16-74 years old. Skilled: completed secondary school level
II (gymnasiva II). Unskilled: below secondary school level II.
Spain. Sample: 1977-1993. Source: Encuesta de Poblacion Activa, INE. Selection
criteria: males and females, 16 years old and over. Skilled: some college. Unskilled:
without any college education.
Sweden. Sample: 1971-1993. Source: 1971-1986, Labour Force Survey, February
interviews; 1987-1993, all months. Selection criteria: males and females, 16-64 years
old. Skilled: with high school qualification (including secondary vocational
qualifications). Unskilled: without either of the above qualification.
United States. Sample: 1970-1991. Source: 1979-1989: Handbook o f Labor Statistics,
1989; 1990-1991: Statistical Abstract o f the US, 1992. Selection criteria: males and
females, 25-64 yeprs old. Skilled: with at least some college. Unskilled: with high
Wages:
(same skill partition as above)
France. Sample: 1984-1994. Source: INSEE, Enquete sur l'Emploi. Selection criteria:
males and females, 15 years old and over, employees only. Earning concept: gross
monthly wages.
Germanv. Sample: 1976, 1978, 1980, 1982, 1985, 1987, 1989. Source: Mikrozenzus.
Selection criteria: males and females, 15 years old and over. Earning concept: net
monthly wages.
UK. Sample: 1974-1992. Source: General Household Survey individual record files.
Selection criteria: males 16-64 years old, females 16-60 years old. Earning concept:
gross weekly earnings.
Italv. Sample: 1977-1984, 1986, 1987, 1989, 1991. Source: Indagine sui Bilanci delle
Famigliey Banca d'ltalia, individual record files. Selection criteria: males and females,
16-65 years old, employees only. Earning concept: net yearly wages.
Netherlands. Sample: 1975-1993. Source: Tijdreeksee Arbeidsrekeningen. Selection
criteria: males and females, 15 years old and over. Earning concept: gross monthly
wages.
United States. Sample: 1970-1989. Source: Annual demographic files, March Current
Population Survey (Outgoing Rotation Group). Selection criteria: wage and salary
earners, males and females, 16-69 years old, working at least 40 weeks and earning
more than one half the minimum wage on a full time basis. Earning concept: weekly
gross wages (annual earnings divided by number of weeks worked). Our thanks to Steve ,
Technical Appendix
Consider the labour demand for input 1, deriving from profit maximisation on the part
of our representative firm whose technology is described in (1):
1 - U i Ij
(A l) InWj = l n A + l n a j --- ^ —
1- U2 i j
Differentiation o f (A l) assuming that A stays unchanged gives :
1- u , H-a^dln 2
;
(A2) dl nW, = a di n--- di n—a , 1
a 1- u ,
where we have exploited the fact that d lnai= a2 d ln (ai/a2). By differentiating the wage
curve (7) (ignoring changes in wage pressure) and interacting it with (A2), it follows:
(A3, d„. -
d i n a , d in —1,a 1
1
1- u du
and similarly for group 2.
The closed-form solutions for dui and du2 is:
(A4) du, =
-and
(A5) du 2 =
U i l - U i I - U 2
a , 1, ^ d in ---d i n —
^ '2 - ^2 y
y ( 1 - U j I 1 - u ^ l + a , u ^ + a ^ u , - u , u1^^2 2 1 1 2
^ a , 1, ^
d i n---d i n —
a 2 y
Now, the denominator o f the coefficient on skill mismatch is positive. To see
this note that y(l-ui)(l-U2)>0 and (a 1 U2+ a2Ui-uiU2)=( 1 -a2)u2-(u2- a2)ui>0 if ui<U2 (and
U2<1). Since the numerator in both expressions is positive, than the impact o f skill
mismatch is negative (reducing unemployment) for the skilled (A4) and positive
(increasing unemployment) for the unskilled (A5). Also, since the derivative of the
denominator with respect to y is positive (and equals ((1-Ui)(l-U2)), it is easy to show
that the derivative of the coefficient for skill mismatch is negative (in absolute value)
for both groups.
To obtain the impact on aggregate unemployment, this is:
du = 1 j du j + 12 du 2 =
l - U i l - U j
(A6) ) + “ i«2 + “ 2 “i - “ l "
" 2 * 2 “ l - " l l l “ 2
/ I \
a , 1,
d in --- d in —
V ^ 2 ^2 J
from which (9) follows directly.
When wage flexibility varies across skills, it can be shown that:
(A?)
du, =
Yl ( l - u , ](^1- U2 j + (^Yj + a2 ( l - U 2 ) " l
^ ®2 *2 ;
(A8)
du^ =
t t j U2 I 1 - u , II 1 - u
References
Bean, C., "European Unemployment: A Survey", Journal o f Economic Literature, 32,
1994, 573-619.
Berman, E., J. Bound and Z. Griliches, "Changes in the Demand for Skilled Labour
within US Manufacturing: Evidence from the Annual Survey o f Manufacturers",
Quarterly Journal o f Economics, 109, 1994, 367-397.
Blanchflower, D., G. Loveman and L. Katz, "A Comparison of Changes in the Structure
o f Wages in Four OECD Countries", CEP Discussion Paper N o.144, 1993.
Blanchflower, D. and A. Oswald, The Wage C urve. Cambridge: The MIT Press, 1994.
Blau, F. and L. Kahn, "International Differences in Male Wage Inequality: Institutions
versus Market Forces", NBER Working Paper 4678, 1994.
Bound, J. and G. Johnson, "Changes in the Structure o f Wages in the 1980"s: An
Evaluation o f Alternative Explanations", American Economic Review, 82, 1992,
371-392.
Davis, S., "Cross Country Patterns o f Changes in Relative Wages", NBER
Macroeconomic Annuals, 1992,239-299. w
DiNardo, J., N. Fortin and T. Lemieux, "Labor Market Institutions and the Distribution
o f Wages, 1973-1992: A Semiparametric Approach", Econometrica, 64,1996,
1001-1044.
Gosling, A and S. Machin, "Trade Unions and the Dispersion o f Earnings in British
Establishments", Oxford Bulletin o f Economics and Statistics, 51, 1995, 167-84.
Gosling, A., S. Machin and C. Meghir, "What has Happened to Men's Wages since the
M id-l960sT\ Fiscal Studies, 15, 1994, 63-87.
Gregg, P. and S. Machin, "Is the UK Rise in Inequality Different?", in Barrel, R. (ed.),