An Evidence Based Approach to Developing
Pharmaceutical Service Provision Across The
Primary : Secondary Health Care Interface
Thesis submitted in accordance with the requirements of the
University of London for the degree of Doctor of Philosophy by
Catherine Anne Duggan
School of Pharmacy, University of London
All rights reserved
INFORMATION TO ALL USERS
The quality of this reproduction is dependent upon the quality of the copy submitted.
In the unlikely event that the author did not send a complete manuscript and there are missing pages, these will be noted. Also, if material had to be removed,
a note will indicate the deletion.
uest.
ProQuest 10104759
Published by ProQuest LLC(2016). Copyright of the Dissertation is held by the Author.
All rights reserved.
This work is protected against unauthorized copying under Title 17, United States Code. Microform Edition © ProQuest LLC.
ProQuest LLC
789 East Eisenhower Parkway P.O. Box 1346
Abstract
Communication breakdown has been identified in pharmaceutical service provision as patients move from their homes in the community into hospital and back home again. Discrepancies between supplies of prescribed drugs obtained between the two health care sectors, had previously been identified in patient populations perceived to be ‘at risk’, such as the elderly, or those with multiple therapies. The purpose of this work was to investigate the incidence of such discrepancies in supplies of prescribed drugs in general medical patients and to systematically develop an appropriate, workable intervention to reduce their occurrence within current practice. The perceptions of these patients and relationships with their behaviours and motivations towards their prescribed drugs were explored.
The study takes an evidence based approach to developing pharmaceutical service provision across the primary:secondary health care interface, validated by multi disciplinary perspectives and evaluated through patient-centred outcomes. The extent of the discrepancies with prescribed drugs was measured and described, the perceptions of the patients explored. The results of the Exploratory Phase were used as evidence to develop an intervention that addressed the identified problem, and relevant outcome measures were designed based on these findings.
Contents
List of ta b le s ... 12
List of fig u r e s ... 17
Acknowledgements... 19
Preface ... 20
Chapter 1 - INTRODUCTION...23
1.1 INTRODUCTION...24
1.2 A BACKGROUND TO HEALTH CARE DELIVERY IN THE U K . . 25
1.2.1 Health and medicine ... 25
1.2.2 The evolution of a health care system in the U K ... 26
1.2.3 Changing demographics and changing d e m a n d s... 28
1.2.4 The limitations of ideology in health care provision ... 29
1.2.5 Criticisms of the delivery of health care ... 30
1.2.6 Inequalities in health care ... 32
1.2.7 The implications for health care delivery... 34
1.3 CHANGES IN THE N H S ... 35
1.3.1 The evolution of a free market in the NHS ...35
1.3.2 Restructuring the delivery of health care in the U K ...36
1.3.3 The implementation of purchasers and providers ...40
1.3.4 The effect of change on London ... 41
1.3.5 Changes within the management of patient care and prescribing ... 43
1.3.6 Sharing the care across the health care in te rfa c e ... 45
1.3.7 The effect of change on d o c to rs... 47
1.3.8 Evaluating the outcomes ... 49
1.3.9 Health care delivery and the p a tie n t...51
1.4 PRESCRIBED DRUGS AND THE PATIENT...52
1.4.1 The patient and t h e ‘Sick Role’ ... 52
1.4.3 Patient ad h eren ce... 54
1.4.3.1 Outcomes applied to ad h eren ce... 54
1.4.3.2 Improving a d h e ren c e... 56
1.4.4 Response to illn e ss ...57
1.4.4.1 Atheoretical approaches... 57
1.4.4.2 The communication m o d e l... 58
1.4.4.3 Social cognition m o d e ls... 59
1.5 THE EFFECT OF CHANGE ON PHARM ACY...62
1.5.1 The role of the p h arm acist...62
1.5.1.1 The role of the hospital p h a rm a c ist... 62
1.5.1.2 The role of the community pharmacist ...63
1.5.2 Identification and classification of prescription e rro rs... 65
1.5.3 Identifying problems with prescribed drugs following discharge from hospital ... 66
1.5.4 Improving information transfer between hospital and c o m m u n ity ...67
Chapter 2 - AIMS OF THE RESEARCH... 69
2.1 THE DEVELOPMENT OF RESEARCH QUESTIONS... 70
2.2 THE PRINCIPAL RESEARCH QUESTIONS ...71
2.3 OPERATIONALISATION OF PRINCIPAL HYPOTHESES: DEVELOPMENT OF AIMS ...72
Chapter 3 - MATERIALS AND M E T H O D S... 74
3.1 EXPERIMENTAL M ETH O D S... 75
3.1.1 The Research P rocess... 75
3.1.2 Methods of S am pling ... 78
3.1.3 Methods of Questionnaire D e s ig n ...80
3.1.4 Methods of P ilo tin g ... 85
3.1.5 Consensus M e th o d s ... 85
3.1.5.1 The Delphi process ... 86
3.1.5.3 The consensus development p a n e l... 87
3.1.6 Qualitative M ethods... 88
3.2 DATA IS S U E S ...90
3.2.1 Data M anipulation... 90
3.2.2 Quality Control M e th o d s... 91
3.2.3 Testing for Reliability and Validity in the D a ta ... 92
3.2.3.1 Methods of ensuring reliability ...92
3.2.3.2 Methods of ensuring v a lid ity ...93
3.3 METHODS OF A NALYSIS... 95
3.3.1 Methods of Quantitative A n a ly sis... 95
3.3.2 Factor Analysis ... 95
3.3.3 Further methods for interpreting data obtained from comparison trials . . . . 97
3.3.4 Methods of Qualitative A n a ly sis...98
3.3.4.1 Computer Assisted Analysis ... 102
3.4 STUDY MATERIALS... 103
3.4.1 The Participating Agencies ... 103
3.4.1.1 The Royal Hospitals NHS Trust ... 103
3.4.1.2 East London and the City Health A uthority... 106
3.4.2 The Interviewers ... 110
3.4.3 Administrative S u p p o r t...110
3.4.4 Academic and Practical Support ...I l l Chapter 4 - EXPLORATORY P H A S E ...112
4.1 EXPLORATORY PHASE PERSPECTIVE... 113
4.1.1 Aims of the s tu d y ... 113
4.1.2 Objectives ... 113
4.2 EXPLORATORY PHASE METHODS...114
4.2.1 The study design ... 114
4.2.2 Ethical Approval ... 115
4.2.4 Piloting the interview questionnaire ... 115
4.2.5 Inclusion C rite ria ... 116
4.2.6 Patient R ec ru itm en t... 116
4.2.7 Data Collection ... 117
4.2.8 Coding the data ...118
4.2.8.1 Quantitative data coding ... 118
4.2.8.2 Qualitative data coding ... 118
4.2.9 Classifying a discrepancy...119
4.2.10 The Delphi panel ... 120
4.3 EXPLORATORY PHASE RESULTS AND ANALYSIS... 122
4.3.1 Patient recruitm ent... 122
4.3.2 Patient d a ta ... 122
4.3.2.1 Patient dem ographics...122
4.3.2.2 Patient characteristics... 126
4.3.3 Drug d a t a ... 131
4.3.3.1 Describing the drugs o b serv ed... 131
4.3.3.2 Describing the discrepancies observed ... 132
4.3.4 Exploring the patient and drug d a t a ... 136
4.3.5 The Delphi P a n e l ... 147
4.3.5.1 Testing the reliability of the judges ...147
4.3.5.2 Exploring the views of the J u d g e s ...149
4.3.6 Analysis of the semi-structured interview questionnaire...151
4.4 EXPLORATORY PHASE DISCUSSION...172
4.4.1 Discussion of the study d e sig n ... 172
4.4.2 Discussion of the data ...173
4.4.2.1 The patient sa m p le ...173
4.4.2.2 The drugs and discrepancies ...174
4.4.3 The exploration of patient and drug d a t a ...177
4.4.5 Discussion of the semi-structured interview questionnaire...179
4.5 EXPLORATORY PHASE CONCLUSIONS ... 199
4.5.1 Methodological difficulties experienced during the Exploratory Phase . .. 199
4.5.2 The limitations of the Exploratory P h a s e ... 200
4.5.3 Conclusions of the Exploratory P h a s e ... 201
Chapter 5 - DEVELOPMENT P H A S E ... 202
5.1 DEVELOPMENT PHASE PERSPECTIVE... 203
5.1.1 A im s ... 203
5.1.2 Objectives ...203
5.2 THE DEVELOPMENT PHASE ...204
5.2.1 Introduction ... 204
5.2.2 A systems approach to classifying the discrepancies... 204
5.2.3 Applying the systems classification process to the data ... 206
5.2.4 The discrepancies and associated prescribed supplies: A systems classification ... 212
5.2.5 Development of the intervention design ... 214
5.2.6 Calculating the sample s i z e ...217
5.2.7 The development of the survey to o l...219
5.2.8 Developing the method of assessing the outcome of the discrepancies . . . . 221
5.2.9 Summary ...222
Chapter 6 - INTERVENTION P H A S E ... 224
6.1 INTERVENTION PHASE PERSPECTIVE... 224
6.1.1 Introduction ...224
6.1.2 Aims of the s tu d y ... 224
6.1.3 Objectives ...225
6.2 INTERVENTION PHASE METHODS ... 227
6.2.1 Introduction ... 227
6.2.2 The study design ...227
6.2.3 Ethical Approval ...229
6.2.4 Inclusion criteria ...229
6.2.5 Patient sample s i z e ... 229
6.2.6 Training the Basic-Grade pharm acists... 230
6.2.7 Piloting the survey t o o l ... 230
6.2.8 Patient recruitm ent...230
6.2.9 Data co llectio n ... 232
6.2.10 Coding the data ... 232
6.2.11 Quality control m ethods... 233
6.2.12 Classification of discrepancies... 233
6.2.13 Assessing the effects of the intervention ... 235
6.2.14 Evaluating the community pharmacy in v o lv em en t...236
6.3 INTERVENTION PHASE RESULTS AND A N A L Y SIS... 238
6.3.1 Introduction ...238
6.3.2 Patient recruitm ent...238
6.3.3 Data cleaning p ro c e s s ...241
6.3.4 Patient d a ta ...241
6.3.5 Drug d a t a ...247
6.3.6 Primary effect of the in terv en tio n ...249
6.3.7 The consensus p a n e ls ... 253
6.3.8 Secondary effect of the intervention ...255
6.3.9 Further assessment of the intervention... 258
6.3.10 Exploring the patient and drug d a t a ...260
6.3.10.1 The numbers of prescribed d ru g s ... 261
6.3.10.2 The ages of the patients ...264
6.3.10.3 The diagnoses of the p a tie n ts...265
6.3.10.5 The nationalities of the p a tie n ts ... 269
6.3.11 Community pharmacy involvement ...270
6.3.12 Implementation of the intervention into p ra ctic e... 276
6.3.13 Exploring the patient survey t o o l ... 277
6.3.13.1 Validation P ro c e s s e s ...277
6.3.13.2 Factor Analysis ... 282
6.3.13.3 Interpreting the fa c to rs ...288
6.3.13.4 Testing the reliability of the extracted f a c to r s ... 291
6.3.13.5 Exploring the factor scores ... 293
6.3.13.6 Exploring relationships between the factors and the patients ... 307
6.3.13.7 Exploring relationships between the factors and the intervention ...311
6.3.13.8 Exploring relationships between the factors and patient related System-3 discrepancies ... 316
6.3.14 Summary of the findings of the Intervention P h a s e ... 321
6.4 INTERVENTION PHASE DISCUSSION ... 323
6.4.1 Introduction ...323
6.4.2 Patient recruitm ent...323
6.4.3 Patient d a ta ... 326
6.4.4 The primary effect of the interv en tio n ... 327
6.4.5 The consensus p a n e ls ... 327
6.4.6 The secondary effect of the intervention ...330
6.4.7 Exploring the d a t a ...333
6.4.8 The community pharmacists’ in v o lv e m e n t...335
6.4.9 The patient survey ... 343
6.4.11 The limitations of the Intervention P h a s e ... 356
6.5 CONCLUSIONS ...357
6.5.1 S u m m a ry ... 358
6.5.2 Conclusions ...361
R e f e r e n c e s ... 363
A p p en d ices ... i
Appendix one Map of the East London and the City Health Authority (ELCHA), the study a r e a ... ii
Appendix two Exploratory Phase interview sc h e d u le...iii
Appendix three Exploratory Phase study protocol ... vii
Appendix four Exploratory Phase patient consent fo rm s ...x
Appendix five Exploratory Phase patient information le a f le t...xi
Appendix six Delphi panel qu estio n n aire... xii
Appendix seven Intervention Phase patient survey t o o l ... xviii
Appendix eight Intervention Phase study protocol ... xxii
Appendix nine Intervention Phase data collection fo rm ...xxv
Appendix ten Intervention Phase patient consent form ... xxix
Appendix eleven Intervention Phase patient information le a fle t...xxx
Appendix twelve Community pharmacist interview sch ed u le...xxxi
List of tables
Chapter Three:
Table 3.1 The diversity of ethnic groups in E L C H A ... 107
Table 3.2 Summary of unemployment figures in England and Wales compared with E L C H A ...108
Chapter Four: Table 4.1 Exploratory Phase patient sample ...124
Table 4.2 Characteristics of Exploratory Phase patients ... 126
Table 4.3 Drugs supplies observed at both v is its ... 131
Table 4.4 Proportions of discrepancies observed at both v is its ... 132
Table 4.5 Summary of the types of discrepancies observed ...133
Table 4.6 Frequencies of the types of discrepancies observed at both visits . . 134
Table 4.7 Proportions of patients with prescribed drugs and discrepancies . . 136
Table 4.8 The distribution of prescribed drugs and discrepancies observed . . 137
Table 4.9 Correlations between the number of drugs and the number of discrepancies ... 138
Table 4.10 Correlations between the age of the patients, the number of drugs and the number of discrepancies ... 140
Table 4.11 Partial correlations between the number of drugs and number of discrepancies, controlling for the age of the patient ...141
Table 4.12 Correlations between average knowledge scores and the number of drugs and discrepancies...142
Table 4.13 Prescribed drugs observed in males and fem ale s...143
Table 4.14 Discrepancies observed in males and fe m a le s...143
Table 4.16 The in-vivo codes describing the data elicited during the
patient interview s... 152
Table 4.17 Development of themes from the reflective coding process ... 153
Table 4.18 Summary of quotes assigned to Theme O n e ...154
Table 4.19 Display of examples of quotes in Theme One ... 155
Table 4.20 Summary of quotes assigned to Theme T w o ...156
Table 4.21 Display of examples of quotes in Theme Two ... 157
Table 4.22 Summary of quotes assigned to Theme T h r e e ... 158
Table 4.23 Display of examples of quotes in Theme T h re e ... 159
Table 4.24 Summary of quotes assigned to Theme F o u r ...160
Table 4.25 Display of examples of quotes in Theme Four ... 161
Table 4.26 Summary of quotes assigned to Theme F i v e ...162
Table 4.27 Display of examples of quotes in Theme F iv e ... 163
Table 4.28 Summary of quotes assigned to Theme S i x ...164
Table 4.29 Display of examples of quotes in Theme Six ... 165
Table 4.30 Summary of quotes assigned to Theme S e v e n ... 166
Table 4.31 Display of examples of quotes in Theme Seven ...167
Table 4.32 Summary of quotes assigned to Theme Eight ... 168
Table 4.33 Display of examples of quotes in Theme E ig h t ...169
Table 4.34 Summary of quotes assigned to Theme N in e ... 170
Table 4.35 Display of examples of quotes in Theme Nine ...171
Chapter Five: Table 5.1 Summary of the tertiary classification process: Systems classification ...205
Table 5.2 Summary of prescribed drugs: Systems classification ...207
Proportions of unintentional discrepancies:
Systems classification ...209
The types of discrepancies: Systems classification ...210
Patients, their prescribed drugs and discrepancies Systems classification ...211
Frequencies of various types of unintentional discrepancies and associated drug supplies: Systems classification...213
Representative quotes assigned to each theme from the qualitative an aly sis... 220
Data cleaning process, Intervention P h a s e ... 241
Patients’ sex: Intervention P h a s e ...242
Patients’ ages: Intervention P h a s e ... 242
Patients’ diagnoses: Intervention P h a s e ...243
Patients’ nationalities: Intervention Phase (self-reported)... 244
Proportions of diagnostic groups in the two c o h o r ts ... 245
Proportions of males and females in the two cohorts ...246
Proportion of British and no-British patients in the two cohorts . . . 246
Prescribed drugs and discrep an cies... 247
The types of unintentional discrepancies observed between supplies of prescribed d ru g s... 250
Proportions of discrepancies observed in prescribed drug supplies . 251 Proportions of discrepancies observed per p a tie n t... 252
Classifications of the unintentional discrepancy sample made by the medical p a n e l...254
Classifications of the unintentional discrepancy sample made by the pharmacist panel ... 254
Proportions of all classifications of discrepancies observed
per p atien t...257
The effects of the intervention on patients discharged from h o sp ita l... 259
Correlations between the number of drugs and the number of discrepancies ... 261
Numbers of prescribed drugs and observed unintentional discrepancies ... 263
Correlations between age, number of drugs and unintentional discrepancies ... 264
Partial correlation between the number of drugs and discrepancies controlling for age ...265
Ages of patients and observed unintentional discrepancies...266
Diagnostic groups of patients and observed unintentional discrepancies ... 267
Sex of patients and observed unintentional discrepancies... 268
Nationality groups of patients and observed unintentional discrepancies ... 269
The community pharmacists’ responses to the survey ... 271
Patient responses to the survey t o o l ... 278
Items dropped from further analysis ...280
Items retained in the survey tool following validation processes . . 281
Survey item correlation matrix ... 284
Extraction of factors from retained items ... 285
Structure matrix following oblique rotation of the five extracted fa c to rs... 287
Interpretation of the factors and related i t e m s ...290
Reliability coefficients of the extracted f a c to r s ... 292
Scores assigned to the factors for both cohorts ... 299
Comparing the scores for both cohorts ... 312 Exploring the scores for factors one, two and five
for both cohorts ... 314 Relationships between low and high scoring sub-groups
and patient related System-3 d iscrepancies...316 Relationships between the scores and System-3
discrepancies having an adverse effect ... 319 Table 6.38
Table 6.39
Table 6.40
List of figures
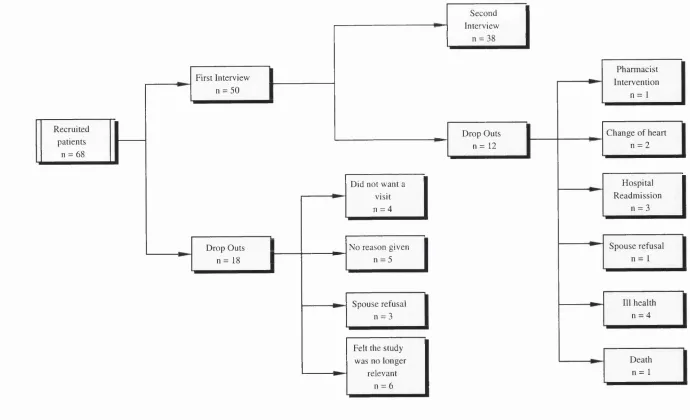
Figure 4.1 Schematic representation of Exploratory Phase
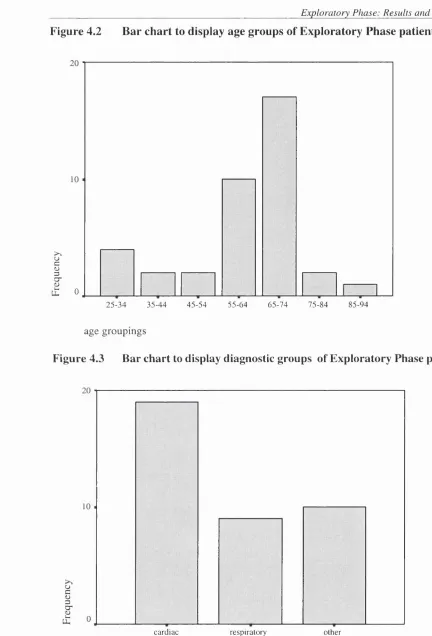
patient sample ... 123 Figure 4.2 Bar chart to display age groups of Exploratory Phase patients . . . . 125 Figure 4.3 Bar chart to display diagnostic groups of Exploratory Phase
p a tie n ts... 125 Figure 4.4 Bar chart to display patient reported visits to the community
pharmacist ...127 Figure 4.5 Bar chart to display patient reported payment of prescription
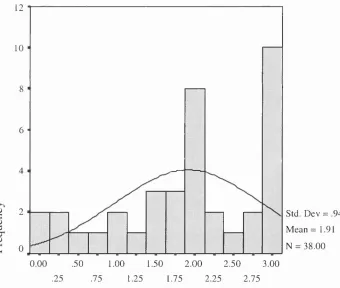
c h a rg e s ... 128 Figure 4.6 Histogram to display patients’ average knowledge of their
prescribed d ru g s ... 129 Figure 4.7 Bar chart to display patient reported methods of taking
prescribed d ru g s ... 130 Figure 4.8 Box plot to display the number of prescribed drugs
for the diagnostic groups ...144 Figure 4.9 Box plot to display the number of intentional discrepancies
for the diagnostic groups ... 145 Figure 4.10 Box plot to display the number of unintentional discrepancies
for the diagnostic groups... 146 Figure 5.1 Design of the Intervention Phase of the s tu d y ... 216 Figure 5.2 Proportions of the different types of System-2 discrepancies . . . . 218 Figure 6.1 Schematic representation of Intervention Phase patient sample . . . 240 Figure 6.2 Box plot to display the prescribed drugs and unintentional
discrepancies for both c o h o r ts ... 248 Figure 6.3a Description of the relationships between trial data ...258 Figure 6.3b Definitions describing the risk of experiencing adverse events . . . . 258 Figure 6.4 Scree plot of the extracted factors ... 286 Figure 6.5 Histogram to display the distribution of scores for factor one,
Figure 6.6 Histogram to display the distribution of scores for factor two,
with a superimposed ‘normal’ distribution curve ... 295 Figure 6.7 Histogram to display the distribution of scores for factor three,
with a superimposed ‘normal’ distribution curve ... 296 Figure 6.8 Histogram to display the distribution of scores for factor four,
with a superimposed ‘normal’ distribution curve ... 297 Figure 6.9 Histogram to display the distribution of scores for factor five,
with a superimposed ‘normal’ distribution curve ... 298 Figure 6 .10a Histogram to display the distribution of scores for factor one:
comparison c o h o r t... 300 Figure 6.10b Histogram to display the distribution of scores for factor one:
intervention c o h o rt... 300 Figure 6.11a Histogram to display the distribution of scores for factor two:
comparison c o h o r t... 301 Figure 6.11b Histogram to display the distribution of scores for factor two:
intervention c o h o rt... 301 Figure 6.12a Histogram to display the distribution of scores for factor three:
comparison c o h o r t ... 302 Figure 6.12b Histogram to display the distribution of scores for factor three:
intervention c o h o rt... 302 Figure 6.13a Histogram to display the distribution of scores for factor four:
comparison c o h o r t... 303 Figure 6.13b Histogram to display the distribution of scores for factor four:
intervention c o h o rt... 303 Figure 6.14a Histogram to display the distribution of scores for factor five:
comparison c o h o r t... 304 Figure 6 .14b Histogram to display the distribution of scores for factor five:
intervention c o h o rt... 304 Figure 6.15 proposed relationship between the intervention and patient
Acknowledgements
Firstly, I would like to acknowledge my appreciation of my supervisors, Ian Bates and Jane Hough who have helped me to see this work through from inception to completion. In particular, I would like to thank Ian Bates for his excellent advice and extreme patience during this work.
My thanks extend to both Professor Roger Feldman who helped me to develop and carry out my research work and for giving me insight into epidemiological techniques and Chris Barrett, who promoted my work throughout pharmacy within the Trust. I greatly appreciate the opportunities afforded me by North Thames Research and Development Department and thank them for funding this PhD, in the initial stages through Mary Tompkins and Steven Curtis and, most recently, through a successful application to the Responsive Funding Group.
I would like to thank all of the people who facilitated the project. My thanks extend to the Pharmaceutical and Medical Advisors at East London and the City Health Authority, the pharmacy staff at the Royal London Hospital for their active participation and the nursing staff on the wards for assisting patient recruitment throughout the entire study period. Thanks also to the hospital and community physicians and pharmacists who comprised the Delphi panels during the Exploratory Phase, the consultants and clinical pharmacists who comprised the consensus panels during the Intervention Phase, and all the community pharmacists who participated in the Intervention Phase. I would like to extend special thanks to all the study recruits, who were so willing to take part and allowed me to develop some insight into their perceptions of and behaviours towards their prescribed drugs.
Preface
The purpose of this work was to investigate discrepancies in supplies of prescribed drugs of general medical patients, to explore the findings and develop an intervention to reduce their occurrence, that would modify the current practice. In addition, the perceptions of those patients towards their prescribed drugs and illness and any relationships between these and patient related discrepancies were to be explored.
The thesis comprises six chapters. Chapter one, the Introduction, gives an overview of health care delivery in the UK, the development of the National Health Service (NHS) and the effects of health services delivery on patient and health care professional, within the context of social medicine. The provision of care to patients as they move from their homes in the community into hospital and back home again is described, together with the literature that influenced the design of this study, which exposed a lack of communication in pharmaceutical service provision. This was found to have direct effect on problems and discrepancies experienced with prescribed drugs obtained between the two health care sectors, which were identified in populations perceived to be ‘at risk’, such as the elderly, or those with multiple therapies.
Chapter two, the Aims and Objectives, describes the purpose of this work, the investigation of unintentional discrepancies between the supplies of prescribed drugs of general medical patients and the development of ways to reduce them most effectively and efficiently. The operationalisation of research questions into workable aims is described.
evidence based approach to the study enabled each phase to be based on the findings of the preceding phase. Each Phase of the research informed the next, as a continuum of hypotheses were generated and tested throughout.
Chapter four, The Exploratory Phase, is divided into five sections: aims, methods, results and analysis, discussion and conclusion. The methods section describes the ways in which prescribed drugs of general medical patients were investigated as they moved between the primary and secondary health care sectors. The exploration of patients’ perceptions of their prescribed drugs is described.
The results section of Chapter four, described the 38 patients successfully followed up, at two time points, together with their prescribed drug supplies. The section describes that the majority of unintentional discrepancies were found to occur in the supplies prescribed immediately post-discharge. The findings of the Delphi panel, a panel of doctors and pharmacists, is described. All the unintentional discrepancies were found to be important but the degree of discrimination between how important was difficult to ascertain. In addition, the processes of coding the qualitative data and grouping the codes into themes that portray their perceptions, are described.
Chapter five, the Development Phase, comprises two sections, the Aims and the Development Phase. The further classification of the discrepancies and application to the data from the Exploratory Phase is described. Where the majority of unintentional discrepancies were found to occur would be the target of the intervention. The choice of methods used to derive the outcome measures are described together with the development of the survey tool.
prescribed at discharge to general medical patients to take to their community pharmacist. The prescribed drugs of patients recruited into this group were compared with those recruited into a comparison group, discharged without such information. The results section describes the 501 patients interviewed during this Phase of the study, the comparison of discrepancies between the two patient cohorts and the exploration of their perceptions through the patient survey. In addition, an evaluation of the implementation of the intervention into practice is described, the measures of benefit to patients together with the perceptions of the community pharmacists involved.
Chapter six concludes with a discussion of the findings of the Intervention Phase, together with a review of research undertaken at the same time. The implications of the findings within the development of pharmacy as a profession and community pharmacy as a fully integrated part of the primary health care team are discussed. The findings recommend that every general medical patient be discharged with information to take to their community pharmacist, measurable patient benefit is achieved, at little additional cost. The section concludes that community pharmacists are ideally placed to ensure appropriate medicines management by these patients and gain insight into their behaviours and motivations towards prescribed drugs. The implications for further work are discussed throughout this section.
Chapter 1
1.1
INTRODUCTION
This introduction, made up of four sections, gives an overview of health care delivery in the UK and the effects of health services delivery on patient and professional, within the context of social medicine. Whereas medical and policy approaches to developing health service provision often focus on clinical gain as positive outcome, this introduction proposes that the successful development of pharmacy services require that outcomes are evaluated in a sociological context: taking the preventative rather than curative approach.
The first section of the Introduction summarises the evolution of the National Health Service in the UK (NHS) and the influence of sociological factors from inception in 1948. The effects of changes in population demographics and patient demands are discussed, together with associated inequalities in accessing health care. The second section of the Introduction describes the impact of recent changes in the NHS on both health care in the UK and the autonomy of the medical profession.
The third section of the Introduction reviews the effect of illness and prescribed drugs on the patient, discussing the adoption of the ‘Sick Role’, the interaction of doctors and patients and gives an overview of the psychological models developed to evaluate patient adherence. The fourth section of the Introduction discusses the impact of policy changes on pharmacy as a profession through recent developments in hospital and community.
1.2
A BACKGROUND TO THE DELIVERY OF HEALTH CARE IN
THE UK
1.2.1 Health and Medicine
There are two possible ways to view health; a positive view, where health is viewed as an asset or a negative view, emphasising the absence of specific illnesses, diseases or disorders. The World Health Organisation (WHO) defined health as
‘...a state of complete physical, mental and social well-being and not merely the absence of disease or infirmity’
(WHO, 1948)
The negative concept of health is closely associated with Western orthodox medicine; defining illness as having a physical origin with developed methods of explaining symptoms which feature the application of medical science to the diagnosis and treatment of disease. The dominance of the negative view, coupled with the difficulties in measuring ‘social well-being’ has implications for measuring health and health related outcomes. The emphasis is very much on mortality, morbidity and treatment statistics. Certain positive measures of health are emerging, including immunisation rates, access to counselling and the rolling General Household Survey (GHS), which asks people about their health. These provide a less one sided approach to evaluating the delivery of health care.
1.2.2 The evolution of a health care system
The evolution of principles adopted from 1911 to 1948, mainly due to the development of the prevailing schools of thought at that time, placed realistic perspectives upon the needs of the public with respect to health care delivery. The historical context rationalised the values underpinning the structure and organisation of health care and the power of medicine in society. Socialist proposals for the provision of health care by the State trace back to the early 1900s through the reforms of the Poor Law and sanitisation, which prompted government intervention to improve the health of the population. Webster (1986) argued that ‘social medicine’ was a term rarely used before 1942, that it emerged from inter-war concerns with unemployment, housing and health care oriented towards preventative medicine. At that time, the aggregated national health surveys did not reveal the growing burden of chronic illness or the effects on health of relentless unemployment and poverty, Webster (1986) describes the truer picture of deteriorating health and unemployment, all of which correlated with economic and social conditions at that time.
The short lived post-war emphasis on prevention-oriented health centres, a comprehensive health service and social medicine evolved from pressure groups, such as the Socialist Medical Association and the Committee Against Malnutrition. These groups advocated the need to tackle chronic illness whose roots lay in poverty, unemployment, bad housing and occupational conditions. Assessing the social conditions of populations in relation to their health would become the cornerstone of medical sociology. The Beveridge Report (1942) detailed a design of a comprehensive welfare state including full time employment and an overhaul of secondary education, the social security system and the health service of the nation. The Report advocated ridding society of ‘Ignorance, Idleness and Disease’ based on typical Fabian ideals that the costs of illness should fall on society rather than on the individual and that welfare spending should be regarded as an investment to increase national productivity.
between Aneurin Bevan, Minister of Health at the time, and the medical profession. The idea of a national health service had gained credibility through the formation of the Emergency Medical Service and the Beveridge R ep o rt, but proposals that doctors were to become salaried were rejected by the medical profession at that time, as a threat to their autonomy. Bevan’s vision of the health service was paternalistic; he allied himself to the Royal Colleges and negotiated the position of doctors, who were to hold a sacred place in the new system. This eventually led to a comprehensive medical service rather than a health service, whereby the delivery of care was mainly based in secondary care. Acute illness was treated in hospital and little attention was paid to prevention or health promotion, contrary to the beliefs of Beveridge. A nationally organised system of medical care ought to have equalised variations across the country, but it did not. The budget continued to be allocated according to historical precedent, so that areas best endowed in 1948, continued to be so when the government took over financial control. The medical profession had consolidated its power within the NHS.
1.2.3 Changing demographics and changing demands
According to the Fabian model, the overall economic well-being of the State would be improved if investment was made in the health of the individuals. These ideals only work, in practice, if the proportions of the working population and the dependent population (ie. elderly and children) remain constant. No account was made for rapid changes in technologies, together with increased expectations of the population and the clinicians themselves. The fall in the birth rate in Western societies as a whole is one of the dominating biological facts of the twentieth century; the average family in the 1890's was six, in the 1990's it is less than two (OCPS, 1995). In conjunction with increased life expectancy, the accumulated effect of these changes now presents policy makers with new and fundamental problems.
In the UK, the population has changed over the years. Between 1951 and 1991, the population increased from 50,225,000 to 55,508,000 with a re-distribution of age within the population; the number of people aged 65 or over is four times greater than it was at the turn of the last century (OPCS, 1991). There has also been a general decline in fertility throughout this time. There was no anticipation of the post-war ‘baby boom’ in the 1950s, nor the return to lower levels of fertility in the 1970s which have contributed to the unusual age distribution since the ‘babies’ of the boom entered the labour market, there is an increased demand for employment and a predicted increase in pressure on the welfare state when they reach retirement age. They are now adults having children of their own; the number of people bom is predicted to be higher than the number who die for the next twenty years. However, with the current fertility rate, there will be no population growth as the baby-boom generation gets older; those who are bom (plus immigrants) will equal those who die (plus emigrants). The result will be an even higher proportion of elderly in the population.
for the delivery of health and social services. Retirement, regarded as the social definition of old age, creates social, economic and psychological problems for individuals that are often disregarded when other medical problems are being assessed. Whilst economic implications are the most apparent result of retiring, the social and psychological consequences of retiring may be less apparent but more profoundly felt by the individual. In addition, the loss of family, friends and the separation from children all contribute to the loneliness and isolation felt by the elderly in a nation which places high values on youth, vitality and physical attractiveness. The growing proportion of elderly people in our society makes different demands on the health care system which must be identified in order to provide appropriate and cost-effective health care to future generations.
1.2.4 The limitations of ideology in health care provision
The theory that welfare spending would increase economic development, but was dependent on it, mirrored the beliefs of Beveridge in the 1940s. Fabian ideology had rationalised that medicine had triumphed over disease in the past and would continue to do so on a fair and equitable basis for everyone in Britain. This positive and enthusiastic approach continued until the 1960's, but began to dissolve during the 1970s. The achievements of medicine were based on outcomes, gaps between claims and achievements were under attack. Ever growing diagnoses of degenerative and chronic diseases such as schizophrenia, Alzheimer’s disease, diabetes and arthritis all served to highlight poor ‘outcomes’; survivors could be kept alive, but faced a lifetime of expensive care and treatment. In addition, advances in medical care allowed previous acute causes of mortality to be successfully treated; road traffic accidents, many cancers, coronary heart disease and respiratory diseases.
1.2.5 Criticisms o f the delivery of health care
Assessment of the effectiveness of medicine has taken two principal forms; historical analysis and evaluation of contemporary practice. In 1979, a historical analysis was undertaken by Thomas McKeown, a British doctor and demographer. He argued that medicine played only a minor role in the dramatic decline of infectious disease and the growth of UK population since the eighteenth century. Earlier that century, the main health issues were how many children lived beyond infancy, the age to which people survived and the major causes of death. McKeown undertook a search for the major determinants of health in the nineteenth century, through analysis of available epidemiological data, and attempted to eliminate factors least likely to contribute. Three factors were eventually ranked as most important; nutrition, public hygiene and contraception. More than 60% of the fall in mortality between 1850 and 1970 could be explained by a reduction in pathogenic infection from food, water and air (McKeown, 1979). Better nutrition had a beneficial effect on infant and maternal mortality and life expectancy. McKeown concluded that, despite the prestige which modem medicine has acquired, the main reason for the decreases in mortality rates were due to effective sanitation, better nutrition, control of sewage and a general improvement in hygiene.
Archie Cochrane, an epidemiologist, was influenced by experiences in the Second World War, where he had almost no medicines to treat fellow prisoners. Yet, he noticed that many recovered. Cochrane (1972) argued that there was little or no standard imposed in medical intervention and that it often resulted in an iatrogenic disease. His research also exposed the uneven distribution of power that exists between the doctor and patient and how this disempowered the patient’s right to knowledge or information. This issue has gained added respect in recent years through the implementation of the Patient’s Charter (1991) which encourages patients to take part in the decision making process regarding their therapy.
radical, Marxist and feminist. These critiques play on the theory of domination by those in perceived positions of power. It is argued that doctors act as agents of social control in maintaining the previously described ‘negative approach’ to health care and the power relationship that exists between them and lay people. At their most extreme, these critiques have argued that doctors actually cause harm; Dlich (1980) argued that the ills of society result from individuals’ loss of self-reliance. This appraisal of health care delivery was described as a radical critique; the Radicals argue that the power of doctors is attributable to the autonomous control of knowledge by the doctors themselves.
The Marxist perspective views the struggle against the power of capitalism. Navarro (1976) argued that medicine dominates on an economic, political and ideological level; health care is made necessary because of the harm done by the State. Doctors aid the process by promoting the view that illness results from decisions made by individuals. By increasing the blame placed on those who suffer ill-health, such as those who continue to smoke, eat the wrong foods, or drink excess amounts of alcohol, ignores the influence of advertising on the lives of those who choose to do so.
Feminists distrust the medical model of health and its mechanisms but, unlike radicals, they do not see the medical power resting with an autonomous profession, but instead relate medical power to male domination which the practice of medicine helps to sustain. Oakley (1980) regarded the dominance of an autonomous profession and control of a highly valued science as oppressive, especially with respect to childbirth. The feminist groups have acted through the years to protect abortion rights, the welfare rights of mothers, equal opportunities of employees and a central role for women doctors within the medical profession.
support for public medical services’ and viewed the lack of effectiveness of biomedicine as a result of aiming it at curative rather than preventative goals. The silence in response to Marxist and Feminist critiques may have reflected a lack of awareness or an inner confidence in the secure position of the medical profession in health care delivery.
1.2.6 Inequalities in health care
Engels (1845) described a link between social class, death and disease following his observation of nineteenth century English society, and the effect of the environment on workers’ health. His description was strongly influenced by his Marxist beliefs; that the bourgeoisie had produced conditions of squalor, through industrialisation, and thus, created the victims of ill-health and early death. The interpretation of an earlier study by McKeown (1976) assumed that upper and middle class mortality were affected by the same factors as working class mortality. Justification for this depended on the fact that the working class made up the majority of the total populations’ mortality; inequalities existed in society.
The principal reason for over funding the richest parts of the country, at the expense of the poorest, was simply that most of the ‘prestigious’ teaching hospitals were perceived to be in London and these absorbed a high and unquestioned share of resources. The so- called Black Report (1980), concluded that the class gradients that existed in the 1930s were still present today. This has been recently validated by Cooper, Arber and Smaje (1998), who showed that the economic position of the family, especially material deprivation, is more closely associated with children’s health status than social class. The Black Report showed that the greatest burden of ill-health and disability was borne by those worst off in Society, exemplified by the maldistribution of health services at that time and the utilisation of health care amongst different classes.
There were four explanations of of inequality outlined in the Black Report. Inequality as an artefact, where inequality is explained by difficult to measure outcomes rather than being the outcome itself; inequality as a selection process, reflecting a process of social mobility in which individuals with better health move up the social hierarchy; inequality as a result of material deprivation, where a shortage of essentials, such as income and work conditions, causes inequalities; and inequality as a result of cultural deprivation, the failure of new cultural practices to penetrate the lives of lower class people within that culture. The conclusions of the Black Report were that the disparities in health service provision were unjust and needed to be addressed; it appeared that the Fabian ideals of equality had failed.
(1996) examined the relationships between cultural and behavioural and materialist and structuralist explanations and concluded that the effect of structural conditions on lifestyle should be considered when assessing the importance of these factors. Bartley et al. (1996) concluded that inequalities in health are seen when validated social class schema are used based on employment conditions and recommended that such schema should be used to inform policy makers.
1.2.7 The im plications for health care delivery
1.3 CHANGES IN THE NHS
1.3.1 The evolution of a Free M arket in the NHS
Expenditure in the NHS rose 16% between 1968 and 1978, which exacerbated the fear that resources would always be inadequate to deal with the burden of illness. Planning norms, based on achieving an equitable share of resources were introduced and, in 1970, a new method of reallocation of resources was introduced. However, the acute-hospital based specialities still dominated the demands for resource. In 1974, the NHS was re organised; unifying health services under one hierarchically organized authority. Reorganization, described at that time as the ‘managerial zenith’, was dedicated to improving management and co-ordinating links between health and social services. Cash limits were introduced by the Department of Health and Social Security (DHSS) by the Resources Allocation Party (1976), who set targets for the redistribution of resources away from richer regions to the poorer ones. This started the challenge to medical autonomy; the movement of resources away from acute services which was largely controlled by doctors.
In the 1980s, neo-liberal philosophies were adopted as a New Right approach to health care delivery evolved. There was a retreat from Marxist values, even by the more Left- Wing parties. It was rationalised that the Fabian approach rejected the ideals of a market- based welfare system and the subsequent changes in the NHS reflected the perceived need for free enterprise. Up to this point, doctors, the major users of the NHS resources, were not held responsible for their spending as there were no financial incentives to economise the use or demand of service provision. The New Right ridiculed the fact that the public tolerated standards that they would never tolerate from the private sector.
Limitations exist, however, when trying to impose a free market system within health care provision. Firstly, the term ‘need’ is subjective when used to describe health: health is not a commodity until it is absent and the patient does not have overall consumer control when they would ideally not choose to be a patient at all. Secondly, the suppliers within the NHS cannot go out of business as in a normal market situation, despite any inefficiencies. More restrictive regulations had to be imposed on the suppliers to constrain the notion of a free market. The UK Conservative Government, as elected in 1979, began their terms in office with a serious examination of how to deliver more private health care within national health policy. This was reflected by a rapidly growing private market in the early 1980's, exemplified by the offer of tax cuts to consultants for their private practice salaries.
1.3.2 Restructuring the delivery of health care in the UK
Central versus local control is a systematic problem in any complex health care system. Following the implementation of the White Paper, Patients First (1979), the new District Health Authorities (DHAs) were given more autonomy, devolving decision-making down the line to the operational units such as hospitals and community services. Two initiatives were started: the Annual Reviews of the Regional Health Authorities (DHSS, 1993); led to the development of performance indicators to define accountability for these reforms. The reviews quickly extended down the management line; RHAs reviewed the DHAs, the DHAs reviewed their unit managers, measuring the attainment of targets and goals and setting new goals for the following year. Each health authority received 147 performance indicators to enable them to compare their performance against the regional and national standards. At that time, there was no mention of patient satisfaction, public access or quality and the indicators were viewed as ‘informative tools’.
restructuring process, described as the ‘NHS strategy’. The second stage to improve the efficiency and accountability of the delivery of ‘health’ through appropriate health care services, whilst ensuring prescribers were more accountable for their budgets. The Government tackled the drug prescribing budget through the introduction of the ‘Limited L ist’ in 1984, whereby clinical autonomy was no longer automatic. This was followed by the White Paper, Promoting Better Health (1987), which initiated the management of policies throughout primary care.
These policies were introduced in the new contracts for General Practitioners (GPs) in April 1990, with the then newly established Family Health Service Authorities (FHSAs, formerly Family Practitioner Committees, FPCs), keeping records on prescribing patterns, which affected autonomy in prescribing. The Government at that time empowered the RHAs and DHAs to implement health care investigation, diagnosis, treatment, rehabilitation and continuing care together with community services and community nursing. In addition, the Government recognised the need for health promotion and health education for the nation, and targeted primary-based professionals as the providers of such services, including dentists, pharmacists, ophthalmologists, chiropodists and therapists.
technical knowledge (T). The increased use of pre-packaged medicines and the dependence on the doctor’s judgement had, arguably, shifted the profession’s I/T ratio and, in order to maintain professional status, greater use of indeterminate knowledge and skills was required. Harding, Nettleton and Taylor, (1990) argued that the deregulation of POM to P medicines, had a positive effect on the professional role of the pharmacist, reducing the dependence on physicians, previously seen as a negative factor in the professional autonomy of pharmacy.
Despite these changes, cash spending on the NHS in 1990 was two and a half times what it had been in 1979. However, a renovation of the NHS in favour of private health care was not seen to be the answer. Taylor-Gooby (1985) found that the public did not mind the two sectors of health care working side by side as this meant they always had the accessibility of the NHS as the backbone to health care, but with private medicine available for specific purposes. The public rated the private sector higher than the NHS on every dimension, except the standard of emergency care, especially with respect to waiting lists, privacy and staffing levels, but these criticisms could not easily be interpreted as evidence of a widespread decline in support for the NHS.
A consequence of the rapidly growing private market was the subsidisation of an increased number of claimants for places in residential homes for the elderly. This prompted a critical report by the Audit Committee (1986) which reviewed the provision of care in the community at that stage. In response, the Government stated a commitment to community care through thorough assessment of the needs of patients and provision of the support and services that they require, as set out in the proposals made in the White Paper, Caring for people. Community care in the next decade and beyond. (1989).
amount of care and support to help them become independent; patients should be able to live the best life possible and should be given greater autonomy in the way they live their lives. This prompted the development of a wide range of services in a variety of settings: domiciliary support to people in their own homes; respite and day care to those with more intensive needs; sheltered housing; group homes and hostels; residential homes; nursing homes and long-stay hospitals for those requiring a progressively higher level of health care. From April 1991, there was a new funding structure for those seeking public support for residential and nursing home care and a restructuring of benefit eligibility, which allowed applicants with few or no resources the same access to Income Support whether in their own homes or in residential or nursing care. Health Authorities were also expected to organise checking procedures for standards of care provided in both formal homes and the patient’s own home.
1.3.3 The implem entation o f purchasers and providers
In the mid-eighties, hospital and community professionals, such as pharmacists, tended to view their roles as distinct from one another. Parr (1986) suggested that such entrenched attitudes must be broken down and that neither hospital or community should be dismissed. These views were considered novel at the time and were taken up by the RHAs when developing policies that would best respond to integrating the provision of pharmaceutical services in both the primary and secondary sectors. The profile of management had been raised and accountability of health authorities and managers were re-enforced. By 1988 a new model of management, was introduced, based on private sector practices. At this stage, however, critics could argue that higher productivity was being achieved at the cost of pushing patients out of hospital ‘quicker and sicker’. The cumulative results of under funding throughout the 1980s could not be fully compensated for by internally generated savings and efficiency improvements. The concept of illness prevention was re-invented through GP screening projects and the whole remuneration system became performance based.
At this time, FHSAs, became responsible for assessing individual need, designing care arrangements and securing their health care delivery within available resources, in collaboration with medical, nursing and other interests. Health Authorities had to produce and publish clear plans for the development of care services within the community whilst making maximum use of the independent sector; further emphasising the desired political move towards more privatisation of health care. Central funding for the NHS and governmental accountability for a national standard of service gave equality together with local autonomy. There followed a period of flux between centralisation and decentralisation of funding and management. Although budget estimates, based on demographic pressures, advances in medical technology and the costs of implementing new government policies, such as screening programmes, had associated drawbacks, but represented a more pragmatic way of estimating funding.
1.3.4 The effect o f change on London
Proposed reforms were targeted on London, where the costs to the NHS were highest, based on high numbers of university-affiliated teaching hospitals. Unique population demographics, together with both the highest service demands and inequalities based on class, culture and access to health care in the UK, meant that these reforms were viewed with much interest.
settings. It was recommended that eight of the nine teaching schools would merge into four. Medical education and research would be further rationalised.
The Tomlinson Report (1991) recognised that whole district trusts were against the idea of the purchaser-provider split and the NHS Trust model of provider organisation. The provision of a ‘seamless service’, a continuous standard of service, between community and acute care was proposed by the single management in a Trust. Resources would be diverted from the hospital sector into primary and community services in order to bring up standards, and the rationalisation hospital services in inner London. As prestigious London teaching hospitals tended to draw resources away from the community health sector, the flexibility of clinician directorates would be disseminated through whole- district Trusts. The report identified a need for greater flexibility in the general medical services so that FHSAs would be able to achieve their strategic health objectives. Greater variety in the delivery of primary and community care was recommended through radical changes, such as the introduction of GPs in Accident and Emergency departments and the creation of extended local health centres. There would be a significant fall in the requirement for inpatient beds of inner London hospitals as a result, together with a fall in-patient flow into London as purchasers secured high quality, yet cheaper, services more locally and more efficiently. The report estimated that, by the end of the decade, there could be a surplus of beds between 2000 and 7000 depending upon the pace and extent of change.
UP A score (Jarman, 1983), some inner London districts have a score of approximately 20 (significantly more in some areas), compared with the England average of zero. Additionally, there are high proportions of people from other cultures and for whom English is not their first language. In Tower Hamlets, for example, over 50 dialects and languages are spoken. Many of these people have special needs and experience difficulties in accessing appropriate health care and advice. There are large numbers of homeless people in inner London, either in temporary accommodation or sleeping ‘rough’. It is estimated, that 15% of the population are not registered with a GP. Hospitalisation rates for emergency mental illness are higher across the inner London districts, as are the population of those detained under the Mental Health Act. Mortality from AIDS in the Thames regions alone exceeds the rest of the UK put together. Deaths from accidents, poisoning, substance abuse or violence are more prevalent than anywhere else in the country. It was difficult to rationalise such NHS reforms in the light of population demographics and the needs of London.
1.3.5 Changes within the m anagement o f patient care and prescribing
In 1992, the DHSS issued guidance on prescribing policies which addressed cases where prescribing responsibility was inappropriately transferred to GPs (EL, 91). This practice was known to cause difficulty to patients, GPs and consultants. North East Thames RHA, for example, encouraged the integration of pharmaceutical care to the population from both primary and secondary sectors. The FHSAs had also realised the need for pharmaceutical advice, through the interpretation of PACT data and the monitoring of residential care services. In June of that year, the Department of Health set up a working group of NHS professionals and managers operating policy day-to-day and charged it with examining current prescribing practices in relation to government health policy.
normally been dispensed in the community, there should be a liaison between the transferring hospital and the community pharmacist to ensure continuity. This continuity would thereby depend on the GP receiving notification of the patient’s discharge in ‘adequate tim e’ and of any changes in diagnosis and drug therapy so that ongoing treatment could be maintained. In proposing a shared care arrangement, a consultant may advise the GP which medicine to prescribe, once the appropriate information is transferred to the GP.
Together with the introduction of indicative prescribing budgets from April 1 1991, this indicated that the issue of interface prescribing had to be reconsidered. RHAs encouraged and facilitated developments to better integrate care and ensure a smooth transfer of patients from hospital to GP and vice versa. These recommendations seemed practical, logical steps in providing seamless provision of drug therapy to the patient. Issues surrounding equity in relation to the NHS were, at this time, being questioned (Whitehead, 1994; Judge and Mays, 1994; Azeem-Majeed et ah 1994). Several policies seemed to be taking the NHS away from the original goal of an equitable system, for example, the arrangements for community care and the incentives within contracting to select patients on financial grounds. It was suggested that new policies be monitored for their effects on equity with a view to national planning and debate.
1.3.6 Sharing the care across the health care interface
The concept ‘shared care’, when a GP and a hospital practitioner agree that the quality of care would be increased if that care was shared between them, was not new. The care of patients had been appropriately shared between health care sectors for a long time. Grundy (1987) had examined the delivery of community care for the elderly and the available support systems. Private institutional care continued to grow whilst other services generally failed to keep up with the needs from increased numbers of elderly. Day et al. (1987) evaluated a shared care scheme for diabetic patients and concluded that standards of supervision were often poor and erratic, requiring more input from all carers involved. Sharman and Young (1984) described the benefits of preparing for shared care through increased communication.
The implementation of the Community Care Act (in 1990) had resulted in earlier patient discharge from hospital into the community. In retrospect, the community was ill- prepared for such an outcome; patients often returned home ‘quicker and sicker’ with inadequate medical plans made for their return home. The community was not well prepared for the implementation of the Community Care Act, Worth et a l (1990) concluded that increased communication between health care professionals would reduce duplication and ensure the provisions of all areas of care as patients move between hospital and community. Essex et a l (1990) developed and evaluated a record of shared care for patients with severe mental illness to increase the effectiveness of long term care for this patient group. However, the record cards used in this study were accepted more by patients than the psychiatrists and nurses. At no stage, however, was the pharmacist approached by the study team as a professional with useful and informative skills pertaining to the drug interactions raised in the study. There was, at this time, a gap with respect to pharmaceutical input in shared care.
resources would be better channelled to those GP practices with a high number of mentally ill patients, because of the uneven distribution of this patient population. The NHS Management and Executive (NHSME, 1991) set up protocols to encourage pharmacists to develop shared care guidelines for treatment in primary and secondary care. Development of guidelines was perceived as particularly important due to the introduction of newer therapies, such as the new anti depressants, 5-HT re-uptake inhibitor which were having a dramatic effect on cost. These guidelines were perceived to have numerous benefits; they enabled cost effective integration of primary and secondary prescribing, increased knowledge of newer therapies; and provided support for GPs and community pharmacists in monitoring new therapies where responsibility was shared. Several concepts that described a more continuous process of health care delivery arose around this time which included ‘seamless care’, ‘movement of care’ and ‘total care’. Barrett and Tomes (1992) defined seamless provision as:
‘the desirable continuity in care delivery that a patient receives when they move back home from hospital, requiring both health care sectors to work in unison rather than as separate entities’.
Barrett and Tomes (1992)
Long sought after improvements in communication could be established and patient care be improved between the health sectors. South worth (1992) concluded that the results of strategic pilot studies could continue to be implemented so that service improvements be inbuilt and continuously improved. Caldicott (1992) reviewed the development of an integrated model of care in North Kensington, whereby communication between all health care professionals involved resulted in a co-ordinated delivery of care to the elderly patients in the area. The approach to research in this area was a ‘report in action’, which described what was happening without a thorough evaluation.
appropriate use of anticipated recovery pathways (ARPs) would use both human and financial resources most efficiently, most hospitals that had used ARPs had reported decreased average lengths of stay. Study days were set up to share learning about common responsibilities between health visitors and district nurses. They were regarded as a valuable opportunity to explore the complementary roles within the primary health care team, and how they could best work together in the future (Royal Pharmaceutical Society of Great Britain, 1994). Tompkins (1994) described positive ways in which pharmaceutical care could be developed, re-iterating the need for shared care protocols. Policy had shifted the provision of health care in the patient’s home with a change in the provision of pharmaceutical care and successful provision of care in the community required, not only more resources, but also greater co-operation between agencies.
1.3.7 The im pact o f policy on doctors
Friedson (1975) defined a profession as an occupation with a special form of legal power, in the case of medicine, a special position of dominance in the set of occupations that provide health care in modem society. The power of the medical profession lies in the success of having secured, by political means, a legal monopoly over the practice of healing in contemporary society. Doctors were not used to having their autonomy questioned, let alone threatened. The previously described new policies impacted heavily on the medical profession. Hart (1985) argued against the radical critique of the theory, practice and professions of contemporary medicine by looking beyond the present limits of professionalism, taking the stance that the profession had a minority of doctors who seek to conserve health in populations rather than to restore it in individuals. He followed up that doctors have never been taught to combine the curative and preventative approaches and recommended that, in light of the new developments within the NHS, doctors become more accountable to their patients.
back again and that it would not be worthwhile. Taylor (1996) recommended that clinicians accept the concept of quality management as central to their professional ethos, to maintain professional authority and protect them from imposed decisions based on inadequate understanding of health care costs and benefits. May (1991) described criticisms of fund holding; the reduction in hospital stays had created extra costs in other areas and that the acute sector could ‘blow apart’ as a result. This seemed a negative attitude to take, but one that was one representative of many. It had been rationalised that the total costs should remain the same, even though increased costs in other areas came as a result of such reforms.