! 280523961X î
Mechanisms of annexin gene-regulation
Shaun Robert Donnelly
Department of Physiology
University College London
Gower Street
London
WCIE 6BT
Thesis submitted for the degree of
Doctor of Philosophy
in the University of London
ProQuest Number: U643409
All rights reserved
INFORMATION TO ALL USERS
The quality of this reproduction is dependent upon the quality of the copy submitted. In the unlikely event that the author did not send a complete manuscript and there are missing pages, these will be noted. Also, if material had to be removed,
a note will indicate the deletion.
uest.
ProQuest U643409
Published by ProQuest LLC(2016). Copyright of the Dissertation is held by the Author. All rights reserved.
This work is protected against unauthorized copying under Title 17, United States Code. Microform Edition © ProQuest LLC.
ProQuest LLC
789 East Eisenhower Parkway P.O. Box 1346
XZ8%7I6S0G
Abstract
Members of the annexin protein family are characterised by their ability to bind to phospholipids in a calcium-dependent manner. Since their discovery in the late 70s, a number of different family members have been found in mammals, plants and lower eukaryotes, although to date, no function has been unequivocally determined for any member. The restricted tissue-distribution of the annexins suggest that regulation occurs at the gene level. M ost controversially, annexin I has been proposed to be steroid- inducible.
Both annexins I and VI were found to be unresponsive to steroids at the protein and mRNA level in a range of cell-types. Also, steroids were shown to have no effect on annexin I secretion.
Reporter gene analysis confirmed that the promoters for both the annexins I and VI genes are not steroid-inducible. Truncation mutations were used to characterise the promoter regulatory elements showing that the annexin I promoter requires a functional CAAT and TATA box for activity. In contrast, these elements are not required in the annexin VI promoter. However, it is postulated that this promoter contains an “initiator element” . Further, it is shown that both enhancers and repressors operate within the annexin VI promoter, and that a site for the transcription factor SPl is likely to be functional in-vivo.
A region within the annexin VI promoter was shown to be homologous to non-coding regions of a number of genes, including interleukin-4. This region was found to be a cell-specific enhancer/repressor of gene activity. In response to activation of the interleukin-4 gene, a cell-specific protein complex was seen to bind to a site within the homologous region. It was shown that this protein is not a member of the ST AT, NF- AT or NFkB transcription factor families. Removal of this protein-binding site
profoundly influences the enhancer/repressor activity of the homologous region. Lastly, activation of the interleukin-4 gene triggers a marked reduction in the level of annexin VI protein/mRNA specifically in Jurkat cells. This suggests that interleukin-4 and annexin VI expression may be co-ordinately regulated by the action of
Table of Contents
Abstract 2
List o f figures 7
List of abbreviations 10
Acknowledgements 11
Chapter 1 Introduction 12
1.1 Calcium-binding proteins 12
1.2 The annexin family 12
1.3 Annexin structure 13
1.4 Annexin function 14
1.5 Annexin gene structure 15
1.6 Evolution of the annexins 17
1.7 Studies on annexin promoters 18
General features of annexin promoters 19
Studies on the annexin I promoter 20
Studies on the annexin V promoter 21
1.8 The biology o f annexin I 22
Discovery and cloning of annexin I 22
Phosphorylation of annexin I in response to
Epidermal Growth Factor 23
Phosphorylation of annexin I by Protein Kinase C 25 Other post-translational modifications 25
Annexin I and steroid hormones 27
Annexin I steroid-inducibility 27
Dexamethasone and annexin I localisation 29
Annexin I and inflammation 30
Chapter 2 Materials and Methods 35
2.1 Cell lines and culture conditions 35
2.2 Extraction of total cellular proteins 36
2.3 Polyacrylamide gel electrophoresis 36
2.4 Western Blotting 37
2.5 Immunoblotting 37
2.6 Large and small scale preparation of plasmids 38
2.7 Construction o f plasmids 38
2.8 Sequencing of nucleic acids 39
2.9 RNA extraction and Northern Blotting 39
2.10 Labelling of probes and hybridisation conditions 40
2.11 Transfection of eukaryotic cells 41
2.12 Measurement of luciferase activity 42
2.13 Normalisation of transfection efficiency 42
2.14 cDNA synthesis 43
2.15 Polymerase chain reaction 43
2.16 Electrophoresis mobility shift assay 44
2.17 Oligonucleotide sequences 46
2.18 Details of nucleic-acid databases 49
2.19 Immunofluorescent localisation studies 49
Chapter 3 Analysis of annexin expression and response
to steroid hormones 51
3.1 Expression of annexin proteins in cultured human cell lines 52 3.2 The effect of dexamethasone on annexin I and VI expression 53
Western Blotting 54
Northern Blotting 56
Chapter 4 In-vitro analysis of annexin I and VI promoters 62
4.1 Principles of prom oter analysis 62
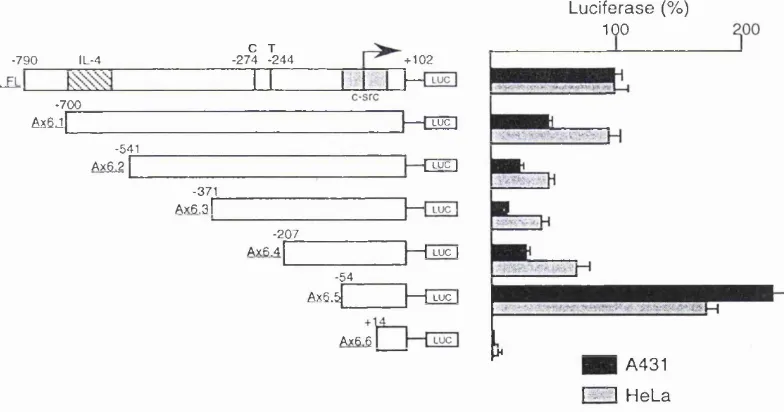
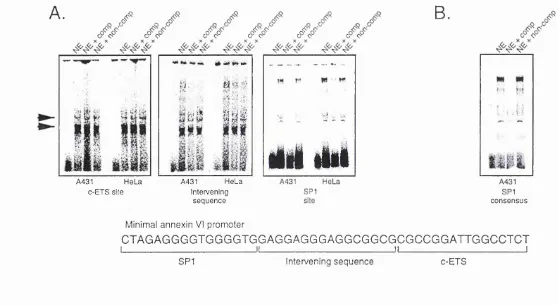
4.2 Subcloning of the annexin I and VI promoters 63 4.3 Sequence analysis of the annexin VI promoter 65 4.4 Relative activity of the annexin I and VI promoters 69 4.5 Response of the annexin promoters to dexamethasone 72 4.6 Truncation mutations of the annexin I promoter 73 4.7 Truncation mutations o f the annexin VI promoter 75 4.8 Gelshift analysis o f the annexin VI promoter 76
Chapter 5 The annexin VI-IL4 homologous region 80
5.1 Sequence alignment of the human annexin VI promoter 80
5.2 Subcloning of the annexin VI HR 82
5.3 Activity o f the HR-pGL3 promoter construct in human cells 83
5.4 Activity of the HR in the distal site 86
5.5 Analysis of annexin VI truncation mutations in Jurkat cells 90 5.6 Identification of proteins interacting with the annexin VI HR 91 5.7 Investigating the effect of PMA/A23187 on cell viability
and IL-4 expression 95
5.8 Time course of protein-binding 97
5.9 The effect of cycloheximide 98
5.10 The effect of cyclosporin-A 100
5.11 Identification of MAZ-binding by the LHR 102 5.12 Determining the 5 ’ and 3 ’ extremes of the protein-binding
site 103
5.13 Deletion of the LHR 106
Chapter 6 Discussion
6.1 The effects of dexamethasone on annexin I expression 112 6.2 Activity of the annexin promoters and response to steroids 116 6.3 Structure o f the annexin I and VI promoters 117
6.4 The annexin VI-IL4 homologous region 121
6.5 M echanism of action of the annexin V i HR 123
6.6 The identity of the LHR-binding protein 126
6.7 Implications for the IL-4 gene 129
L ist o f F ig u re s
F ig u re 1.1 Schematic illustration of annexin I primary stmcture 13 F ig u re 3.1 Expression of annexin I and VI protein in cultured human
cell lines 52
F ig u re 3.2 The effect of dexamethasone on expression of annexin I and VI
protein 54
F ig u re 3.3 The effect of dexamethasone on annexin I protein levels over an
extended time period 55
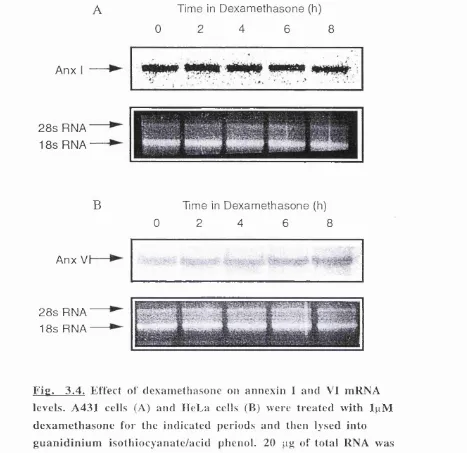
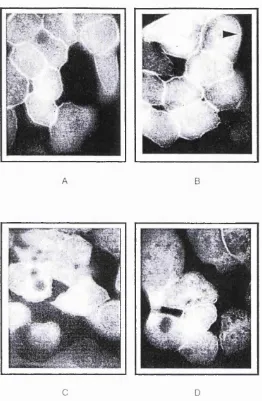
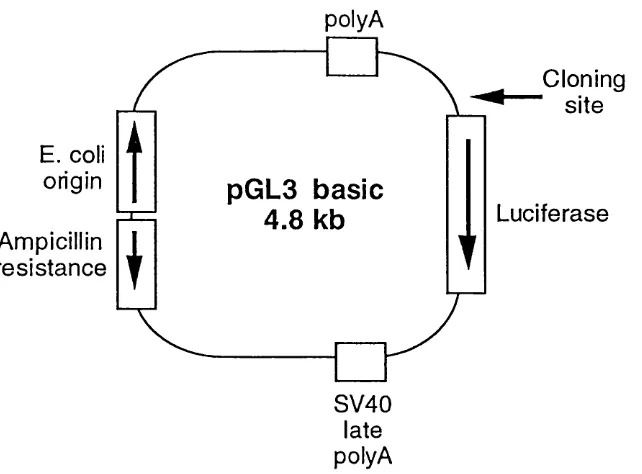
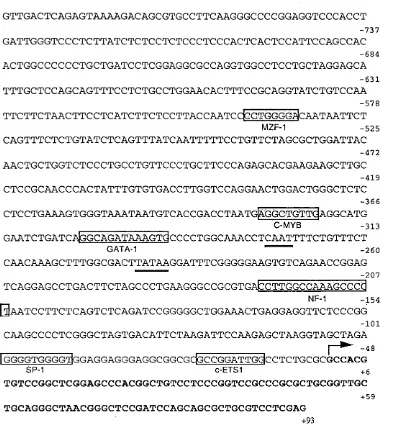
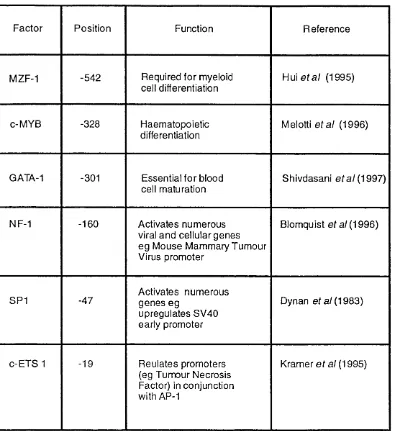
F ig u re 3.4 The effect of dexamethasone on annexin I and VI mRNA levels 57 F ig u re 3.5 Annexin I secretion in response to dexamethasone 58 F ig u re 3.6 Immunofluorescent labelling of annexin I in A 431 cells 60 F ig u re 4.1 Schematic illustration of the human annexin I promoter 64 F ig u re 4.2 Schematic illustration of the vector pGL3 Basic 65 F ig u re 4.3 Sequence of the human annexin VI promoter 67 F ig u re 4.4 Table showing the transcription factors which have putative
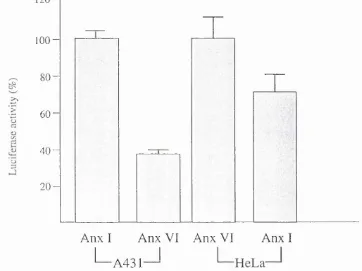
binding sites within the human annexin VI promoter 68 F ig u re 4.5 Schematic illustration of the human annexin VI promoter 69 F ig u re 4.6 The human annexin VI 3’ homologous region 70 F ig u re 4.7 Relative activities of the promoters for the human annexin I and
VI genes 71
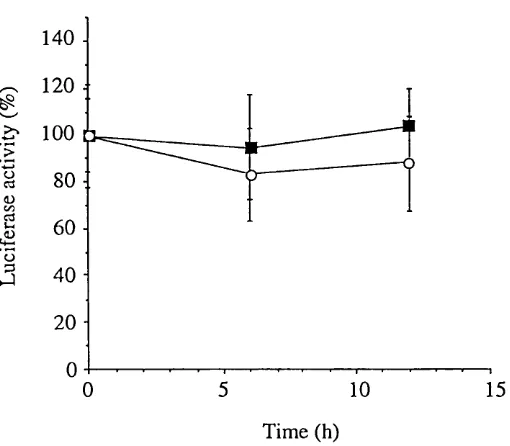
F ig u re 4.8 Time course of annexin I promoter activity in response to
dexamethasone 72
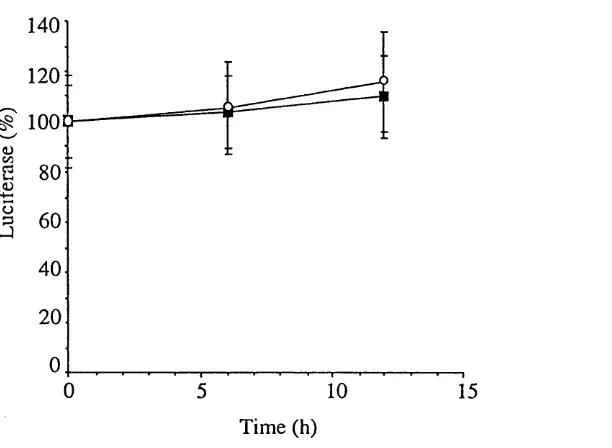
F ig u re 4.9 Time course of annexin VI promoter activity in response to
dexamethasone 73
F ig u re 4.10 Relative activity of the 5’ deletion mutations of the human
annexin I promoter 74
F ig u r e 4.11 Relative activity of the 5’ deletion mutations of the human
F ig u r e 4 .1 2 Gelshift analysis of the human annexin VI promoter 79 F ig u r e 5.1 Alignment of the human annexin VI promoter sequence 81 F ig u re 5.2 Schematic illustration of the vector pGL3 Promoter 82 F ig u re 5.3 Transfection of the HR-containing constructs into A431 cells 83 F ig u re 5.4 Transfection of the HR-containing constructs into HeLa cells 84 F ig u re 5.5 Transfection of the HR-containing constructs into Jurkat cells 85 F ig u re 5.6 Schematic illustration of the pGL3 Promoter vector containing
the HR sequence in the distal site 87
F ig u re 5.7 Transfection into A 431 cells of the HR in the distal polycloning
site 87
F ig u re 5.8 Transfection into HeLa cells of the HR in the distal poly cloning
site 88
F ig u re 5.9 Transfection into Jurkat cells of the HR in the distal polycloning
site 89
F ig u re 5 .10 Transfection of the 5 ’ truncation mutants of the human annexin
VI promoter into Jurkat cells 90
F ig u r e 5.11 Detail showing sites chosen for gelshift analysis 91 F ig u re 5.1 2 Gelshift analysis on the LHR oligonucleotide using Jurkat
extract 92
F ig u r e 5.13 Gelshift analysis on the LHR oligonucleotide using extract
from a range of cells 93
F ig u r e 5.14 Gelshift analysis on the RHR oligonucleotide 95 F ig u re 5.15 The effects of PM A/A23187 on Jurkat cell viability 96
F ig u re 5.16 Agarose gel showing IL-4 cDNA 97
site 104 F ig u r e 5.2 2 Gelshifts to determine the 3’ limits of the LHR protein-binding
site 105
F ig u r e 5.2 3 Transfection o f the ALHR-containing constructs into HeLa
cells 106
F ig u r e 5.24 Transfection o f the ALHR-containing constructs into A431
cells 107
F ig u r e 5.25 Transfection of the ALHR-containing constructs into Jurkat
cells 108
F ig u r e 5.26 W estem-blot of Jurkat cells stimulated with PM A/A23187 109 F ig u r e 5.27 W estem-blot of Jurkat cells stimulated with PMA or A 23187 110 F ig u re 5.28 W estern-blot of HeLa cells stimulated with PMA/A23187 110 F ig u r e 5.29 Northem-blot of Jurkat cells stimulated with PM A/A23187 111 F ig u r e 6.1 Diagram showing the initiator consensus sequence and the
List of Abbreviations
ATP adenosine 5’ triphosphate p-gal p-galactosidase
CAT chloramphenicol acetyltransferase CTP cytidine 5’ triphosphate
Dex dexamethasone
DMSO dimethyl sulphoxide
DTP dithiothreitol
EDTA ethylenediaminetetraacetic acid EOF epidermal growth factor
EGTA ethylene glycol-bis(p-aminoethyl ether) N,N,N’,N ’-tetraacetic acid HEPES N-2-hydroxyethylpiperazine-N’-ethanesulphonic acid
HR homologous region
LTR long terminal repeat
mRNA messenger RNA
PMA phorbol- 12-myristate-13-acetate
SDS-PAGE SDS-polyacrylamide gel electrophoresis
TBP TATA-binding protein
Acknowledgments
Thanks to Steve for letting me learn from my mistakes and for always
having time for a chat and a smutty joke.
To the members of the Moss-Lab, past and present (and what a curious
mix of people they were!), who tolerated my relentless abuse, constant
innuendoes and frequent mood-swings and made the last three and a half
years more fun than a Ph.D. is meant to be.
To the A.R.C. for realising that
money
(as well as love), makes the
world go round.
And most importantly, thanks to my parents, whose love and support
Chapter 1
Introduction
1.1 Calcium -binding proteins
Calcium has long been known to play a critical role in cell physiology, mediating processes as diverse as muscle contraction, nervous stimulation and secretion. However, it was only until the discovery of the so-called “calcium-binding proteins” that the mechanisms through which calcium exerts its effects became apparent. The first class of calcium-binding proteins was discovered in 1975 (Tufty et al, 1975). These became known as the EF hand proteins based on the helix-loop-helix structure by which calcium is bound. This class is typified by proteins such as calmodulin and troponin, each o f which contain four EF hand calcium-binding sites.
1.2 The annexin family
More recently, another class of calcium-binding proteins has been discovered, which appear to bind calcium by a more complicated structure than the EF hand proteins. Initially ascribed a variety of names, they have since been collected under the term “annexins” . The first annexin was identified in 1978 (Creutz et al, 1978). This protein appeared to mediate chromaffin granule aggregation in-vitro, and was termed synexin, later annexin VII. Since then, nine other proteins have been classified as mammalian annexins, with other representatives found in amphibia and fish. However, annexins are not unique to vertebrates, having been identified in lower phyla including
Dictyosteliiim (Doring et al, 1991), Hydra (Schlaepfer et al, 1991) and Drosophila
(Johnston et al, 1990). The proteins from Drosophila (annexin IX and X) and Hydra
cydoiiiiim is related to mammalian annexin I (Robitzki et al, 1990). The subsequent identification o f annexins in higher plants is a measure of how widespread these proteins are in living organisms (Smallwood et al, 1990).
1.3 Annexin Structure
Comparison o f the amino-acid sequences of the mammalian annexins reveals a highly conserved structure, typified by annexin I (figure 1.1). The C-terminus of the proteins contains four repeats of a conserved 70 amino acid calcium- and phospholipid-binding domain. Annexin VI is unique among annexins in containing eight of these repeats. The conservation is strongest between repeats within the same family-member, and slightly less strong between different family members. The presence of the core domain is a defining feature of the annexin family, being essential for calcium- dependent phospholipid binding.
N
♦
SITES FOR
PHOSPHORYLATION
BY EGFr AND PKC
ANNEXIN CORE
REPEATS
1
2
3
4
1
70 residues
F i g . 1 . 1 . Schematic illustration of annexin I primary structure
terminus varies widely, from the 10 residues of annexin V, to the 195 residues of annexin XL It is widely assumed that the role of the N terminus is to specify the individual functions of each annexin. This is reflected in the number and variety of post-translational modifications known to occur within the N terminus. In the case of annexin I, tyrosine and serine phosphorylation may occur via the Epidermal Growth Factor (EOF) receptor or Protein Kinase C (PKC) respectively. Phosphorylation has been shown to lower the calcium threshold required for lipid binding while
paradoxically inhibiting the ability of annexin I to aggregate phospholipid vesicles in-vitro (Ando et al, 1989., W ang et al, 1992). N terminal phosphorylation o f annexin II is shown to have similar effects (Johnstone et al, 1992).
1.4 Annexin function
There are at least as many functions proposed for annexin proteins as there are
members of the family. Since many of these putative functions are either based purely on in-vitro assays, or have not withstood closer analysis, a great deal of contradictory and conflicting dogmas have arisen concerning annexin functions. A number of the proposed roles are outlined below.
As already stated (section 1.3), annexin I is a high-affinity substrate for the EOF receptor tyrosine kinase, as well as PKC (Moss, 1992a). Annexin II is also a substrate for PKC, and also for the transforming oncogene pp60^"S^^. This suggests that these two proteins could play a role in cell growth control, transducing extracellular signals into a proliferative response. Annexin I phosphorylation, as well as other proposed roles for the protein, will be discussed in more detail below.
Annexin II has been implicated in mediating exocytosis. Among all the annexins, this protein requires the lowest level of calcium to bind to phospholipid vesicles
chromaffin cells are triggered to secrete (Creutz et al, 1987). Some reports suggest that annexin II can restore the secretory-capability of permeabilised chromaffin cells (Ali et al, 1989), whereas others contradict this (Wu et al, 1991). This represents one of the more controversial areas of annexin reseaich.
Annexin V has been reported to inhibit PKC (Schlaepfer et al, 1992), as well as blood coagulation (Andree et al, 1992), although the latter occurs only at unphysiologically high levels o f annexin V. There is convincing evidence that annexin V operates as a voltage-gated calcium-channel in artificial membranes (Rojas et al, 1990). This is supported by the crystal structure of annexin V (Huber et al, 1990), which shows a convex structure with the calcium-binding sites facing the membrane. The central region contains a putative channel which is proposed to open upon a calcium-induced conformational change (Concha et al, 1993).
It is possible that ascribing a definitive role for any annexin will await the development of gene-knockout mice. It is known that a number of labs around the world are
working towards this objective. However, a Dictyosteliiim mutant has been isolated in which the annexin VII homologue has been deleted (Doring et al, 1991), without any apparent effect on either development or viability. This suggests either that this
annexin plays no obviously essential role, or that other proteins (perhaps undiscovered annexins) are able to compensate for loss of function.
1.5 Annexin gene structure
Several annexin genes have been characterized from a wide range of different species (Smith and Moss, 1994). A number of interesting findings have emerged from these studies. Firstly, annexin genes are characterized by a high degree of sequence conservation at the boundaries between introns and exons. This is seen when
when com paring annexins from different species. There is also a high degree o f sequence conservation for the region of the genes encoding the annexin C terminal core. The determ ination o f the crystal structure of annexin V revealed that each o f the so-called "annexin core" regions in the C termini of the proteins correspond to a functional dom ain within the 3-dimensional structure. Each domain contains five alpha helices, separated by loops. In domains 1, 2 and 4, the loops between helices 1 and 2, and 4 and 5 constitute a calcium-binding site, in which a highly conserved amino-acid sequence, term ed the Geisow Motif, co-ordinates calcium. Simplistically, since these represent functionally conserved elements, it might have been assumed that each of the annexin repeats would be encoded by individual exons. The gene structure o f several annexins from different species indicate that this is not the case. Comparison o f the genes for annexin I, III, V and the second half of annexin VI show that each repeat is encoded by three different exons, one of which (exon 5) overlaps between repeats 1 and 2. H ow ever, it has been suggested that this view may be an oversimplification, based on the alpha-helical arrangement of the repeats. For repeats 1, 2 and 4, all of the intron-exon boundaries lie either at the very end of the alpha-helices or within the loops between them. Conversely, in repeat 3, which is unable to bind calcium, most of the intron-exon boundaries lie within regions encoding the alpha helices. This suggests that there is a strong evolutionary pressure to keep sequences encoding the calcium- binding domains within the same exon, but that this is not the case for repeat 3 which does not appear to bind calcium at physiological levels, (however, it must be noted that in rat annexin V, repeat 3 has been shown to bind calcium). Since calcium is bound in the interhelical regions, the role of the helices is most likely structural, ensuring that the Geisow motifs are maintained in an environment conducive to calcium-binding.
gene has only four exons, three of which are located in the core domains. However, even in these extreme cases, intron-exon boundaries are completely conserved when compared with the corresponding positions within the other annexins, again
emphasizing that annexin gene structure is under tight evolutionary restraints.
Whereas the nucleotide sequence o f the core-domains is highly conserved, that o f the N terminal domains shows significantly less conservation between the different family members (reflected by the finding that the N termini of different annexins can vary widely in length). This supports the view that the N terminal region defines the
individual function of the annexin, whereas the main function of the C terminal core is to direct the protein to the membrane in a calcium-dependent manner (a characteristic common to all the annexins). Despite this general rule, there is some degree of conservation within the N terminal sequences, particularly between those of the mammalian annexins I and II. These have homologous positions for tyrosine- phosphorylation (by the EGF receptor and pp60^“^^^ for annexin I and II
respectively), and also for phosphorylation by PKC. This suggests that these two proteins may share parallel mechanisms of regulation, reflected in the conservation of these regions between the two family members.
1.6 Evolution of the annexins
duplication of this precursor. Intriguingly, analysis of the annexin VI gene indicates a region of Z-DNA between repeats 4 and 5 (Smith and Moss, 1994). Z-DNA is thought to be especially vulnerable to recombination, supporting the theory that the eight repeats in annexin VI may have arisen by duplication of a four repeat precursor. However, an annexin-like gene containing less than four repeats has never been found, suggesting that in order to be active, an annexin must contain four or more core domains. It is not impossible that a two repeat annexin briefly existed, but may have proven too unstable to be viable in the long term. Since the discovery of annexins in lower eukaryotes, a concerted effort has been made to discover a primitive or “ancestor” annexin. However, the complete yeast genome has now been sequenced and no annexin-like gene has been found. It is still possible that a primitive annexin- like protein will be discovered in the archaebacteria, which are widely assumed to be the ancestors of eukaryotic organisms.
1.7 Studies on annexin promoters
Although the annexin protein family was discovered nearly twenty years ago, studies on the regulation of the annexin genes are still at a relatively early stage. A number of annexin proteins have been shown to be expressed in a broad range of mammalian tissues, including annexins III, V and VI (Kaetzel et al, 1989), whereas others show a remarkably restricted tissue-distribution, especially annexin XII which has only been found in intestinal epithelia (Wice and Gordon, 1992). However, the majority of
thorough understanding of how the annexin genes are activated and repressed in response to physiological stimuli would give valuable insights into the functions of the proteins they encode. It is generally accepted that the most reliable method for assessing
in-vivo promoter function is the use of reporter gene constructs in transient transfection experiments. To date, this approach has not been extensively applied to the annexins.
General features of annexin promoters
Studies on the annexin I promoter
The 5’ DNA sequences of the human and rat annexin I genes have been isolated and analysed (Kovacic et al, 1991). W hat is immediately apparent is that there is a high degree of sequence homology between the promoters from the two species (up to 81% in the most homologous regions). This suggests that the mechanisms of regulation of the annexin I gene are broadly similar in these organisms. Both promoters contain CAAT and TATA boxes at -30 and -70 base pairs respectively, although the CAAT box in the rat promoter diverges slightly from the consensus. The genes also contain a putative glucocorticoid-response element, suggesting that the genes may be inducible in response to steroid hormones. However, the GREs of the rat and human genes are in different positions within the first intron. This suggests that neither ORE may be
functionally significant. The physiological relevance of these regions is a matter of great debate within the annexin field, and must await the functional analysis of these
promoters.
While studies on the human annexin I promoter are at an early stage, the regulation of pigeon annexin I is now quite well understood. The pigeon genome contains two genes for annexin I (Horseman et al, 1992b), encoding homologous, but not identical
was shown to support transcription, and further, this was strongly enhanced by the addition of prolactin-treated cropsac extract (Xu and Horseman, 1992). Electrophoretic mobility shift assays were then performed to show that nuclear proteins bound
specifically within the promoter. One of these proteins was shown to bind in a prolactin-inducible manner to sequences 30bp upstream of the transcription start site. Although the exact identity of these proteins is unknown, it can only be a matter of time before they are isolated and characterized. However, it was shown that one o f the proteins which bind to the promoter in response to prolactin is a member of the ST AT family of transcription factors. Deletion studies on a reporter gene construct should determine whether this represents a functional interaction in-vivo.
Studies on the annexin V promoter
Annexin V distribution has been extensively studied and a clear pattern is immediately apparent. Annexin V is widely represented in mammalian tissue types, and can be found abundantly in organs as diverse as skeletal muscle, heart, liver and spleen (Kaetzel et al, 1989). This suggests that the protein is encoded by a so-called
The human and chicken annexin V genes have been cloned and were shown to be under the control of a single promoter. This has a high GC ratio, and lacks a CAAT and TATA box, suggesting that this is responsible for the broad expression pattern of the protein. Initial studies on the rat annexin V gene, showed a promoter upstream of the first exon. This had no CAAT or TATA box, but had a number of sites for
“housekeeping” transcription factors such as SPl and A PI. However, a closer analysis showed that the gene has a previously unidentified exon upstream. These two exons are referred to as lA and IB. The newly discovered exon is downstream of another
promoter, very different from the first. This has a clearly identified TATA box, and a putative glucocorticoid response element. This suggests that under normal
circumstances, annexin V levels are maintained at a constant level by the TATA-less promoter. In certain tissues, increased annexin V expression can be achieved by activation of the second promoter containing the TATA box. This is consistent with the finding that annexin V secretion is increased in differentiated U937 cells in the presence of glucocorticoids (Solito et al, 1991). Although the two promoters are upstream of two different exons ( lA and IB), the translation start site is located in exon 2, so identical proteins are produced.
1.8 The biology of annexin I
Discovery and cloning o f annexin I
Although annexin VII (synexin) was discovered in 1978, it was not until the following year that evidence arose suggesting the existence of annexin I. Studies showed that when a perfused guinea-pig lung was treated with the synthetic steroid hormone dexamethasone, a soluble factor was released into the perfusate (Flower and
strongly inhibited. A factor with similar properties was then shown to be released from dexamethasone-treated rat leucocytes (Camuccio et al, 1980). At this stage, the identity o f the factor, and even whether or not it was a protein, was unknown.
In an attempt to purify the inhibitory factor (termed macrocortin), guinea-pig lungs and rat peritoneal leucocytes were treated with dexamethasone and the released proteins resolved by column chromatography on sepharose beads (Blackwell et al, 1980). Fractions were assayed for the ability to inhibit prostaglandin generation from
untreated lungs or leucocytes. The active fractions from both sources had an apparent molecular mass o f approximately 15 kD, and were shown to undergo degradation in response to trypsin, strongly supporting the idea that macrocortin was a protein. Further, it was found that the macrocortin-mediated inhibition of prostaglandin release could be overcome by the addition of free arachidonic acid. This shows that
macrocortin inhibited at the level of arachidonate release, rather than further
downstream in the pathway. Purification of macrocortin from steroid-treated rabbit neutrophils showed the apparent molecular mass to be around 40kD, rather than the
15kD originally reported, suggesting that in the original study, some proteolysis may have occurred (Hirata et al, 1980). Human annexin I cDNA was cloned in 1986 using sequence data from tryptic fragments of purified rat annexin 1 (Wallner et al, 1986). The cDNA encodes a protein with a molecular mass of approximately 35 kD, containing one putative site for glycosylation and no known signal for secretion. Expression of the cDNA in E. coli produced functional annexin 1, possessing strong phospholipase-inhibitory properties.
Phosphorylation of Annexin I in response to Epidermal Growth Factor.
strongly phosphorylated on tyrosine in response to EGF. The identity of the protein awaited the cloning and expression of recombinant annexin I, when it was shown that the two proteins produce identical cyanogen-bromide cleavage patterns and that the site of tyrosine phosphorylation lies near the N terminus (Pepinsky and Sinclair, 1986). It was later shown that the phosphorylated tyrosine is at position 21 (Schlaepfer and Haigler, 1987).
Annexin I binds to the EGF receptor with extremely high affinity: half maximal phosphorylation occurring at around 50nM annexin I. The calcium level required for phosphorylation is equivalent to that required for annexin I to associate with the membrane (around 30|iM). This suggests that the role of calcium may be to promote membrane binding, where annexin I can interact with the EGF receptor. This is supported by replacing calcium with manganese, which also triggers annexin I membrane binding, allowing phosphorylation to occur.
The actual role o f phosphorylation is unknown but there are a number of possibilities. The time course o f phosphorylation is comparable to that of internalisation of the EGF- EGF receptor complex. The finding that annexin I phosphorylation occurs in the multi- vesicular body suggests that the protein may play a role in EGF-receptor internalisation (Futter et al, 1993). Phosphorylation may be a signal leading to degradation of annexin I, since phosphorylation on Tyr-21 renders the protein approximately 20 times more sensitive to N-terminal proteolysis (Ando et al, 1989a). However, since proteolysis is accompanied by an increased calcium-sensitivity for phospholipid-binding,
Phosphorylation of annexin I by Protein Kinase C
Purified annexin I has been shown to be a high affinity substrate for protein kinase C (PKC) in-vitro (Khanna et al, 1986, and Schlaepfer et al, 1988). By subjecting phosphorylated annexin I to amino-acid sequence analysis, Schlaepfer and Haigler showed that the m ajor sites for PKC phosphorylation are Thr-24, Ser-27 and Ser-28 each of which are phosphorylated to approximately the same extent. This was
supported by the finding that annexin I undergoes significant phosphorylation in intact bovine chromaffin cells in response to phorbol ester (Michener et al, 1986).
The function o f PKC-mediated annexin I phosphorylation is unknown. Sequence analysis o f the annexin I gene from a number of species shows that a PKC phosphorylation site is a common feature, although all three residues may not be essential for annexin I function. For example, in rodents, only Ser-27 has been conserved (Haigler et al, 1992), whereas in bovine and porcine annexin I, Ser-27 has been replaced by glycine (Glenney et al, 1987). It has also been shown that annexin V may inhibit PKC-mediated annexin I phosphorylation, suggesting a level of cross-talk between the annexins (Schlaepfer et al, 1992). However, treatment of A431 cells with phorbol ester fails to elicit detectable annexin I phosphorylation (William et al, 1989), while annexin I encoded by the pigeon anxlcp35 gene completely lacks any site for phosphorylation by PKC (Horseman et al, 1992). This suggests that rather than being a ubiquitous regulatory mechanism, PKC-mediated phosphorylation of annexin I may be cell- and tissue-specific.
Other post-translational modifications
protein. The finding that annexin I is more susceptible to proteolysis when
phosphorylated suggests that this may be a form of regulating the activity o f annexin I
in-vivo. This is supported by the discovery that A431 cells contain a calcium-activated endogenous protease which cleaves annexin I, but not annexin II, although the exact identity of this protein is unknown (Chuah and Fallen, 1989).
Annexin I has also been shown to be a substrate for the enzyme tissue
transglutaminase (Ando et al, 1989b). This enzyme catalyses the N-terminal cross- linking of annexin I molecules (on glutamine-18), leading to proteins with molecular
Q
o weights of up to 160. Although this was first observed in A431 cells, cross linking of annexin I has also been reported in human placenta (Pepinsky et al, 1989), and may be more widespread. The purpose of this modification is unclear, however, crosslinking does produce a significant reduction in the calcium requirement for annexin I to associate with the plasma membrane, suggesting that it may play a role in modulating annexin I activity.
Annexin I and steroid hormones
Annexin I was initially discovered as a steroid-inducible protein (Flower and Blackwood, 1979). A number of studies have since been performed on the role of steroids in annexin I biology. In this section, these studies will be discussed, in particular the question of whether annexin I is truly steroid-inducible.
Annexin I steroid-inducibility
As already discussed, the promoters for both the rat and human annexin I genes have been sequenced. Both genes contain putative glucocorticoid response elements (GRE), although they are in different positions (both putative GREs are in the first intron rather than the promoter). This suggests that the annexin I gene may be directly induced in response to glucocorticoids, although this may be in a cell- and tissue- specific manner. This would be consistent with the putative anti-inflammatory role of annexin I, since steroid hormones are one of the most effective anti-inflammatory treatments.
Studies on rat peritoneal leucocytes showed that upon an intraperitoneal injection of dexamethasone, a rapid induction of annexin I protein levels occurs, reaching a maximum at 2 hours (Peers et al, 1993). Increases are seen in both secreted and intracellular levels of annexin I, and the effect is prevented by the glucocorticoid receptor antagonist RU486. Further, it was shown that injection of inflammatory agents such as paraffin oil into the peritoneum also leads to increased annexin I levels, even in adrenalectomised rats, which were incapable of producing endogenous
The effects of glucocorticoids on annexin I protein levels in rat primary astrocytes has been investigated (McLeod and Bolton, 1995). In these cells, annexin I levels were found to be strongly dependent on the growth state of the cells. When cells were plated without medium change for three days, application of dexamethasone had no
discernible effect on annexin I expression. However, if the steroid was applied within 24 hours o f a change in medium, a significant induction o f annexin I was seen. This suggests that the overall level of “cell activity” has a pronounced effect on annexin I levels, cells which had reached a state of quiescence being less sensitive to
dexamethasone. It was also found that as well as causing an increase in the level of intracellular annexin I, dexamethasone also induces an increase in the amount of protein associated with the interior of the cell membrane. However, no change was observed in the level of annexin I secreted into the medium in response to
dexamethasone as compared with control cells. This is in contrast to the study of Ahluwalia et al, (1994) who showed that levels of extracellular annexin I are increased when rat skin is treated with the synthetic steroid betamethasone.
Synthetic steroid hormones are commonly used in the treatment of inflammatory lung disorders such as asthma and interstitial lung disease. While studying the effects of these compounds on alveolar macrophages. De Caterina et al, (1993) observed that levels of annexin I protein are substantially increased in patients receiving therapeutic steroids. Interestingly, annexin I levels were found to be unchanged in blood
dexamethasone causes an increase in annexin I mRNA and protein levels up to 16 hours post-application.
While the above work suggests that glucocorticoids are able to increase annexin I protein levels, a number of other studies show that this is not the case in all cell types. Treatment of human endothelial cells with dexamethasone for up to 15 hours was shown to have no effect on annexin I protein levels as judged by western blotting and
-methionine labeling of treated cells. However, no attempt was made to analyze annexin I mRNA levels in this study. Also, and in contrast to the work of McLeod and Bolton, another study on the effects of dexamethasone on cultured rat astrocytes indicated that no increase in annexin I levels were elicited by the steroid (Gebicke- Haerter et al, 1991). It was also shown that whereas freshly prepared astrocytes contained little annexin I, during culture levels increase substantially. This suggests that either the act of cell dissociation induces increased annexin I production, or that the cells themselves are secreting growth factors into the medium.
W hat the above studies show is that the effect of dexamethasone on annexin I levels may be a highly cell specific process, depending both on the growth state of the cell, as well as the state of differentiation. It can therefore be difficult to compare studies using different cell types, or indeed comparing primary cells with transformed cell lines.
Dexamethasone and annexin I localisation
Further, it was found that annexin I secretion from both of these cell types was inhibited by ammonium chloride or reduced temperature, but not by inhibitors of the classical ER/Golgi secretion pathway (such as Brefeldin A). This is consistent with the absence of any known secretory signal in the annexin I sequence. The mechanism of annexin I secretion is unknown, but may involve a previously uncharacterized pathway.
Annexin I and inflammation
Central to the process of inflammation is the generation of lipid-derived, pro- inflammatory molecules including prostaglandins, leukotrienes and
hydroxyeicosatetraenoic acids (HETEs). These are synthesized from membrane- derived lipids, specifically those containing arachidonic acid. This involves a specific class of enzymes: the phospholipases Aj. Several classes of PLAj enzymes have been discovered, and have been assigned into groups based on structure, distribution and proposed evolutionary origin (Glaser et al, 1993). Enzymes assigned to groups I, II and III are small (14kD) and operate extracellularly. Groups I and III enzymes have been found in pancreatic secretion as well as snake and bee venom. Group II includes enzymes found in human synovial fluid and mammalian platelets. Since these enzymes are found in major inflammatory regions, they are proposed to play a significant role in inflammation. Group IV contains a PLAj which shows no homology with any of the other groups, and is also considerably larger (85kD). This has been shown to have a strictly intracellular location, as well as a different phospholipid-specificity to the other PLAj groups. The 85kD PLA2 is widely assumed to play a critical role in
inflammation.
Group IIP L A2 was initially purified from rheumatic synovial fluid (Vadas et al,
initial discovery, group II PLA^ has been found in a number of locations, especially those associated with inflammation, for example, platelets (Kramer et al, 1989) and neutrophils (Lanni et al, 1983). The group II PLAj enzymes require millimolar calcium in order for full activity (Hara et al, 1989) and show no specificity towards
phospholipid substrates. This suggests that to be of significance in inflammation, PLA2 must randomly hydrolyze membrane phospholipids, a proportion of which will
contain arachidonic acid in the sn-2 position.
Group IV PLAj (also called cytosolic, or cPLAj) was purified from the human monocytic cell line U937 (Clark et al, 1990) and has since been found in virtually every tissue examined, including human platelets and neutrophils (Takayama et al,
1991 and Ram esha and Ives, 1993), as well as epithelial cells and fibroblasts (Hoeck et al, 1993 and Lin et al, 1992). cPLA^requires micromolar calcium levels for full activity and specifically cleaves arachidonate-containing phospholipids (Clark et al, 1990), suggesting that this enzyme may be critical for generation of inflammatory- mediators. Initially, it was assumed that cPLA^ hydrolyses phospholipids located in the plasma membrane. However, confocal imaging on rat basophilic leukaemia cells shows that upon ionophore/ IgE-stimulation, cPLA^ translocates from the cytosol to the nucleus (Glover et al, 1995), and also possibly the endoplasmic reticulum, suggesting that hydrolysis may occur at these sites rather than the plasma membrane.
The first work implicating annexin I in the regulation of PLA^ was performed by Hirata et al, (1983), who showed that increasing concentrations of annexin I inhibited the hydrolysis o f labelled phosphatidylcholine by pancreatic PLA2. This was also seen
with snake- and bee-venom PLA2. From this work, it was suggested that annexin I
may play a role as an inhibitor of inflammation. This seemed to tie-in with the
proposed steroid-inducibility of annexin I. It was then shown that injection of annexin I into rat paw could significantly reduce the carrageenin-induced inflammatory
called into question by studies showing that in the presence of excess phospholipid, annexin I shows no inhibitory effects on PLAj purified from rat platelets (Aarsman et al, 1987) and macrophages (Davidson et al, 1990). This led to the hypothesis that annexin I inhibits PLAj indirectly, by binding to calcium and phospholipid, which are the substrates of PLA^. This “substrate sequestration” model was supported by work in which interactions between annexin I and PLA^ were assessed by analytical
ultracentrifugation and shown to be insignificant (Ahn et al, 1988). This suggests that although annexin I may inhibit PLA^ in-vitro, at limiting substrate concentrations, it is unlikely to play a physiological role. It has since been found that annexin I inhibits platelet phospholipase C, and this is abolished in the presence of excess substrate, providing further evidence against a specific PLA^-inhibitory role (Machoczek et al,
1989).
The above work focused on the effects of annexin I on the low molecular weight PLA^s, which play a poorly defined role in inflammation. However, subsequent work has led to the discovery of the unrelated cPLAj. Although the effects of annexin I on CPLA2 have not been extensively investigated, one study suggests that annexin I may
form a direct interaction (Kim et al, 1994). Using cPLAj extracted from porcine spleen, it was found that activity was inhibited by annexin I even in the presence of excess substrate. If this is the case, then it does raise the possibility that annexin I may play a role in modulating the inflammatory process. However, this is still one of the most controversial aspects of annexin biology.
1.9 The biology of annexin VI
annexin VI appears as a doublet, reflecting the finding that two different splice forms exist (one lacking six amino acids in the seventh repeat) (Crompton et al, 1988).
Studies on the localisation of annexin VI showed that the protein is expressed at high levels in muscle tissue (Smith et al, 1986), In skeletal muscle, the protein is associated with individual | myotubes around the sarcoplasmic reticulum (Hazarika et al, 1991). It was then shown that annexin VI has pronounced effects on the sarcoplasmic ryanodine-sensitive calcium-release channel (Diaz-Munoz et al, 1990). When the channel is inserted into artificial membranes, exogenously-added annexin VI increased the mean open-time o f the channel by 50x. This was dependent on the presence of free calcium. This suggests that annexin VI may play a role in regulating muscle-
contractility. This was confirmed by mouse-transgenic studies in which annexin VI was over-expressed specifically in the heart (under the control of the a-myosin heavy chain promoter) (Gunteski-Hamblin et al, 1996). Mice showed enlarged hearts and acute cardiac and pulmonary fibrosis. Cardiomyocytes also showed reduced rates of contraction and relaxation compared with controls. This was consistent with altered cellular calcium dynamics: not only was the level of intracellular free calcium lower than in controls, but the rise in calcium upon depolarization was significantly reduced. This suggests that annexin VI may play a role in the regulation of cellular calcium homeostasis.
finding that annexin VI is post-translationally modified in a cell cycle-dependent manner, with the greatest degree of modification occurring at mitosis (Moss et al,
1992b). The nature of the modification is not well understood, but is thought to involve phosphorylation at the C-terminal cysteine. Further evidence that annexin VI may play a role in tumorigenesis was the finding that annexin VI expression is decreased and even lost in melanomas during the progression from a benign to a malignant phenotype (Francia et al, 1996). Whether this will be found in other cancerous models remains to be seen.
Annexin VI localisation studies may provide more clues on the function of the protein. Immunostaining using an anti-annexin VI polyclonal antibody revealed that the protein is frequently seen in secretory cells, for example the epithelia of salivary and sweat glands (Clark et al, 1991). Further, it was shown that although annexin VI is strongly expressed in mammary gland ductal epithelia, the protein is effectively switched-off at the onset of lactation. This led to the hypothesis that annexin VI somehow inhibits secretion, and is down regulated in response to prolactin. Although this is still hypothetical, it could be a focus for future work on annexin VI in-vivo, particularly once annexin VI knock-out mice have been generated.
A great deal of evidence has accumulated regarding the function of the annexin protein family in cellular physiology. However, to date, little work has focused on the
Chapter 2
MATERIALS AND METHODS
2.1 Cell lines and culture conditions.
A431 : Human squamous carcinoma (epithelial cells) HeLa: Human cervical carcinoma (fibroblast cells) Jurkat (J6); Human T cell leukaemia lymphoblasts Daudi: Human B lymphoblastoid
HL60: Human promyelocytic leukaemia
Adherent cells were grown in 90mm plastic dishes, suspension cells in 175cm^ flasks. Tissue-culture media was supplemented with penicillin (42U/ml), streptomycin
(42jig/ml), fungizone (2.2pg/ml) and glutamine (l.VmM). A431 and HeLa cells were grown in Dulbecco's Modified Eagle Medium (DMEM), containing 10% foetal calf serum (PCS). Jurkat and HL60 cells were grown in RPMI, with 5% PCS. Daudi cells were grown in RPM I with 10% PCS. Cells were maintained in humidified incubators, with 5% CO2. Cells were frozen in 90% PCS, with 10% dimethyl sulphoxide, and
stored in liquid nitrogen. All media and supplements were from Gibco.
2.2 Extraction of total cellular protein
Cells to be lysed were first washed in ice-cold phosphate-buffered saline (PBS) (lOmM sodium phosphate pH7.4, 147 mM NaCl). An appropriate volume of lysis buffer (lOmM Tris-HCl pH 7.4, 150 mM NaCl, 1% sodium dodecyl sulphate, 0,5 mM phenylmethylsulphonylfluoride (PMSF) and IpM of the small peptide inhibitors chymostatin, leupeptin and pepstatin) was added. Viscous samples were sheared by passage through a fme-gauge needle. Protein concentrations were determined using the Bio-Rad detergent-compatible protein assay kit, which is based on the Lowry method of protein quantitation. Samples were analysed at 750 nm on a Pharmacia Ultrospec II spectrophotometer. Standard protein concentrations were prepared using bovine serum albumin, fraction V (Sigma).
2.3 Polyacrylam ide gel electrophoresis
2.4 W estern Blotting
Proteins were transferred from the polyacrylamide gel onto PVDF membrane
(Immobilon P, Millipore) using the BioRad Electroblot Transfer Apparatus. Transfer was performed at 4°C in blotting buffer (39mM glycine, 48 mM Tris, 20% methanol), at 0.4 Amps overnight. The membrane was then blocked for one hour in PBS
containing 0.05% Tween-20 (PBS-T), and 5% defatted skimmed milk.
2.5 Im m unoblotting
Membranes were treated with primary antibodies in PBS-T, overnight at 4°C. After the primary incubation, unbound antibody was removed by three fifteen-minute washes in PBS-T, before application of the secondary antibody. The following antibodies were used:
Anti-annexin I polyclonal, raised against human denatured placental annexin I. Used at 1:5,000 dilution (Futter et al, 1993).
Anti-annexin VI polyclonal, raised against human placental annexin VI. Used at 1:500 dilution (Dubois et al, 1995).
Goat anti-rabbit IgG (alkaline phosphatase conjugated), Promega. Used at 1:10000 dilution.
2.6 Large and sm all scale preparation of plasmids.
Plasmid-containing bacteria were grown in Terrific Broth (Gibco), containing an appropriate antibiotic (either ampicillin or kanamycin at lOjig/ml). For small scale preparation of DNA, 5ml of bacterial culture was used, whereas for a large scale
preparation, 500ml was grown. Plasmid DNA was prepared by alkaline lysis according to Sambrook et a l , (1989). For large scale preparation, plasmids were further purified by double CsCl-ethidium bromide centrifugation at 60,000 rpm in a Beckman
ultracentrifuge. Quantification of nucleic acid solutions was carried out by reading the optical density at 260nm (lO D unit = 50pg/ml DNA).
2.7 C onstruction of plasmids
Restriction enzymes were obtained from New England Biolabs and were used according to the manufacturer’s instructions with the appropriate buffer. Digestion products were resolved on 1% agarose gels in Ix TAB buffer (40mM Tris-acetate pH 7.5, Im M BDTA pHS). Vector was then further digested with 5U shrimp alkaline phosphatase (Boehringer Mannheim) for 1 hour at 37°C, to prevent self-ligation. After staining with ethidium bromide, the DNA was visualised under long-wave ultraviolet light (to minimize DNA damage). Bands of interest were excised using a scalpel, and placed into dialysis tubing. These were immersed in Ix TAB and the DNA electroeluted from the gel, before being precipitated using 100% ethanol. Relative DNA levels (insert to vector) were roughly quantified by spotting a range of dilutions of DNA/ethidium bromide onto Saran-W rap and visualising under short wave ultraviolet light. The optimum molar ratio o f insert to vector was generally 10:1. Ligation was performed using the Rapid Ligation Kit (Boehringer Mannheim) for 5 minutes at room
were picked and the plasmid analysed for those containing the required insert.
Orientation of insert was determined by restriction analysis. In a number o f cases, when the distribution of restriction sites within the insert did not facilitate direct ligation, it was necessary to blunt-end the DNA. This was performed on 5' overhangs using the Kienow fragment of DNA polymerase (New England Biolabs) plus added nucleotides, according to the manufacturer’s instructions.
2.8 Sequencing of nucleic acids.
After construction, plasmids were sequenced using the Sequenase® Version 2
sequencing kit (Amersham), or in the case o f GC-rich DNA, using the Cyclist® Exo- Pfu sequencing kit (Stratagene). In both cases, the DNA was labelled using P^S]-a dATP (lOOOCi/mmol, Dupont NEN). Primers were either specific for vectors and therefore supplied by the manufacturer, or were ordered from Gibco BRL. Bands were resolved on a 6% polyacrylamide gel containing 8.3M urea (Sequagel®, National Diagnostics), run at 40 W. After fixing for 10 minutes in 10% methanol, 10% acetic acid, gels were dried for 1 hour at 80°C. Bands were visualised using a Fuji
Phosphorimager and analysed using Fuji MacBas® software.
2.9 RNA extraction and Northern Blotting
Cells were rinsed twice with ice-cold PBS and then extracted directly into guanidinium thiocyanate-phenol-chloroform according to Chomcyzmski et al, (1987). After
precipitation in 100% ethanol, the pellet was rinsed in 70% ethanol and then
resuspended in water treated with diethylpyrocarbonate (0.1% v:v). The concentration of RNA was determined by measuring the optical density at 260nm (1 CD unit = 40pg/ml RNA). The integrity of the RNA was assessed by running a small sample on a non-denaturing agarose gel, followed by staining with ethidium bromide and
For Northern blotting, RNA samples were denatured in loading mix (50% formamide, 11% formaldehyde, 0 .0 IM phosphate buffer pH 6.0). (0.5M phosphate buffer
contained 85g of Na^HPO^ and 47.7g of N aH jPO J. After heating to 70°C, samples were placed on ice and then mixed with 1/4 volume of PB-FDE (O.IM BDTA, 0.3 g/ml Ficoll, 0.5 mg/ml bromophenol blue, 0 .0 IM phosphate buffer pH 6.0). Samples were then run on a 1% agarose gel containing 6.4% (v/v) formaldehyde and lOmM
phosphate buffer pH 6.0. Gels were run for two hours and then washed extensively in water to remove the formaldehyde.
RNA was blotted onto Hybond-N® nylon membrane (Amersham) by capillary transfer. The gel was placed onto a sheet of Whatman 3MM paper, the ends of which were suspended in lOx SSC buffer (1.5M NaCl, 0.15M sodium citrate pH 7). The
membrane was layered onto the gel and then covered with several sheets o f Whatman 3MM paper followed by layers of paper towels. A 500g weight was placed over this and the set-up was left overnight for the RNA to transfer from the gel onto the membrane. After drying, the RNA was crosslinked to the membrane by exposure to ultraviolet light (302nm) for 10 seconds.
2.10 Labelling of probes and hybridization conditions
Restriction digestion was used to excise cDNA from parent plasmids. After gel
purification, labelling was performed using a random priming kit (Gibco), with 50pCi of a[^^P]-dCTP. Labelled probe was then separated from unincorporated nucleotide using the Nuctrap® kit (Stratagene).
Prehybridisation was carried out at 40°C with rotation. The labelled cDNA was denatured by boiling for 5 minutes and was then added to the membrane in the
hybridisation solution. Hybridisation was performed at 40°C overnight. The membrane was then washed in IxSSC, 0.1% SDS at 40°C for 15 minutes and then washed again in fresh solution at 50°C for 30 minutes. Bands were detected using a Fuji
Phosphorimager, and analysed using Fuji MacBas® software.
Membranes were stripped of probe by incubating in 50% formamide, 2xSSPE (20x SSPE contains 175.3g NaCl and 88.2g NaH^PO^ per litre of water) at 60°C for 1 hour and then rinsed in O.lx SSPE.
2.11 Transfection of eukaryotic cells
1. Lipofectin. Lipofectin® (Gibco) is a mixture of cationic and neutral lipids that coats DNA forming a complex which allows entry into eukaryotic cells. This was used on A431 and HeLa cells in six-well dishes, at a density of 5x10^ cells per well. 7.5 pi of lipofectin and 2pg of DNA were used per well. The transfection solution was left on the cells overnight.
2. Calcium phosphate precipitation. This was performed using the BES-method (Sambrook et al, 1989) in which the calcium phosphate DNA complex is allowed to form slowly over the cells in conditions of low pH (2-4). This method was used on A431 and HeLa cells.
buffer and respun, before being resuspended in 250pl electroporation buffer per transfection. 25pg of DNA was added and the cells were transferred to 4mm
electroporation cuvettes (BioRad). Electroporation was performed at 400V, 125jiF and infinity Ohms. Cells were allowed to recover for 5 minutes at room temperature and then transferred into 10ml complete growth medium.
2.12 M easurement of luciferase activity
Transfected cells were lysed into an appropriate volume of Promega Ix reporter lysis buffer (125mM bicine buffer pH 7.6, 0.25% Tween-20, 0.25% Tween-80). After 15 mins, cells were vortexed and then unbroken cells and nuclei were removed by
centrifugation at 15,000 rpm for 2 mins in a minifuge. Luciferase activity was measured using the Promega Luciferase assay kit in conjunction with a Packard Tricarb® liquid scintillation counter (setting: count time=lmin; single photon counting; no reference; no background subtraction; coincidence off; all channels open). 20 pi of cell extract was mixed with 100 pi of luciferase substrate in a scintillation vial before being introduced into the chamber of the scintillation counter. Care was taken to ensure that time from mixing to measurement remained as constant as reasonably possible (however, the light output produced from the reaction, using this kit, is sustained over several minutes, so errors caused by variability in timing should be minimal). Initial test experiments were performed using purified beetle luciferase (Sigma) to determine the linear range of the counter. From then on, samples were diluted so that light output always fell within this range.
2.13 Norm alisation of transfection efficiency
lOOmM p-mercaptoethanol, 1.33 mg/ml o-nitrophenyl-p-D-pyranogalactoside.
Reactions were incubated at 37°C for 1 hour. Optical density was measured at 420 nm. Dot-blotting was performed as follows: 200pl cell extract was treated with 1 pi of RNase A (lOmg/ml) for 1 hour at 37°C. 1 pi of proteinase K (lOmg/ml) was added and the reaction allowed to proceed for a further hour. Samples were then extracted with an equal volume o f phenol/chloroform (1:1) and then re-extracted with chloroform. After boiling for 5 m ins, samples were spotted onto Hybond-N® (Amersham), which had been wetted w ith lOx SSC. This was carried out using a Hybridot vacuum manifold (BRL) in which the wells had been filled with 20xSSC prior to loading. Samples were drawn onto the membrane by applying a vacuum. The membrane was allowed to dry and then DNA was cross linked by 10s exposure to u.v. (302 nm). The membrane was then hybridised as described earlier (section 2.10), using a luciferase cDNA labelled with a[^^P]-dCTP. Intensity of spots was determined by phosphorimagery.
2.14 cDNA synthesis
cDNA was synthesised using the Stratascript® RT-PCR kit (Stratagene), according to the manufacturer’s instructions. lOpg of total RNA was used for each reaction.
2.15 Polym erase chain reaction
PGR was perform ed using the Expand® High Fidelity PGR kit (Boehringer Mannheim) using concentrations of nucleotide, primer and template as recommended by the
manufacturer. Oligonucleotide primers were purchased from Gibco BRL. Nucleotide solutions were purchased from Boehringer Mannheim. PGR reaction tubes were from Perkin Elmer. Since the calculated melting temperature of the primers was usually within the range 60-65°G, the following cycling conditions were routinely used:
Step 2: 94°C for 15 sec Dénaturation
55°C for 30 sec Annealing
72°C for 1 min Elongation 10 cycles
Step 3: 94°C for 15 sec Dénaturation
55°C for 30 sec Annealing
72°C for 1 min Elongation
30 cycles, extending each elongation by 20 seconds per cycle.
Step 4: 72°C for 7 min
The reactions were performed using a Perkin Elmer DNA thermal cycler. Products were analysed on a 1% agarose gel to determine that the PCR was successful. All PCR products were sequenced to determine that no mutations had been introduced.
2.16 Electrophoretic m obility shift assays
Nuclear proteins were extracted as follows: 1x10^ cells were washed once in ice-cold PBS and then pelleted at 1200 rpm for 5 mins, before being resuspended in the following buffer: lOmM HEPES pH 7.9, lOmM potassium chloride, Im M
dithiothreitol, Im M EDTA, Im M EGTA, 0.2% Nonidet P-40, IpM of the small peptide inhibitors chymostatin, leupeptin and pepstatin, ImM sodium orthovanadate, Im M p- glycerophosphate 20mM sodium fluoride. Cells were incubated for 15 mins on ice,
and then pelleted for 2 mins. The nuclear proteins were contained in the supernatant and were either used immediately or frozen at -70°C.
Complimentary oligonucleotide pairs covering regions of interest were ordered from Gibco and redissolved at 2pmol/jil in STE buffer (lOmM Tris pH8, Im M BDTA, 100 mM NaCl). These were annealed by mixing the oligonucleotides in equimolar quantity in STE, heating to 75°C, and then slowly cooling to room temperature. These were then end-labelled, using y[^^P]-ATP (3000 Ci/mmole, NEN) and T4 polynucleotide kinase (Promega) as per the manufacturer’s instructions.
2.17 O ligonucleotide sequences
The following oligonucleotides were used for the generation of the annexin I and VI promoter constructs (all denoted 5 ’-3’):
Primers flanking the annexin I promoter:
Forward GCTCTAGATGTGGTTCCAACTCTTAGGGAGAGAC
Reverse GCTCTAGACTGATATTTGTAACTAAGTAGACC
Primers for generating 5 ’ truncations of the annexin I promoter:
AnxI-1 TAAAACAGGTTCAGAAAA
AnxI-2 CTACAAAAGTGTGCCAA
AnxI-3 TAATGCCAGTTGAATTGG
AnxI-4 CAAGTCTCCACTGCCAGT
AnxI-5 CTGCTTCTACAGGATTTA
Reverse CTGATATTTGTAACTAAGT
Primers for generating 5 ’ truncations of the annexin VI promoter:
AnxVI-2 CTGGGGACAATAATTCT
AnxVl-3 GGGCTCTCCTCCTGAAG
AnxVI-4 GTCAGGAGCCTGACTTCT
AnxVI-5 GCTAGAGGGGTGGGGTGG
AnxVI-6 TCGGAGCCCACGGCTGT
Reverse CTCGAGGACGCAGCGCTG
The following oligonucleotides were used in gel-shift analysis (all denoted 5 ’-3’):
S P l CTAGAGGGGTGGGGTG
GATCTCCCCACCCCAC
IS GAGGAGGGAGGCGGCG
CTCCTCCCTCCGCCGC
ETS 1 CGCCGGATTGGCCTCT
GCGGCCTAACCGGAGA
LHR CTCCCTCCCACTCACTC
RHR TCCAGCCACACTGGCCCCCCTGCTG AGGTCGGTGTGACCGGGGGGACGAC
LHR, 2R CCCTCCCACTCACTCCA GGGAGGGTGAGTGAGGT
LHR, 4R CTCCCACTCACTCCATT GAGGGTGAGTGAGGTAA
LHR, 6R CCCACTCACTCCATT GGGTGAGTGAGGTAA
LHR, 7R CCACTCACTCCATT GGTGAGTGAGGTAA
LHR, 8R CACTCACTCCATTCCAG GTGAGTGAGGTAAGGTC
LHR, 12R CACTCCATTCCAGCC GTGAGGTAAGGTCGG
LHR, IL CTCCCTCCCACTCACT GAGGGAGGGTGAGTGA
LHR, 4L TCCTCTCCCTCCCACTC AGGAGAGGGAGGGTGAG
MAZ-1 COMP GGGAGGGGAGGG
CCCTCCCCTCCC
The following primers were used for generation of IL-4 cDNA:
Forward: TTCTCCTGATAAACTAATTGCCTCA
Reverse: CCTGTAAGGTGATATCGCACTTGTGTCCGTGGACAAA
2.18 Details of nucleic acid databases
Nucleotide sequences were entered into the transcription-factor database Transfac Matinspector V 2 .1®, which was accessed from the following internet homepage: http://transfac.gbf.de/cgi-bin/matSearch/matsearch.pl. Matrix and core similarities were set at 0.9. General regions o f homology were determined using the BLAST® search program which was accessed from the following internet homepage:
http://www.ncbi.nlm .nih.gov/BLA ST/.
2.19 Im m unofluorescent localisation studies
antibody (fluorescein isothiocyanate-conjugated anti rabbit) was applied at a dilution of 1/500 in PBS. Cells were returned to the incubator for a further hour and then washed again in PBS, before mounting onto microscope slides. The mounting solution
contained 90 % g ly cero l, 10% PBS, and 0.1 % n-propylgallate as an antifading agent. Cells were viewed using a standard Zeiss epifluorescence system (FTl'C filter) coupled to a 400/600 CCD. Images were analysed using the computer program Lucida.
2.20 Determ ination of cell viability
Chapter 3
Analysis of annexin expression and response to steroid-hormones
3.1 Expression of annexin proteins in cultured mammalian cell lines
Since annexin I was discovered, the protein has been inextricably linked to the mechanism o f action of steroid hormones. The early work of Flower et al (1980), suggested that annexin I is synthesised in response to the steroid analogue
dexamethasone when the compound is applied to a perfused guinea-pig lung.
Subsequent work has yielded conflicting results. As discussed in the introduction (see section 1.8), steroid hormones and analogues have been shown to either increase, or have no effect on, the level of annexin I in cultured cells, as well as influencing both the location o f annexin I and its release from cells.
MW A431 HeLa Daudi Jurkat
-MW A431 HeLa Daudi Jurkat
68kD
35kD
F ig 3.1. E xpression of annexin I an d VI p ro tein in c u ltu re d h u m a n cell lines. 20jig of whole cell lysate from ep ith elial (A431), fib ro b la st (H eL a), B lym p h o blast (D audi) a n d T ly m p h o b la st (J u rk a t) cells was resolved by SD S-PA G E, e lec tro b lo tted onto PV D F m em b ran e and p ro b ed with polyclonal an tib o d ies fo r annexins I and VI.
This experim ent was repeated at least three times. The gel shows a representative result.
A nnexin I w as show n to be expressed in A 431, D audi and Jurkat cells, although not in
HeLa. A lthough other groups have reported that annexin I is expressed in H eL a cells
(V. G erke, personal com m unication), it is likely that clonal variation exists betw een
different subtypes o f this cell line, w hich has been cultured for a num ber o f decades.
A nnexin VI expression was seen in D audi, H eLa and Jurkat cells, although not in
A431. T he absence o f annexin VI in A431 cells is consistent with previous reports
(Sm ythe et al, 1994). In cell lines expressing either annexin I or annexin V I, it can be
seen that annexin expression levels varied betw een the cell lines.
3.2 T he effect of d ex am eth ason e on annexin I and VI ex p ressio n
Since levels o f annexin I have been proposed to vary in response to steroid horm ones
and steroid analogues, it was decided to investigate this phenom enon. T h e synthetic
steroid analogue dexam ethasone (9 a-F lu o ro -1 6 a-m eth y l-l Ip, 1 7 a ,2 1 -trih y d ro x y -1,4-
which has been shown to bind to and activate the glucocorticoid receptor, either enhancing or repressing transcription from steroid-sensitive genes.
(i) Western blotting
Cells were given fresh medium 24 hours prior to the experiment to minimise the
possible modulatory effects o f growth medium components in foetal calf serum. At time zero, dexamethasone in ethanol was added to the cells to a final concentration of IpM, which has previously been shown to be effective at inducing steroid-responsive genes (Suh et al, 1996). In order to achieve this concentration, the dexamethasone was diluted
lOOOx, such that the final concentration of ethanol never exceeded 0.1%, minimising effects on cell viability. However, since dexamethasone is known to induce apoptosis in some cell types, cell viability was monitored at each time point by exclusion of the vital dye Trypan Blue. Viability was always in excess of 90%.