Journal of
Marine Science
and Engineering
Review
Foundations in O
ff
shore Wind Farms: Evolution,
Characteristics and Range of Use. Analysis of Main
Dimensional Parameters in Monopile Foundations
Sergio Sánchez, José-Santos López-Gutiérrez , Vicente Negro and M. Dolores Esteban *
Research Group on Marine, Coastal and Port Environment and other Sensitive Areas, Universidad Politécnica de Madrid, E28040 Madrid, Spain; [email protected] (S.S.);
[email protected] (J.-S.L.-G.); [email protected] (V.N.) * Correspondence: [email protected]
Received: 21 October 2019; Accepted: 1 December 2019; Published: 2 December 2019
Abstract:Renewable energies are the future, and offshore wind is undoubtedly one of the renewable energy sources for the future. Foundations of offshore wind turbines are essential for its right development. There are several types: monopiles, gravity-based structures, jackets, tripods, floating support, etc., being the first ones that are most used up to now. This manuscript begins with a review of the offshore wind power installed around the world and the exposition of the different types of foundations in the industry. For that, a database has been created, and all the data are being processed to be exposed in clear graphic summarizing the current use of the different foundation types, considering mainly distance to the coast and water depth. Later, the paper includes an analysis of the evolution and parameters of the design of monopiles, including wind turbine and monopile characteristics. Some monomials are considered in this specific analysis and also the soil type. So, a general view of the current state of monopile foundations is achieved, based on a database with the offshore wind farms in operation.
Keywords: offshore wind farm; support structure; monopile; jacket; GBS; tripod; floating
1. Introduction
Wind energy can be considered nowadays a main participant in the energy market and power generation [1,2]. In 2016, it overtook coal as the second-largest form of generation capacity in Europe, only being overpassed by gas, and showing the highest development rate of every source considered [3]. Although the offshore wind energy sector is still far from the stage of maturity of its older brother (onshore wind) [4], the similarities between both have allowed offshore wind turbines [5] to become efficient and commercial-ready in a relatively short time [6]. During 2018, a total of 4496 MW were installed in six different countries [7]. China became the largest investor of this field (1800 MW), overtaking the United Kingdom for the first time (1312 MW), who had led the market during the past years. Germany (969 MW), Belgium (309 MW), Denmark (61 MW) and South Korea (35 MW) were the other participants.
Referring to the total installed capacity, the United Kingdom is still far ahead of any other country, covering 35.0% of the total power. Germany and China stay behind, accounting for 27.3% and 19.6%, respectively. Denmark, Sweden and the Netherlands, who started designing and testing these installations in the 90s, are still playing an important role as industry manufacturers and technology developers; however, the capacity installed in these countries has not gone up to that scale. Table1 gives some details of the picture at the end of 2018.
J. Mar. Sci. Eng.2019,7, 441 2 of 18
Table 1.Capacity installed by country at the end of 2018 (UK: United Kingdom; GER: Germany; CHI: China; DEN: Denmark; BEL: Belgium; NET: Netherlands; SWE: Sweden; VIE: Vietnam; JAP: Japan; KOR: Korea; FIN: Finland; USA: United States of America; IRE: Ireland; SPA: Spain; NOR: Norway; FRA: France) (Own elaboration based on [3,7]).
Country Wind Farms
Power Installed
(MW)
% Total Power Installed
Turbines Installed
Average Wind Farm Power
(MW)
Average Turbine Capacity (MW)
UK 37 8184 35.0% 1920 221.2 4.3
GER 23 6375 27.3% 1314 277.2 4.9
CHI 36 4581 19.6% 1224 127.3 3.7
DEN 14 1327 5.7% 514 94.8 2.6
BEL 8 1187 5.1% 274 148.4 4.3
NET 6 1118 4.8% 365 186.3 3.1
SWE 5 201 0.9% 86 40.2 2.3
VIE 2 99 0.4% 62 49.5 1.6
JAP 11 84 0.4% 35 7.6 2.4
KOR 3 71 0.3% 24 23.7 3.0
FIN 3 68 0.3% 24 22.7 2.8
USA 1 30 0.1% 5 30.0 6.0
IRE 1 25 0.1% 7 25.0 3.6
SPA 2 10 0.0% 2 5.0 5.0
NOR 1 2 0.0% 1 2.0 2.0
FRA 1 2 0.0% 1 2.0 2.0
According to [8–15], the main advantages of offshore wind farms over onshore ones can be briefly described as follows:
• The existing wind resource in the sea is higher than in nearby coasts.
• Due to its location offshore, the visual and acoustic impact is lower than wind farms on land,
which allows better use of the existing wind resource, with larger turbines and the use of more efficient blade geometries. Likewise, the lower surface roughness in the sea favors the use of lower tower heights.
• It provides a bigger creation of employment in the phases of construction, assembly and
maintenance, due to the greater complexity during installation and exploitation. • Possibility of integration in mixed marine complexes.
• Spaciousness of the environment.
• More constant and stable energy generated.
However, these marine facilities also have significant disadvantages with respect to terrestrial ones, which are limiting their development: non-existence of electrical infrastructures close to the location; more severe environmental conditions; evaluation of wind resource more complex and expensive; and above all, its higher investment ratios and operating expenses, needing specific technologies for construction and foundations, transport and assembly at sea, laying of electrical networks underwater and operation and maintenance tasks [16,17]. Furthermore, there is some research emphasizing the advantages of harnessing wind and waves at the same facility [18–20].
J. Mar. Sci. Eng.2019,7, 441 3 of 18
nowadays for commercial power generation. Currently, the industry is talking about exceeding 10 MW unit power [27,28].
J. Mar. Sci. Eng.2019, 7, 441 3 of 19
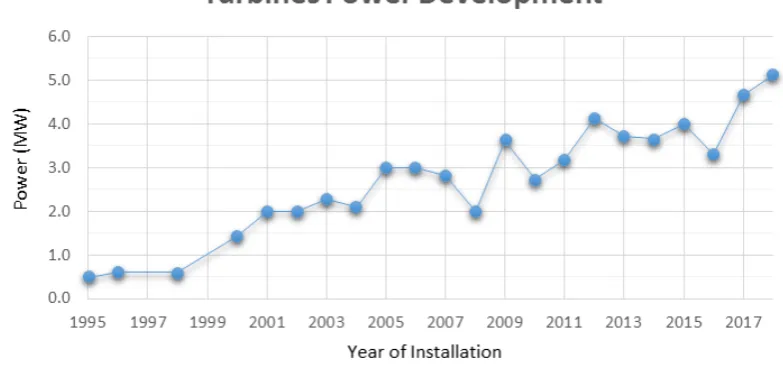
Vestas V164-8.4 MW turbines, the most powerful turbines nowadays for commercial power generation. Currently, the industry is talking about exceeding 10 MW unit power [27,28].
Figure 1. Average offshore wind turbine power installed every year.
2. Typologies of Foundations
Located in such a dynamic and extremely powerful element as the sea is, foundations become one of the main elements of these projects, receiving over one-third of the total cost [29–32]. As they must support the wind turbines, absorbing all the forces and loads and providing a safe and stable base, defining the right typology of foundation can have a huge impact both on the economic and technical sides, becoming especially vital these last years as wind farms are being located further from the coast, and every element must be designed and optimized in detail, to avoid performance problems and reduce maintenance works.
As was previously discussed in the article, offshore wind farms, even nowadays, are placed in a few selected locations. There are several conditions that limit the range of use of this type of installations [33–36]:
• The depth is vital when defining installation costs. Greater depths associates higher costs and the use of more complex and specialised technologies, something that is reflected in the final investment of the wind farm, reducing its profitability. Closed seas, located within continental platforms, have an average depth significantly lower than oceans and open seas, being more convenient for this type of project [37].
• Meteocean climate, in particular, wave height values [38–40]. Sea zones with high wave heights make installation and maintenance work more complicated, requiring more workload and economic resources, in addition to damaging the foundations and causing phenomena such as to scour the seabed [41–45], which weakens the structure and requires closer surveillance and maintenance work.
• The distance to coast [46]. In order to have a higher intensity wind and less impact on the landscape and the coast, in the location of this type of facilities, it is sought to distance them as far as possible from the coastline, since this also allows the use of turbines of greater nominal size and power. However, as it has been discussed before, this usually leads to an increase in depth, with the inconveniences that this entails. Therefore, the optimal location for a wind farm is the one that is placed as far from the coastline as possible while keeping a low depth.
• Spontaneous or unexpected phenomena such as earthquakes, tsunamis or extreme meteorological offshore events. Additional information from location, ground composition and soil-foundation interactions become much more relevant at regions where these events appear more frequently [47–49].
Figure 1.Average offshore wind turbine power installed every year.
2. Typologies of Foundations
Located in such a dynamic and extremely powerful element as the sea is, foundations become one of the main elements of these projects, receiving over one-third of the total cost [29–32]. As they must support the wind turbines, absorbing all the forces and loads and providing a safe and stable base, defining the right typology of foundation can have a huge impact both on the economic and technical sides, becoming especially vital these last years as wind farms are being located further from the coast, and every element must be designed and optimized in detail, to avoid performance problems and reduce maintenance works.
As was previously discussed in the article, offshore wind farms, even nowadays, are placed in a few selected locations. There are several conditions that limit the range of use of this type of installations [33–36]:
• The depth is vital when defining installation costs. Greater depths associates higher costs and
the use of more complex and specialised technologies, something that is reflected in the final investment of the wind farm, reducing its profitability. Closed seas, located within continental platforms, have an average depth significantly lower than oceans and open seas, being more convenient for this type of project [37].
• Meteocean climate, in particular, wave height values [38–40]. Sea zones with high wave heights
make installation and maintenance work more complicated, requiring more workload and economic resources, in addition to damaging the foundations and causing phenomena such as to scour the seabed [41–45], which weakens the structure and requires closer surveillance and maintenance work.
• The distance to coast [46]. In order to have a higher intensity wind and less impact on the
landscape and the coast, in the location of this type of facilities, it is sought to distance them as far as possible from the coastline, since this also allows the use of turbines of greater nominal size and power. However, as it has been discussed before, this usually leads to an increase in depth, with the inconveniences that this entails. Therefore, the optimal location for a wind farm is the one that is placed as far from the coastline as possible while keeping a low depth.
• Spontaneous or unexpected phenomena such as earthquakes, tsunamis or extreme meteorological
J. Mar. Sci. Eng.2019,7, 441 4 of 18
interactions become much more relevant at regions where these events appear more frequently [47–49].
Other factors to consider are the typology of the stratum of the seabed on which engineers support the foundations [50], possible impacts to shipping routes or other offshore installations, and sea climate. Furthermore, it is important taking into account that there are still some uncertainties for the design of the foundations of these facilities [51].
As wave height is a dynamic value that may vary in a significant way for every wind turbine inside each farm, depending on several different factors, the paper is focused on the other main conditioners: the depth of the seabed and the distance from the coast. The development of new technologies and manufacturing and construction procedures [52], together with the increase in the size of wind farms and turbines and the increase in society’s awareness of visual and environmental impacts [53,54], has led to the displacement of these installations further from the coastline, as it can be seen in Figure2 (the size of the bubbles represents the capacity installed).
J. Mar. Sci. Eng.2019, 7, 441 4 of 19
Other factors to consider are the typology of the stratum of the seabed on which engineers support the foundations [50], possible impacts to shipping routes or other offshore installations, and sea climate. Furthermore, it is important taking into account that there are still some uncertainties for the design of the foundations of these facilities [51].
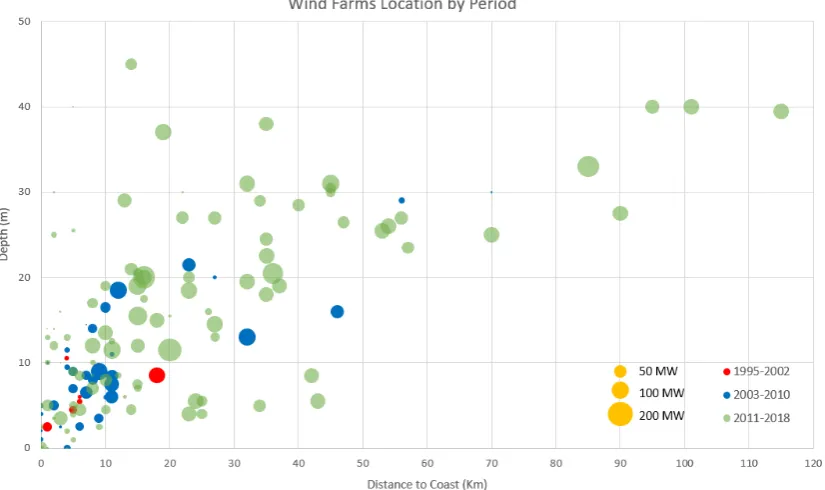
As wave height is a dynamic value that may vary in a significant way for every wind turbine inside each farm, depending on several different factors, the paper is focused on the other main conditioners: the depth of the seabed and the distance from the coast. The development of new technologies and manufacturing and construction procedures [52], together with the increase in the size of wind farms and turbines and the increase in society's awareness of visual and environmental impacts [53,54], has led to the displacement of these installations further from the coastline, as it can be seen in Figure 2 (the size of the bubbles represents the capacity installed).
Figure 2. Offshore wind farms in operation classified by depth and distance from the coast at the end of 2018 (the size of the bubbles represents the capacity installed).
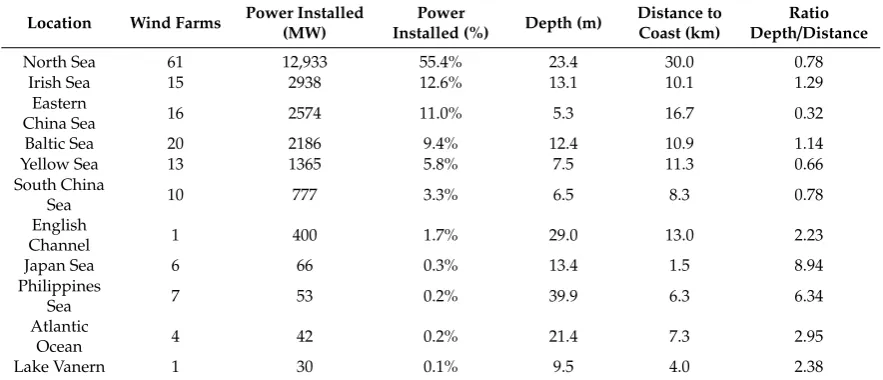
Table 2 shows the average depth and distance to coast in different locations and also the ratio depth/distance. In the case of lower depth and distance to coast, the more convenient and cost-efficient the construction project of the wind farm will be [55].
Table 2. Average depth and distance conditions of installed farms by location at the end of 2018.
Location Wind
farms
Power
installed
(MW)
Power
installed
(%)
Depth
(m)
Distance to
Coast (km)
Ratio
Depth /
Distance
North Sea 61 12,933 55.4% 23.4 30.0 0.78
Irish Sea 15 2938 12.6% 13.1 10.1 1.29
Eastern China Sea 16 2574 11.0% 5.3 16.7 0.32
Baltic Sea 20 2186 9.4% 12.4 10.9 1.14
Yellow Sea 13 1365 5.8% 7.5 11.3 0.66
South China Sea 10 777 3.3% 6.5 8.3 0.78
English Channel 1 400 1.7% 29.0 13.0 2.23
Figure 2.Offshore wind farms in operation classified by depth and distance from the coast at the end of 2018 (the size of the bubbles represents the capacity installed).
Table2shows the average depth and distance to coast in different locations and also the ratio depth/distance. In the case of lower depth and distance to coast, the more convenient and cost-efficient the construction project of the wind farm will be [55].
Regarding the wind farms operating these days, low-depth seas belonging to the continental platforms are the optimal location for these installations, where the ratio between the seabed depth and the distance is under or close to 1 m/km.
J. Mar. Sci. Eng.2019,7, 441 5 of 18
Table 2.Average depth and distance conditions of installed farms by location at the end of 2018.
Location Wind Farms Power Installed (MW)
Power
Installed (%) Depth (m)
Distance to Coast (km)
Ratio Depth/Distance
North Sea 61 12,933 55.4% 23.4 30.0 0.78
Irish Sea 15 2938 12.6% 13.1 10.1 1.29
Eastern
China Sea 16 2574 11.0% 5.3 16.7 0.32
Baltic Sea 20 2186 9.4% 12.4 10.9 1.14
Yellow Sea 13 1365 5.8% 7.5 11.3 0.66
South China
Sea 10 777 3.3% 6.5 8.3 0.78
English
Channel 1 400 1.7% 29.0 13.0 2.23
Japan Sea 6 66 0.3% 13.4 1.5 8.94
Philippines
Sea 7 53 0.2% 39.9 6.3 6.34
Atlantic
Ocean 4 42 0.2% 21.4 7.3 2.95
Lake Vanern 1 30 0.1% 9.5 4.0 2.38
Depending on the depth of the seabed, as well as the surrounding conditions and sea climate, different solutions have been used since the first offshore wind turbines were designed. Some of the most important typologies of foundations are defined as follows [55–59]:
• Gravity-based structure (GBS): concrete-based structure which can be constructed with or without
small steel or concrete skirts. The base width can be adjusted to suit the actual soil conditions. The proposed design includes a central steel or concrete shaft for transition to the wind turbine tower [60,61].
• Monopile: the monopile support structure is a simple design by which the tower is supported by
the monopile, either directly or through a transition piece, which is a transitional section between the tower and the monopile. The monopile continues down into the soil. The structure is made of cylindrical steel tubes [62,63].
• Tripod: three-leg structure made of cylindrical steel tubes. The central steel shaft of the tripod
makes the transition to the wind turbine tower. The tripod can have either vertical or inclined pile sleeves. Inclined pile sleeves are used when the structure is to be installed with a jack-up drilling rig. The base width and pile penetration depth can be adjusted to suit the actual environmental and soil conditions [64].
• Jacket: similar to the tripods described above, with the difference of having four piles instead
of three. These metal piles are linked together thanks to a lattice that provides strength and stability to the whole structure. They have dimensions similar to the tripods but given their greater adaptability to diverse conditions and stability, they are more widespread than these, until being the second most used typology only behind the monopiles [65,66].
• Floating: The floating support structure consists of a floating platform and a platform anchoring
system. The platform has a transition piece to install the tower on top of that. The platform can have several typologies: spar, semisubmersible and tension leg platform (TLP) [67,68].
Besides the previously mentioned types of foundations, there are others in development to be used in the offshore wind industry. One of the most known is the suction caisson being used in oil and gas with very good results [69–71]. This typology provides a stable and light base, whose strength comes directly, not from its weight or depth, but from the compaction of the supporting soil through the suction of the water. Suction caissons work very well in soft soils such as clays [72,73].
J. Mar. Sci. Eng.2019,7, 441 6 of 18
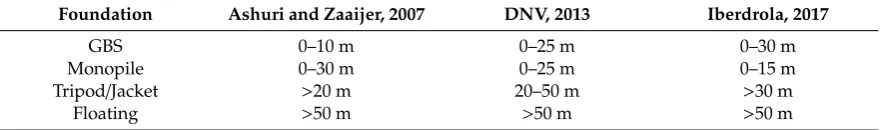
Table 3.Range of use of typology by seabed depth.
Foundation Ashuri and Zaaijer, 2007 DNV, 2013 Iberdrola, 2017
GBS 0–10 m 0–25 m 0–30 m
Monopile 0–30 m 0–25 m 0–15 m
Tripod/Jacket >20 m 20–50 m >30 m
Floating >50 m >50 m >50 m
However, the depth of the seabed is not the only condition to be considered. Other factors such as the availability of resources [76] and technology and experience in a certain type over the others make different markets bet on different solutions in similar environments.
Figures3and4show the comparison of the typologies in Europe and in Asia according to the parameters of depth and distance to the coast.
J. Mar. Sci. Eng.2019, 7, 441 6 of 19
Table 3. Range of use of typology by seabed depth.
Foundation Ashuri and Zaaijer, 2007 DNV, 2013 Iberdrola, 2017
GBS 0
–
10 m 0–
25 m 0–
30 mMonopile 0
–
30 m 0–
25 m 0–
15 mTripod/Jacket >20 m 20
–
50 m >30 mFloating >50 m >50 m >50 m
However, the depth of the seabed is not the only condition to be considered. Other factors such as the availability of resources [76] and technology and experience in a certain type over the others make different markets bet on different solutions in similar environments.
Figures 3 and 4 show the comparison of the typologies in Europe and in Asia according to the parameters of depth and distance to the coast.
Figure 3. Typologies of foundations in Europe at the end of 2018 according to the parameters of
depth and distance to the coast.
Figure 3.Typologies of foundations in Europe at the end of 2018 according to the parameters of depth and distance to the coast.
The maturity of the sector in Europe has allowed the installation of wind farms in remote areas not yet considered in Asia, both in distance and depth. The best example is the Global Tech I Park, in Germany (400 MW, 115 Km from the coast, 80 x 5 MW turbines, AREVA M5000 wind turbine, situated in the German Exclusive Economic Zone (EEZ), 180km away from the Bremerhaven Emden in the north-west, Germany). In Europe, monopile foundations after decades of experience and acquired knowledge, present a high percentage of use compared to the other typologies in Europe (77%). The specialisation in their design and manufacturing makes them, due to cost and range of aptitude, the most appropriate alternative in most wind farms located in shallow and intermediate depths.
J. Mar. Sci. Eng.2019,7, 441 7 of 18
J. Mar. Sci. Eng.2019, 7, 441 7 of 19
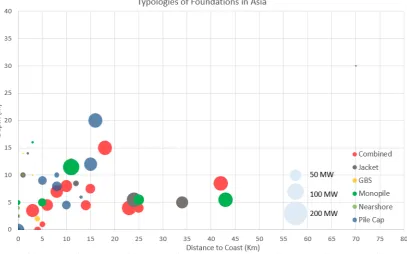
Figure 4. Typologies of foundations in Asia at the end of 2018 according to the parameters of depth
and distance to the coast.
The maturity of the sector in Europe has allowed the installation of wind farms in remote areas not yet considered in Asia, both in distance and depth. The best example is the Global Tech I Park, in Germany (400 MW, 115 Km from the coast, 80 x 5 MW turbines, AREVA M5000 wind turbine, situated in the German Exclusive Economic Zone (EEZ), 180km away from the Bremerhaven Emden in the north-west, Germany). In Europe, monopile foundations after decades of experience and acquired knowledge, present a high percentage of use compared to the other typologies in Europe (77%). The specialisation in their design and manufacturing makes them, due to cost and range of aptitude, the most appropriate alternative in most wind farms located in shallow and intermediate depths.
Meanwhile in Asia, the arrival of offshore wind energy in a continent without tradition in facilities of this type has led to the use of various solutions. On the other hand, the optimal conditions of some Asian seas with shallow depths at great distances, explains the use of simple and inexpensive typologies such as pile cap concrete foundations. Wind farms with several different typologies are also common, mainly pile cap foundations and monopile or jacket structures.
Although floating foundations have not been represented in the previous graphs, to facilitate the visualisation of the data, they will be analysed separately. As it can be extracted from previous text, all the conventional typologies present problems or a high degree of uncertainty when depths are greater than 50 meters. However, it is in these regions where the wind resource is the strongest and most stable, and the distance to the coastline minimises the impact on the environment and the landscape. Due to these reasons, many market participants started to investigate and develop new solutions that allow the installation and operation of wind farms at greater depths and distances, without compromising the safety of wind turbines or requiring huge installation and maintenance costs. Some of the advantages that floating platforms can offer compared to the other types are:
• Allowing the installation of wind farms in regions with great potential in the production of wind energy but which cannot be supported with current typologies.
Figure 4.Typologies of foundations in Asia at the end of 2018 according to the parameters of depth and distance to the coast.
Although floating foundations have not been represented in the previous graphs, to facilitate the visualisation of the data, they will be analysed separately. As it can be extracted from previous text, all the conventional typologies present problems or a high degree of uncertainty when depths are greater than 50 meters. However, it is in these regions where the wind resource is the strongest and most stable, and the distance to the coastline minimises the impact on the environment and the landscape. Due to these reasons, many market participants started to investigate and develop new solutions that allow the installation and operation of wind farms at greater depths and distances, without compromising the safety of wind turbines or requiring huge installation and maintenance costs. Some of the advantages that floating platforms can offer compared to the other types are:
• Allowing the installation of wind farms in regions with great potential in the production of wind
energy but which cannot be supported with current typologies.
• They offer a competitive alternative in medium depths (30–50 m), since they do not require a
preparation of the seabed nor is it necessary to carry out works in the large-scale environment. Therefore, the impact on the ecosystem is lower.
• They allow countries without a continental platform and great depths at a short distance from the
coast (America, Southern Europe, among others), to step forward in the market to which they barely had access to a few years ago.
J. Mar. Sci. Eng.2019,7, 441 8 of 18
Table 4. Floating projects in operation at the end of 2018 (JAP: Japan; NOR: Norway; UK: United Kingdom; FRA: France).
Wind Farm Country Power (MW) Turbines Depth (m) Distance (Km) Year
Fukushima Floating -2 JAP 12.0 2 122.5 20 2018
Fukushima Floating -1 JAP 2.0 1 122.5 20 2013
Sakiyama Wind Turbine JAP 2.0 1 40.0 5 2016
Hywind NOR 2.0 1 220.0 10 2009
Hywing Scotland UK 30.0 5 103.0 25 2018
Floatgen Project Demo FRA 2.0 1 30.0 22 2018
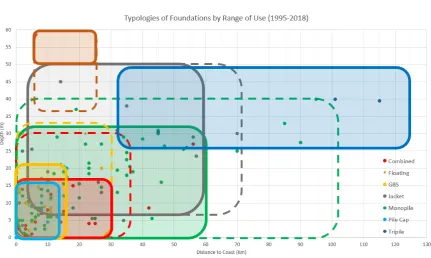
With a total of 154 offshore wind farms classified and analysed using all the data set created for this research, it has been limited to the range of use of each one of the considered typologies, establishing both the areas of frequent use and the singular projects that are outside these limits, and which is interesting to mention since they establish the limits of these foundations in the future (Table5, Figure5).
Table 5.Typologies of foundations by range of use (1995–2018).
Typology Depth (m) Distance (Km) Max. Depth (m) Max Distance (Km)
Pile Cap 0–15 0–15 15 15
Combined 0–15 0–30 30 35
GBS 0–20 0–15 30 30
Monopile 0–30 0–60 40 100
Jacket 5–50 5–60 50 70
Tripod 25–50 40–120 40 120
Floating >50 5–25 220 25
J. Mar. Sci. Eng.2019, 7, 441 9 of 19
Figure 5. Typologies of foundations by depth and distance to coast (1995–2018).
In Figure 5, the areas inside the solid lines represent the regions where each typology has been used various times, while the areas outside the solid lines but inside the dashed ones represent the regions where these typologies have been used for single projects. Those dashed-line areas can be of interest, as they set the possibilities of these different solutions in the short and medium-term.
As it can be seen from the Table 5 and Figure 5, there are three differentiated zones for which different solutions are used, depending mainly on the depth of the seabed but also on the distance to the coast and location of the wind farm:
• In shallow depths (0–20 m), the typologies used differ depending on the continent. In Europe, GBS and monopile foundations have been the most frequent option, with the former being used at distances less than 15–20 km from the coast, and the latter at greater distances. In Asia, on the other hand, the pile cap foundations and the combined wind farms (mainly pile cap and monopiles) have been chosen for practically all the foundations.
• At medium depths (20–40 m), the most commonly used foundations are monopile and jacket typologies. The main difference between the two is the use of the second ones in depths from 35–40 m. It is in these depths when the monopiles begin to experience buckling and instability phenomena, being necessary to resort to more stable structures with better behavior under severe marine conditions. Bac Lieu wind farm, the first one in Vietnam, stands as one of the examples of pile cap foundations [77].
• On the other hand, it is important to highlight the use of tripod foundations. Although there are currently only three wind farms with this typology, their excellent behavior in areas far from the coast makes them a competitive alternative at medium-high depths and large distances, these regions being potentially the most demanded for installation of wind farms in Europe during the coming years.
• At greater depths (>50 m) floating foundations are the only typology that has been used to date. It can, therefore, be assumed that above this depth these typologies are those that a priori can be considered as the only possible alternative, although in particular conditions other typologies (usually tripod or jacket) may be used as well.
3. Monopiles: Evolution and Parameters of Design
As has been explained previously, if there is a typology that stands out above the others, both in frequency and range of use, it is the monopile typology. Considered an alternative since the first
Figure 5.Typologies of foundations by depth and distance to coast (1995–2018).
J. Mar. Sci. Eng.2019,7, 441 9 of 18
As it can be seen from the Table5and Figure5, there are three differentiated zones for which different solutions are used, depending mainly on the depth of the seabed but also on the distance to the coast and location of the wind farm:
• In shallow depths (0–20 m), the typologies used differ depending on the continent. In Europe,
GBS and monopile foundations have been the most frequent option, with the former being used at distances less than 15–20 km from the coast, and the latter at greater distances. In Asia, on the other hand, the pile cap foundations and the combined wind farms (mainly pile cap and monopiles) have been chosen for practically all the foundations.
• At medium depths (20–40 m), the most commonly used foundations are monopile and jacket
typologies. The main difference between the two is the use of the second ones in depths from 35–40 m. It is in these depths when the monopiles begin to experience buckling and instability phenomena, being necessary to resort to more stable structures with better behavior under severe marine conditions. Bac Lieu wind farm, the first one in Vietnam, stands as one of the examples of pile cap foundations [77].
• On the other hand, it is important to highlight the use of tripod foundations. Although there are
currently only three wind farms with this typology, their excellent behavior in areas far from the coast makes them a competitive alternative at medium-high depths and large distances, these regions being potentially the most demanded for installation of wind farms in Europe during the coming years.
• At greater depths (>50 m) floating foundations are the only typology that has been used to date.
It can, therefore, be assumed that above this depth these typologies are those that a priori can be considered as the only possible alternative, although in particular conditions other typologies (usually tripod or jacket) may be used as well.
3. Monopiles: Evolution and Parameters of Design
As has been explained previously, if there is a typology that stands out above the others, both in frequency and range of use, it is the monopile typology. Considered an alternative since the first years of development of this sector, it has several characteristics that explain its popularity and widespread use:
• Simplicity: a simple and easily standardised design allows it to be manufactured in series without
the need for cutting-edge technology, shortening construction and installation times and, therefore, reducing costs without compromising the safety and operability of the installation.
• Adaptability: linked to the previous point. Its simple design makes it possible to adapt to different
dimensions and characteristics, without excessive complications to external conditions, avoiding the need for a large amount of field data, providing competitive solutions in shallow depths as well as in larger ones.
• Behavior: possibly the main strength of this typology. Able to stand favourably against external
forces without increasing installation and maintenance costs. Mainly in high distances and average depths (25–35 m) where typologies such as GBS and HRPC (High Rise Pile Cap) are not competitive, and the use of jacket and tripod foundations can greatly increase the cost of the project, monopiles are considered the best alternative, even nowadays.
Monopiles began to be used mainly in 2002 when offshore wind was considered for the first time a competitive alternative in some parts of Europe, and the first relevant projects came up (Horns Rev 1, 160 MW, Denmark, Vestas V80-2.0 MW, North Sea, Denmark). These large wind parks needed to move away from the coast to minimise environmental and social impact, in addition to seeking a more powerful and stable wind resource. GBS foundations could not compete at intermediate depths and jacket structures were not economically viable.
J. Mar. Sci. Eng.2019,7, 441 10 of 18
processes. Some companies, collecting the knowledge obtained from each project, soon became solid specialised brands who developed new solutions and techniques, spreading the use of monopiles out of their initial range. At the top of its popularity in 2014, monopile foundations were used in 76.7% of the total wind turbines operating in the world by that time (Figure6).
J. Mar. Sci. Eng.2019, 7, 441 10 of 19
years of development of this sector, it has several characteristics that explain its popularity and widespread use:
• Simplicity: a simple and easily standardised design allows it to be manufactured in series without the need for cutting-edge technology, shortening construction and installation times and, therefore, reducing costs without compromising the safety and operability of the installation.
• Adaptability: linked to the previous point. Its simple design makes it possible to adapt to different dimensions and characteristics, without excessive complications to external conditions, avoiding the need for a large amount of field data, providing competitive solutions in shallow depths as well as in larger ones.
• Behavior: possibly the main strength of this typology. Able to stand favourably against external forces without increasing installation and maintenance costs. Mainly in high distances and average depths (25–35 m) where typologies such as GBS and HRPC (High Rise Pile Cap) are not competitive, and the use of jacket and tripod foundations can greatly increase the cost of the project, monopiles are considered the best alternative, even nowadays.
Monopiles began to be used mainly in 2002 when offshore wind was considered for the first time a competitive alternative in some parts of Europe, and the first relevant projects came up (Horns Rev 1, 160 MW, Denmark, Vestas V80-2.0 MW, North Sea, Denmark). These large wind parks needed to move away from the coast to minimise environmental and social impact, in addition to seeking a more powerful and stable wind resource. GBS foundations could not compete at intermediate depths and jacket structures were not economically viable.
During the next years, this typology experienced a great development (marked in green in Figure 6), as more resources were invested to reduce manufacturing costs while improving the building processes. Some companies, collecting the knowledge obtained from each project, soon became solid specialised brands who developed new solutions and techniques, spreading the use of monopiles out of their initial range. At the top of its popularity in 2014, monopile foundations were used in 76.7% of the total wind turbines operating in the world by that time (Figure 6).
Figure 6. Accumulated share of monopile foundations (2003–2018).
The decreasing period takes place as of 2014 (highlighted in red), and presents a decreasing trend from the 77% existing in that year to the current 65%. To explain this fact, two facts must be considered.
Figure 6.Accumulated share of monopile foundations (2003–2018).
The decreasing period takes place as of 2014 (highlighted in red), and presents a decreasing trend from the 77% existing in that year to the current 65%. To explain this fact, two facts must be considered.
On the one hand, the tendency to move wind farms away from the coast towards greater depths favours the use of more solid and stable typologies (jacket, tripod), with a better performance in the face of more severe marine climates.
On the other hand, the development of the sector in the Asian countries with different environmental conditions and technical solutions, has favoured the decrease of this quota. However, as it has been already seen, turbines have barely been installed at intermediate depths in Asia and when they begin to do so, monopiles will be considered again.
In order to adapt to the needs of each wind farm, monopiles have evolved over the years. Its main dimensions, diameter and length have increased to be able to support increasingly high and heavy turbines and greater depths. If it is analysed, these changes during the last 10 years in which 90% of all existing monopiles have been installed, the results are exposed in Table6.
Table 6.Monopiles characteristics (2009–2018).
Year
Power Installed
(MW)
Turbines Installed
Average Turbine Power,
Pn (MW)
Average Diameter,
ø (m)
Average Length, L
(m)
Average Depth, d
(m)
Average Distance to Coast, DC (Km)
2009 457 127 3.6 4.85 37.8 7.6 5.7
2010 862 311 2.8 4.26 40.4 11.7 20.2
2011 232 72 3.2 5.00 43.0 19.3 15.0
2012 184 51 3.6 6.00 55.0 27.0 22.0
2013 2149 599 3.6 5.13 47.8 13.1 15.7
2014 1063 317 3.4 5.48 58.8 19.2 24.4
2015 2072 564 3.7 5.47 55.4 17.9 27.8
2016 698 191 3.7 5.68 62.2 9.5 16.5
2017 3144 609 5.2 6.83 69.0 23.6 46.1
J. Mar. Sci. Eng.2019,7, 441 11 of 18
As can be seen, both the length and the diameter of the piles have evolved proportionally to the power of the turbines, maintaining constant ratios. However, in order to analyse the relationship of these dimensions with the average depth and distance to the coast, it is seen that the ratio is not constant and there are relevant deviations.
In order to study these correlations more carefully, some monomials from the previous table are shown in Table7.
Table 7.Monopiles monomials (2009–2018).
Year ø/L (m/m)
ø/Pn (m/KW)
L/Pn (m/KW)
ø/d (m/m)
L/d (m/m)
ø/DC (m/Km)
L/DC (m/Km)
d/DC (m/Km)
2009 0.13 1.35 10.5 0.64 5.0 0.85 6.6 1.33
2010 0.11 1.54 14.6 0.36 3.5 0.21 2.0 0.58
2011 0.12 1.55 13.3 0.26 2.2 0.33 2.9 1.29
2012 0.11 1.66 15.2 0.22 2.0 0.27 2.5 1.23
2013 0.11 1.43 13.3 0.39 3.6 0.33 3.0 0.83
2014 0.09 1.63 17.5 0.29 3.1 0.22 2.4 0.79
2015 0.10 1.49 15.1 0.31 3.1 0.20 2.0 0.64
2016 0.09 1.55 17.0 0.60 6.5 0.34 3.8 0.58
2017 0.10 1.32 13.4 0.29 2.9 0.15 1.5 0.51
2018 0.11 1.23 11.7 0.32 3.1 0.26 2.5 0.82
Average 0.11 1.48 14.2 0.37 3.5 0.32 2.92 0.86
The monomial with the lowest variation is the ratio Diameter/Length of the monopile, staying close to 0.10–0.11 during the last years. This parameter can be helpful at the time of designing the right length of the pile based on the diameter of the wind turbine.
Although the other coefficients show a higher variability, in order to obtain a valid correlation for wind farms with the current characteristics and conditions, those obtained from the data corresponding to the last years will be more useful for this study. With these parameters, engineers can make estimations of the dimensions of the foundations, considering both the conditions of the environment and the power of the chosen turbines.
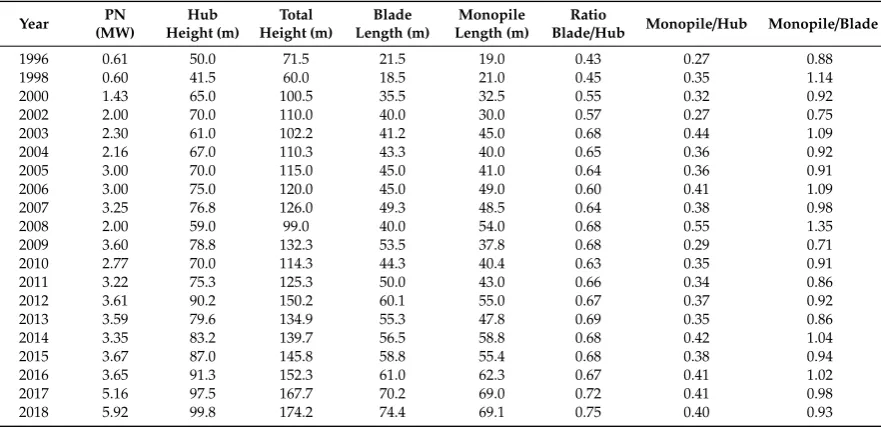
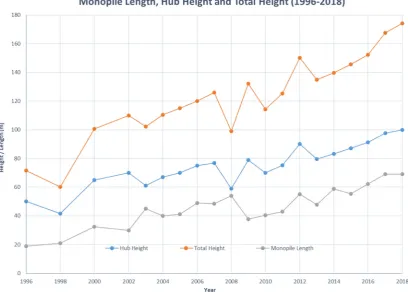
Other parameters that may be of interest are the hub height and blade length of the turbines, which directly affect the electrical production capacity. In Table8and Figure7, it can be seen how they have evolved their average values over the years, and their relationship with the length of the monopile foundations.
Table 8.Hub and blade heights of monopile wind farms by year (1996–2018).
Year PN
(MW)
Hub Height (m)
Total Height (m)
Blade Length (m)
Monopile Length (m)
Ratio
Blade/Hub Monopile/Hub Monopile/Blade
1996 0.61 50.0 71.5 21.5 19.0 0.43 0.27 0.88
1998 0.60 41.5 60.0 18.5 21.0 0.45 0.35 1.14
2000 1.43 65.0 100.5 35.5 32.5 0.55 0.32 0.92
2002 2.00 70.0 110.0 40.0 30.0 0.57 0.27 0.75
2003 2.30 61.0 102.2 41.2 45.0 0.68 0.44 1.09
2004 2.16 67.0 110.3 43.3 40.0 0.65 0.36 0.92
2005 3.00 70.0 115.0 45.0 41.0 0.64 0.36 0.91
2006 3.00 75.0 120.0 45.0 49.0 0.60 0.41 1.09
2007 3.25 76.8 126.0 49.3 48.5 0.64 0.38 0.98
2008 2.00 59.0 99.0 40.0 54.0 0.68 0.55 1.35
2009 3.60 78.8 132.3 53.5 37.8 0.68 0.29 0.71
2010 2.77 70.0 114.3 44.3 40.4 0.63 0.35 0.91
2011 3.22 75.3 125.3 50.0 43.0 0.66 0.34 0.86
2012 3.61 90.2 150.2 60.1 55.0 0.67 0.37 0.92
2013 3.59 79.6 134.9 55.3 47.8 0.69 0.35 0.86
2014 3.35 83.2 139.7 56.5 58.8 0.68 0.42 1.04
2015 3.67 87.0 145.8 58.8 55.4 0.68 0.38 0.94
2016 3.65 91.3 152.3 61.0 62.3 0.67 0.41 1.02
2017 5.16 97.5 167.7 70.2 69.0 0.72 0.41 0.98
J. Mar. Sci. Eng.J. Mar. Sci. Eng.2019,2019, 77, 441, 441 13 of 19 12 of 18
Figure 7. Evolution of Hub Height, Blade Length and Monopile Length (1996–2018).
Some interesting monomials can be extracted, like the ratios of Monopile Length/Blade Height, and Monopile Length/Hub Height, which have remained constant through the years (0.3–0.4 for the first one, and 0.9–1.0 for the second one). However, the monomial that shows a higher variation is the ratio Blade Length/Hub Height, from 0.43 in 1996 to 0.75 in 2018. Bigger blades lead to more efficient turbines and higher productions, and the location of offshore wind farms far from any affect on humans, and the lower surface roughness of the sea allows this ratio to keep growing.
Finally, some data on the predominant soil composition in each of these wind farms have also been included. In the same way as in previous sections, several monomials have been obtained. Table 9 includes some important figures related to the soil type, including the percentage considering the power installed and some of the monomials previously used.
Table 9. Soil composition on monopile wind farms.
Soil type
Power (MW)
% Type of soil
(total power)
Pn (MW)
Wind Farms
Average Depth
(m)
ø (m)
Lenght (m)
Ratio ø/L
Ratio Length / Depth
Sand/Clay 1582 10.3% 3.5 8 11.8 5.0 52.0 0.10 4.40
Sand/Bedrock 135 0.9% 2.0 4 9.3 3.6 32.1 0.11 3.47
Sand 9199 60.1% 4.2 39 17.9 5.6 57.8 0.10 3.23
Clay 2191 14.3% 4.1 10 14.8 5.4 48.5 0.11 3.28
Sand/Gravel 775 5.1% 3.5 3 12.0 5.1 40.7 0.13 3.39
Sand/Chalk 97 0.6% 3.6 1 9.0 34.0 3.78
Clay/Gravel 165 1.1% 3.0 1 16.0 4.5 55.0 0.08 3.44
Clay/Bedrock 576 3.8% 3.6 1 20.0 5.0 55.0 0.09 2.75
Chalk 595 3.9% 6.3 2 20.8 7.3 70.5 0.10 3.40
Figure 7.Evolution of Hub Height, Blade Length and Monopile Length (1996–2018).
Some interesting monomials can be extracted, like the ratios of Monopile Length/Blade Height, and Monopile Length/Hub Height, which have remained constant through the years (0.3–0.4 for the first one, and 0.9–1.0 for the second one). However, the monomial that shows a higher variation is the ratio Blade Length/Hub Height, from 0.43 in 1996 to 0.75 in 2018. Bigger blades lead to more efficient turbines and higher productions, and the location of offshore wind farms far from any affect on humans, and the lower surface roughness of the sea allows this ratio to keep growing.
Finally, some data on the predominant soil composition in each of these wind farms have also been included. In the same way as in previous sections, several monomials have been obtained. Table9 includes some important figures related to the soil type, including the percentage considering the power installed and some of the monomials previously used.
Table 9.Soil composition on monopile wind farms.
Soil Type Power
(MW)
% Type of Soil (Total Power)
Pn (MW)
Wind Farms
Average Depth
(m)
ø (m) Lenght
(m)
Ratio ø/L
Ratio Length/Depth
Sand/Clay 1582 10.3% 3.5 8 11.8 5.0 52.0 0.10 4.40
Sand/Bedrock 135 0.9% 2.0 4 9.3 3.6 32.1 0.11 3.47
Sand 9199 60.1% 4.2 39 17.9 5.6 57.8 0.10 3.23
Clay 2191 14.3% 4.1 10 14.8 5.4 48.5 0.11 3.28
Sand/Gravel 775 5.1% 3.5 3 12.0 5.1 40.7 0.13 3.39
Sand/Chalk 97 0.6% 3.6 1 9.0 - 34.0 3.78
Clay/Gravel 165 1.1% 3.0 1 16.0 4.5 55.0 0.08 3.44
Clay/Bedrock 576 3.8% 3.6 1 20.0 5.0 55.0 0.09 2.75
J. Mar. Sci. Eng.2019,7, 441 13 of 18
Placing our data on a graphic similar to Figure5, it is shown in Figure8how monopile wind farms are located depending on average depth and distance to the coast for every different soil composition.
J. Mar. Sci. Eng.2019, 7, 441 14 of 19
Placing our data on a graphic similar to Figure 5, it is shown in Figure 8 how monopile wind farms are located depending on average depth and distance to the coast for every different soil composition.
Figure 8. Soil composition of monopile windfarms by depth and distance to the coast.
4. Discussion of Results
The offshore wind sector awaits great potential both in the short and long term. The development of technology, the increase of competitiveness, reduction in costs and the interest by companies and institutions have motivated the development of a growing number of new projects year after year. In those areas where these wind facilities were already consolidated, that is, the regions surrounding the North Sea in Europe (Germany, the United Kingdom, the Netherlands, Denmark and Belgium), and China in Asia, this development has favoured the arrival of the first "megaprojects", installations of high power capacity carried out with the objective of not only supplying a significant quota of energy demand but with the ambitious objective of leading the production of electricity of their respective countries in not too long a space of time.
Regarding the countries that had not taken part in this sector yet, the consolidation of these projects together with the increase in the profitability of these facilities and the good results demonstrated, has led to the entry of new participants. A large number of European countries with access to the coast have already begun to analyze the viability and consent to the drafting of projects of this type, or in other cases, to carry out experimentation and analysis facilities that may favour the development of new wind farms in the future. Similarly, both the United States and various Asian countries have started to develop projects of this type over the past few years, some of which are already operating.
It must be highlighted the extensive use of monopiles, used in mostly all types of depths and environments. About this typology, it will be spoken of in more detail in the next lines. In addition, it
Figure 8.Soil composition of monopile windfarms by depth and distance to the coast.
4. Discussion of Results
The offshore wind sector awaits great potential both in the short and long term. The development of technology, the increase of competitiveness, reduction in costs and the interest by companies and institutions have motivated the development of a growing number of new projects year after year. In those areas where these wind facilities were already consolidated, that is, the regions surrounding the North Sea in Europe (Germany, the United Kingdom, the Netherlands, Denmark and Belgium), and China in Asia, this development has favoured the arrival of the first “megaprojects”, installations of high power capacity carried out with the objective of not only supplying a significant quota of energy demand but with the ambitious objective of leading the production of electricity of their respective countries in not too long a space of time.
J. Mar. Sci. Eng.2019,7, 441 14 of 18
still used in Asia in wind farms that are close to the coast. GBS foundations have been included in recent projects where the depth and sea conditions are a priori not convenient for them. At medium depths, it can be found the most used typologies today, the monopiles, and the jacket and tripod structures. Monopile foundations are currently used in more than 60% of wind turbines operating worldwide.
With regards to the analysis of the technical characteristics, the appearance of a constant value throughout all the foundations carried out from the beginning of these projects to the present, is the Diameter/Length ratio, which has remained unchanged for 20 years, always close to 0.10–0.11 and that seems to be the limit from which the phenomena of instability, vibration and deflection may appear.
Regarding the blade and hub heights, once more of this typology has evolved to be able to support bigger structures and turbines and maintain a constant ratio with both blade length and hub heights. If we look at the soil composition, we observe than this typology can adapt to different environments while keeping similar parameters and dimensions, proving it as a convenient and cost-effective solution even on heterogeneous locations.
For the jacket structures, their adaptability and excellent behavior in adverse conditions make them the best option in medium-high depths (20–40 m), especially in those areas where the monopiles can be instable and show deflection and bulking. On the contrary, its design and manufacturing complexity, unique for each wind turbine, and the cost associated with it has prevented its usual use until just a few years ago (2014–2015). However, since then its use quota has been increasing year after year, and as the technology on this typology becomes generalised and its own costs decrease, so will its expansion. As for the tripod foundations, although theoretically their features and benefits are at an intermediate point between monopiles and jacket structures, analysing the operational wind farms at present, it can be seen that their use is concentrated in the same area and in very similar conditions: high depths (30–40 m) and great distances to the coast (50–100 km).
5. Conclusions
The main conclusions of this research are:
• Offshore wind energy is experiencing constant growth in recent years, consolidating itself as one
of the fields with more potential. For this form of energy generation to be competitive, several years of research and development have been necessary.
• Monopiles are the most used foundations in shallow (0–15 m) and intermediate depths (15–30 m).
The simplicity of designing and manufacturing, together with a vast knowledge inherited from experience, especially in Europe, has led this typology to be the first option in more than 60% of the world’s offshore wind foundations nowadays.
• Jacket and tripod structures remain as strong competitors to monopiles when the seabed depth is
higher than 30 m. Floating solutions, which are beginning to be used for real energy production, are supposed to take the market by storm in the near future, bringing this sector to places that remain unavailable nowadays.
• Monopiles evolution has been studied according the following monomials: diameter/length,
diameter/turbine power, length/turbine power, diameter/water depth, length/diameter, dimeter/distance to the coast, length/distance to the coast, and water depth/ distance to the coast, with the following average values: 0.11; 1.48; 14.2; 0.37; 3.5; 0.32; 2.92; 0.86.
• The Diameter/Length monomial has the lowest variation, staying close to 0.10–0.11 during the last
years, so it can be used for a first and fast figure of the length of the pile.
• The other coefficient with a higher variability can be used for the first estimate in case of using the
monomials value obtained in last years, the most current ones.
Author Contributions:Conceptualization, J.-S.L.-G.; methodology, V.N.; investigation, S.S.; writing—original draft preparation, S.S.; writing—review and editing, J.-S.L.-G., V.N. and M.D.E.; supervision, M.D.E.
J. Mar. Sci. Eng.2019,7, 441 15 of 18
Acknowledgments:Authors give thanks to the Agustín de Betancourt Foundation (FAB) for the support received over the past few years.
Conflicts of Interest: The authors declare no conflict of interest. The funders had no role in the design of the study; in the collection, analyses, or interpretation of data; in the writing of the manuscript, or in the decision to publish the results.
References
1. Luengo, J.; Negro, V.; García-Barba, J.; Martín-Antón, M.; López-Gutiérrez, J.S.; Esteban, M.D.; Moreno, L.J. Preliminary Design for Wave Run-Up in Offshore Wind Farms: Comparison between Theoretical Models and Physical Model Tests.Energies2019,12, 1–17.
2. Mahdy, M.; Bajah, A. Multi criteria decision analysis for offshore wind energy potential in Egypt.Renew. Energy2018,118, 278–289. [CrossRef]
3. WindEurope.Offshore Wind in Europe. Key Trends Statistics 2017; Technical Report; WindEurope: Brussels, Belgium, 2018.
4. Esteban, M.D.; López-Gutiérrez, J.S.; Diez, J.J.; Negro, V. Methodology for the design of offshore wind farms. J. Coast. Res.2011,SI64, 496–500.
5. Hevia-Koch, P.; Jacobsen, H.K. Comparing offshore and onshore wind development considering acceptance costs.Energy Policy2019,125, 9–19. [CrossRef]
6. Esteban, M.D.; Espada, J.M.; Ortega, J.M.; López-Gutiérrez, J.S.; Negro, V. What about marine renewable energies in Spain?J. Mar. Sci. Eng.2019,7, 249. [CrossRef]
7. Global wind Energy Council.GWEC Global Wind Report 2018; Technical Report; Global wind Energy Council: Brussels, Belgium, 2019.
8. Spanish Institute for Diversification and Energy Saving (IDEA).Offshore Wind Energy; Technical Report; IDEA: Gandhinagar, India, 2015.
9. Li, J.; Yu, X.B. Onshore and offshore wind energy potential assessment near Lake Erie shoreline: A spatial and temporal analysis.Energy2018,147, 1092–1107. [CrossRef]
10. Enevoldsen, P.; Valentine, S.V. Do onshore and offshore wind farm development patterns differ? Energy Sustain. Dev.2016,35, 41–51. [CrossRef]
11. Kaldellis, J.K.; Apostolou, D.; Kapsali, M.; Kondili, E. Environmental and social footprint of offshore wind energy. Comparison with onshore counterpart.Renew. Energy2016,92, 543–556. [CrossRef]
12. Wüstemeyer, C.; Madlener, R.; Bunn, D.W. A stakeholder analysis of divergent supply-chain trends for the European onshore and offshore wind installations.Energy Policy2015,80, 36–44. [CrossRef]
13. Kumar, Y.; Ringernberg, J.; Depuru, S.S.; Devabhaktuni, V.K.; Lee, J.W.; Nikolaidis, E.; Andersen, B.; Afjeh, A. Wind energy: Trends and enabling technologies.Renew. Sustain. Energy Rev.2016,53, 209–224. [CrossRef] 14. Yang, J.; Chang, Y.; Zhang, L.; Hao, Y.; Yan, Q.; Wang, C. The life-cycle energy and environmental emissions
of a typical offshore wind farm in China.J. Clean. Prod.2018,180, 316–324. [CrossRef]
15. Gil-García, I.C.; García-Cascales, M.S.; Fernández-Guillamón, A.; Molina-García, A. Categorization and analysis of relevant factors for optimal locations in onshore and offshore wind power plants: A taxonomic review.J. Mar. Sci. Eng.2019,7, 391. [CrossRef]
16. Esteban, M.D.; Diez, J.J.; López-Gutiérrez, J.S.; Negro, V. Integral management applied to offshore wind farms.J. Coast. Res.2009,SI56, 1204–1208.
17. Esteban, M.D.; López-Gutiérrez, J.S.; Diez, J.J.; Negro, V. Offshore wind farms: Foundations and influence on the littoral processes.J. Coast. Res.2011,SI64, 656–660.
18. Pérez-Collazo, C.; Greaves, D.; Iglesias, G. A review of combined wave and offshore wind energy.Renew. Sustain. Energy Rev.2015,42, 141–153. [CrossRef]
19. Veigas, M.; Iglesias, G. A Hybrid Wave-Wind Offshore Farm for an Island. Int. J. Green Energy2015,12, 570–576. [CrossRef]
20. Astariz, S.; Vazquez, A.; Sánchez, M.; Carballo, R.; Iglesias, G. Co-located wave-wind farms for improved O&M efficiency.Ocean Coast. Manag.2018,163, 66–71.
J. Mar. Sci. Eng.2019,7, 441 16 of 18
22. Schwanitz, V.J.; Wierling, A. Offshore wind investments—Realism about cost developments is necessary. Energy2016,106, 170–181. [CrossRef]
23. Dismukes, D.E.; Upton, G.B. Economies of scale, learning effects and offshore wind development costs. Renew. Energy2015,83, 61–66. [CrossRef]
24. Fathabadi, H. Novel high efficient speed sensorless controller for maximum power extraction from wind energy conversion systems.Energy Convers. Manag.2016,123, 392–401. [CrossRef]
25. Novaes, E.J.; Araújo, A.M.; da Silva, N.S.B. A review on wind turbine control and its associated methods. J. Clean. Prod.2018,174, 945–953. [CrossRef]
26. MHI Vestas.MHI Vestas Achieves Final Turbine Installation at Horns Reef 3; Technical Report; Vestas: Aarhus N, Aarhus, Denmark, 2019.
27. Velarde, J.; Bachynski, E. Design and fatigue analysis of monopile foundations to support the DTU 10 MW offshore wind turbine.Energy Procedia2017,137, 3–13. [CrossRef]
28. Bottasso, C.L.; Croce, A.; Gualdoni, F.; Montinari, P. Load mitigation for wind turbines by a passive aeroelastic device.J. Wind Eng. Ind. Aerodyn.2016,148, 57–69. [CrossRef]
29. Escobar, A.; Negro, V.; López-Gutiérrez, J.S.; Esteban, M.D. Software for predicting hydrodynamic pressures on offshore pile foundations: The next step in ocean energy development.J. Coast. Res. 2016,SI75, 841–845. [CrossRef]
30. Oh, K.Y.; Nam, W.; Ryu, M.S.; Kim, J.K.; Epureanu, B.I. A review of foundations of offshore wind energy convertors: Current status and future perspectives.Renew. Sustain. Energy Rev.2018,88, 16–36. [CrossRef] 31. Matutano, C.; Negro, V.; López-Gutiérrez, J.S.; Esteban, M.D. Hydrodynamic regimes in offshore wind farms.
J. Coast. Res.2016,75, 892–897. [CrossRef]
32. Wang, X.; Zeng, X.; Yang, X.; Li, J. Feasibility study of offshore wind turbines with hybrid monopile foundation based on centrifuge modeling.Appl. Energy2018,209, 127–139. [CrossRef]
33. Bosch, J.; Staffell, I.; Hawkes, A.D. Global levelised cost of electricity from offshore wind.Energy2019, 116357. [CrossRef]
34. Ma, H.; Yang, J.; Chen, L. Effect of scour on the structural response of an offshore wind turbine supported on tripod foundation.Appl. Ocean Res.2018,73, 179–189. [CrossRef]
35. Kin, H.G.; Kim, B.J. Feasibility study of new hybrid piled concrete foundation for offshore wind turbine. Appl. Ocean Res.2018,76, 11–21.
36. Esteban, M.D.; López-Gutiérrez, J.S.; Negro, V. Gravity-Based Foundations in the Offshore Wind Sector. J. Mar. Sci. Eng.2019,7, 64. [CrossRef]
37. Esteban, M.D.; López-Gutiérrez, J.S.; Negro, V.; Matutano, C.; García-Flores, F.M.; Millán, M.A. Offshore wind foundation design: Some key issues.J. Energy Resour. Technol.2014,137, 1–6.
38. Guzmán, R.F.; Müller, K.; Vita, L.; Cheng, P.W. Simulation requirements and relevant load conditions in the design of floating offshore wind turbines. In Proceedings of the ASME 2018, 37th International conference on Ocean, Offshore Arctic Engineering, Madrid, Spain, 17–22 June 2018.
39. Bredmose, H.; Jacobsen, N.G. Breaking wave impacts on offshore wind turbine foundations: Focused wave groups and CFD. In Proceedings of the ASME 2010, 29th International conference on Ocean, Offshore Arctic Engineering, Shanghai, China, 6–11 June 2010.
40. Passon, P.; Branner, K. Load calculation methods for offshore wind turbine foundations. J. Ships Offshore Struct.2014,9, 433–449. [CrossRef]
41. Matutano, C.; Negro, V.; López-Gutiérrez, J.S.; Esteban, M.D.; Hernández, A. The effect of scour protections in offshore wind farms.J. Coast. Res.2014,SI70, 12–17. [CrossRef]
42. Hyldal Sørensen, S.P.; Ibsen, L.B. Assessment of foundation design for offshore monopiles unprotected against scour.Ocean Eng.2013,63, 17–25. [CrossRef]
43. Predengast, L.J.; Reale, C.; Gavin, K. Probabilistic examination of the change in eigenfrequencies of an offshore wind turbine under progressive scour incorporating soil spatial variability.Mar. Struct.2018,57, 87–104. [CrossRef]
44. Matutano, C.; Negro, V.; López-Gutiérrez, J.S.; Esteban, M.D.; del Campo, J.M. Dimensionless wave height parameter for preliminary design of scour protections in offshore wind farms. J. Coast. Res. 2013, 65, 1633–1639. [CrossRef]
J. Mar. Sci. Eng.2019,7, 441 17 of 18
46. Jacobsen, H.K.; Hevia-Koch, P.; Wolter, C. Nearshore and offshore wind development: Costs and competitive advantage exemplified by nearshore wind in Denmark.Energy Sustain. Dev.2019,50, 91–100. [CrossRef] 47. Kim, D.H.; Lee, S.G.; Lee, I.K. Seismic Fragility of 5 a MW offshore wind turbine.Renew. Energy2014,65,
250–256. [CrossRef]
48. Andersen, L.V.; Andersen, T.L.; Manuel, L. Model Uncertainties for Soil-Structure Interaction in Offshore Wind Turbine Monopile Foundations.J. Mar. Sci. Eng.2018,6, 87. [CrossRef]
49. Mo, R.; Kang, H.; Li, M.; Zhao, X. Seismic Fragility Analysis of Monopile Offshore Wind Turbines uncer Different Operational Conditions.Energies2017,10, 1037. [CrossRef]
50. Carswell, W.; Arwade, S.R.; DeGroot, D.J.; Lackner, M.A. Soil–structure reliability of offshore wind turbine monopile foundations.Wind Energy2014,18, 483–498. [CrossRef]
51. Luengo, J.; Negro, V.; García-Barba, J.; López-Gutiérrez, J.S.; Esteban, M.D. New detected uncertainties in the design of foundations for offshore wind turbines.Renew. Energy2019,131, 667–677. [CrossRef]
52. MacKinnon, D.; Dawley, S.; Steen, M.; Menzel, M.P.; Karlsen, A.; Sommer, P.; Hansen, G.H.; Normann, H.E. Path creation, global production networks and regional development: A comparative international analysis of the offshore wind sector.Prog. Plan.2019,130, 1–32. [CrossRef]
53. Takacs, B.; Goulden, M.C. Accuracy of wind farm visualisations: The effect of focal length on perceived accuracy.Environ. Impact Assess. Rev.2019,76, 1–9. [CrossRef]
54. Bishop, I.D. The implications for visual simulation and analysis of temporal variation in the visibility of wind turbines.Landsc. Urban Plan.2019,184, 59–68. [CrossRef]
55. Rodriguez, S.; Restrepo, C.; Kontos, E.; Teixeira Pinto, R.; Bauer, P. Trends of offshore Wind projects.Renew. Sustain. Energy Rev.2015,49, 1114–1135. [CrossRef]
56. Wu, X.; Hu, Y.; Li, Y.; Yang, J.; Duan, L.; Wang, T.; Adcock, T.; Juang, Z.; Gao, Z.; Lin, Z.; et al. Foundations of offshore wind turbines: A review.Renew. Sustain. Energy Rev.2019,104, 379–393. [CrossRef]
57. Det Norske Veritas (DNV).Offshore Standard, DNV-OS-J101, Design of Offshore Wind Turbine Structures; Technical Report; DNV GL: Oslo, Norway, 2014.
58. Det Norske Veritas—Germanischer Lloyd (DNV-GL).Offshore Standard, DNVGL-ST-0126, Support Structures for Wind Turbines; Technical Report; DNV GL: Oslo, Norway, 2018.
59. Det Norske Veritas—Germanischer Lloyd (DNV-GL).Offshore Standard, DNVGL-ST-0119, Floating Wind Turbine Structures; Technical Report; DNV GL: Oslo, Norway, 2018.
60. Esteban, M.D.; Couñago, B.; López-Gutiérrez, J.S.; Negro, V.; Vellisco, F. Gravity based support structures for offshore wind turbine generators: Review of the installation process. Ocean Eng. 2015,110, 281–291. [CrossRef]
61. Li, Y.; Ong, M.C.; Tang, T. Numerical analysis of wave-induced poro-elastic seabed response around a hexagonal gravity-based offshore foundation.Coast. Eng. 2018,136, 81–95. [CrossRef]
62. Negro, V.; López-Gutiérrez, J.S.; Esteban, M.D.; Alberdi, P.; Imaz, M.; Serraclara, J.M. Monopiles in offshore wind: Preliminary estimate of main dimensions.Ocean Eng.2017,133, 253–261. [CrossRef]
63. Wang, P.; Zhao, M.; Du, X.; Liu, J.; Xu, C. Wind, wave and earthquake responses of offshore wind turbine on monopile foundation in clay.Soil Dyn. Eathquake Eng. 2018,113, 47–57. [CrossRef]
64. Yeter, B.; Garbatov, Y.; Guedes Soares, C. Evaluation of fatigue damage model prediction for fixed offshore wind turbine support structure.Int. J. Fatigue2016,87, 71–80. [CrossRef]
65. Muskulus, M. Pareto-Optimal Evaluation of Ultimate Limit States in Offshore Wind Turbine Structural Analysis.Energies2015,8, 14026–14039. [CrossRef]
66. Zhu, B.; Wen, K.; Kong, D.; Zhu, Z.; Wang, L. A numerical study on the lateral loading behaviour of offshore tetrapod piled jacket foundations in clay.Appl. Ocean Res.2018,75, 165–177. [CrossRef]
67. Bento, N.; Fontes, M. Emergence of floating offshore wind energy: Technology and industry.Renew. Sustain. Energy Rev.2019,99, 66–82. [CrossRef]
68. Kausche, M.; Adam, F.; Dahlhaus, F.; Grobmann, J. Floating offshore wind-economic and ecological challenges of a TLP solution.Renew. Energy2018,126, 270–280. [CrossRef]
69. Wang, X.; Zeng, X.; Li, J.; Yang, X.; Wang, H. A review on recent advancements of substructures for offshore wind turbines.Renew. Sustain. Energy Rev.2018,158, 103–119. [CrossRef]
J. Mar. Sci. Eng.2019,7, 441 18 of 18
71. Zhang, P.; Wei, W.; Jia, N.; Ding, H.; Liu, R. Effect of seepage on the penetration resistance of bucket foundations with bulkheads for offshore wind turbines in sand.Ocean Eng.2018,156, 82–92. [CrossRef] 72. Byrne, B.; Houlsby, G.; Martin, C.; Fish, P. Suction caissons foundations for offshore wind turbines.Wind Eng.
2002,26, 145–155. [CrossRef]
73. Houlsby, G.; Byrne, B. Suction caisson foundations for offshore wind turbines and anemometer masts.Wind Eng.2000,24, 249–255. [CrossRef]
74. Ashuri, T.; Zaayer, M.B. Review of design concepts, methods and considerations of offshore wind turbines. In Proceedings of the 2007 European Offshore Wind Conference and Exhibition, Berlin, Germany, 4–6 December 2007.
75. Iberdrola.Foundations in Offshore Wind Farms; Technical report; Iberdrola: Bilbao, Spain, 2017.
76. Zheng, C.W.; Xiao, Z.N.; Peng, Y.H.; Li, C.Y.; Du, Z.B. Rezoning global offshore wind energy resources. Renew. Energy2018,129, 1–11. [CrossRef]
77. Van-Tan, T.; Tsai-Hsiang, C. Assessing the Wind Energy for Rural Areas of Vietnam.Int. J. Renew. Energy Res.
2013,3, 523–528.
![Table 1. Capacity installed by country at the end of 2018 (UK: United Kingdom; GER: Germany; CHI:China; DEN: Denmark; BEL: Belgium; NET: Netherlands; SWE: Sweden; VIE: Vietnam; JAP: Japan;KOR: Korea; FIN: Finland; USA: United States of America; IRE: Ireland; SPA: Spain; NOR: Norway;FRA: France) (Own elaboration based on [3,7]).](https://thumb-us.123doks.com/thumbv2/123dok_us/9698764.1497620/2.595.82.516.145.352/capacity-installed-denmark-belgium-netherlands-finland-america-elaboration.webp)