https://doi.org/10.5194/cp-13-977-2017
© Author(s) 2017. This work is distributed under the Creative Commons Attribution 3.0 License.
Preindustrial nitrous oxide emissions from the land biosphere
estimated by using a global biogeochemistry model
Rongting Xu1, Hanqin Tian1, Chaoqun Lu2, Shufen Pan1,3, Jian Chen4,1, Jia Yang1, and Bowen Zhang1
1International Center for Climate and Global Change Research and School of Forestry and Wildlife Sciences, Auburn University, Auburn, AL 36849, USA
2Department of Ecology, Evolution, & Organismal Biology, Iowa State University, Ames, IA 50011, USA
3State Key Laboratory of Urban and Regional Ecology, Research Center for Eco-Environmental Sciences, Chinese Academy of Sciences, Beijing 100085, China
4Department of Geosciences, College of Sciences and Mathematics, Auburn University, Auburn, AL 36849, USA
Correspondence to:Hanqin Tian (tianhan@auburn.edu)
Received: 8 October 2016 – Discussion started: 24 October 2016
Revised: 29 May 2017 – Accepted: 24 June 2017 – Published: 28 July 2017
Abstract.To accurately assess how increased global nitrous oxide (N2O) emission has affected the climate system re-quires a robust estimation of the preindustrial N2O emis-sions since only the difference between current and prein-dustrial emissions represents net drivers of anthropogenic climate change. However, large uncertainty exists in previ-ous estimates of preindustrial N2O emissions from the land biosphere, while preindustrial N2O emissions on the finer scales, such as regional, biome, or sector scales, have not been well quantified yet. In this study, we applied a process-based Dynamic Land Ecosystem Model (DLEM) to esti-mate the magnitude and spatial patterns of preindustrial N2O fluxes at the biome, continental, and global level as driven by multiple environmental factors. Uncertainties associated with key parameters were also evaluated. Our study indicates that the mean of the preindustrial N2O emission was approx-imately 6.20 Tg N yr−1, with an uncertainty range of 4.76 to 8.13 Tg N yr−1. The estimated N2O emission varied signif-icantly at spatial and biome levels. South America, Africa, and Southern Asia accounted for 34.12, 23.85, and 18.93 %, respectively, together contributing 76.90 % of global total emission. The tropics were identified as the major source of N2O released into the atmosphere, accounting for 64.66 % of the total emission. Our multi-scale estimates provide a robust reference for assessing the climate forcing of anthropogenic N2O emission from the land biosphere
1 Introduction
Nitrous oxide (N2O) acts as the third most important green-house gas (GHG) after carbon dioxide (CO2) and methane (CH4), contributing greatly to the current radiative forcing (Myhre et al., 2013). Nitrous oxide is also the most long-lived reactant, resulting in the destruction of stratospheric ozone (Prather et al., 2015; Ravishankara et al., 2009). The atmospheric concentration of N2O has increased from 275 to 329 parts per billion (ppb) since the preindustrial era un-til 2015 at a rate of approximately 0.26 % per year, as a result of human activities (Davidson, 2009; Forster et al.,
2007; NOAA2006A, 2016). The human-induced N2O
David-son (2009). Therefore, it is necessary to provide a robust ref-erence of preindustrial N2O emission for assessing the cli-mate forcing of anthropogenic N2O emission from the land biosphere.
Numerous studies have reported the sources and estimates of N2O emission since the preindustrial era (Davidson and Kanter, 2014; Galloway et al., 2004; Kroeze et al., 1999; Prather et al., 2012, 2015; Syakila and Kroeze, 2011). Ac-cording to the Intergovernmental Panel on Climate Change Guidelines (IPCC, 1997), the global N2O emission evaluated by Kroeze et al. (1999) is 11 (8–13) Tg N yr−1(natural soils: 5.6–6.6 Tg N yr−1; anthropogenic: 1.4 Tg N yr−1), which is consistent with the estimation from global preagricultural N2O emissions in soils (6–7 Tg N yr−1) (Bouwman et al., 1993). While taking into account the new emission factor from the IPCC 2006 Guidelines (Denman et al., 2007), Syak-ila and Kroeze (2011) conducted an updated estimate based on the study of Kroeze et al. (1999) and reported that the global preindustrial N2O emission is 11.6 Tg N yr−1 (anthro-pogenic: 1.1 Tg N yr−1; natural soils: 7 Tg N yr−1). Based on the IPCC AR5, Davidson and Kanter (2014) indicated that the central estimates of both top–down and bottom–up ap-proaches for preindustrial natural emissions were in agree-ment at 11 (10–12) Tg N yr−1, including natural emission from soils at 6.6 (3.3–9.0) Tg N yr−1 (Syakila and Kroeze, 2011). Prather et al. (2015) provided an estimate of the prein-dustrial emissions (total natural emission: 10.5 Tg N yr−1) based on the most recent study with a corrected lifetime of 116±9 years. Although these previous estimates intend to provide a baseline of preindustrial N2O emission at a global level, information on preindustrial N2O emissions at fine res-olutions such as biome, sector or country, and regional levels remains unknown but is needed for climate change mitiga-tion.
Large uncertainties in the estimates of preindustrial N2O emission could derive from different approaches (i.e., top– down and bottom–up), as mentioned above. Nitrous oxide, as an important component of the N cycle, is produced by bi-ological processes such as denitrification and nitrification in terrestrial and aquatic systems (Schmidt et al., 2004; Smith and Arah, 1990; Wrage et al., 2001). In order to accurately estimate preindustrial N2O emissions using the process-based Dynamic Land Ecosystem Model (DLEM; Tian et al., 2010), uncertainties associated with key parameters, such as maximum nitrification and denitrification rates, biological N fixation (BNF) rates, and the adsorption coefficient for soil ammonium (NH+4) and nitrate (NO−3), were required to be considered in model simulation. Upper and lower limits of these parameters were used to derive a range of preindustrial N2O emissions from terrestrial ecosystems.
In this study, the DLEM was used to simulate global N2O emission in the preindustrial era at a resolution of 0.5◦×0.5◦ latitude×longitude. Since there are no observational data of N2O emission in the preindustrial period, the estimates of natural emission from Prather et al. (2012, 2015) were used
to validate the simulation results. In addition, site-level N2O emissions from different natural vegetation were used to test model performance in the contemporary period. The objec-tives in this study include (1) providing a global estimation of N2O emission from terrestrial soils in 1860, (2) offering the continental-, biome-, and country-scale N2O emission amounts and flux rates, and (3) discussing uncertainties in estimating N2O budget in the preindustrial era. Finally, our estimates on global and biome scales were compared with previous estimates.
2 Methodology
2.1 Model description
The DLEM is a highly integrated process-based ecosystem model, which combines biophysical characteristics, plant physiological processes, biogeochemical cycles, vegetation dynamics, and land use to make daily, spatially explicit esti-mates of carbon, nitrogen, and water fluxes and pool sizes in terrestrial ecosystems from site and regional to global scales (Lu and Tian, 2013; Tian et al., 2012, 2015). The DLEM is characterized of cohort structure, multiple soil layer pro-cesses, coupled carbon, water, and nitrogen cycles, multi-ple GHG emissions simulation, enhanced land surface pro-cesses, and dynamic linkages between terrestrial and riverine ecosystems (Liu et al., 2013; Tian et al., 2010, 2015). The previous results of GHG emissions from DLEM simulations have been validated against field observations and measure-ments at various sites (Lu and Tian, 2013; Ren et al., 2011; Tian et al., 2010, 2011; Zhang et al., 2016). The estimates of water, carbon, and nutrient fluxes and storage were also compared with the estimates from different approaches on regional, continental, and global scales (Pan et al., 2014; Tian et al., 2015; Yang et al., 2015). Different soil organic pools and calculations of decomposition rates have been described in Tian et al. (2015). The decomposition and nitrogen min-eralization processes in the DLEM have been described in previous publications (Lu and Tian, 2013; Yang et al., 2015).
The N2O module
Previous work provided a detailed description of trace gas modules in the DLEM (Tian et al., 2010). However, both denitrification and nitrification processes have been modified based on first-order kinetics (Chatskikh et al., 2005; Heinen, 2006).
In the DLEM, the N2O production and fluxes are deter-mined by soil inorganic N content (NH+4 and NO−3) and en-vironmental factors, such as soil texture, temperature, and moisture:
FN2O=(Rnit+Rden)F(Tsoil)(1−F(Qwfp)), (1) whereFN2O is the N2O flux from soils to the atmosphere
Rdenis the daily denitrification rate (g N m2d−1),F(Tsoil) is the function of daily soil temperature on nitrification process (unitless), andF(Qwfp) is the function of water-filled poros-ity (unitless).
Nitrification, a process converting NH+4 into NO−3, is sim-ulated as a function of soil temperature, moisture, and soil NH+4 concentration:
Rnit=knitF(Tsoil)F(ψ)CNH4, (2)
whereknitis the daily maximum fraction of NH+4 that is con-verted into NO−3 or gases (d−1),F(ψ) is the soil moisture ef-fect (unitless), andCNH4 is the soil NH
+
4 content (g N m −2). Unlike in Chatskikh et al. (2005), who setknit to 0.10 d−1, knitvaries with different plant functional types (PFTs) in the DLEM with a range of 0.04 to 0.15 d−1. The detailed calcu-lations of F(Tsoil) andF(ψ) have been described in Pan et al. (2015) and Yang et al. (2015).
Denitrification is the process that converts NO−3 into three types of gases, namely, nitric oxide, N2O, and dinitrogen. The denitrification rate is simulated as a function of soil tem-perature, water-filled porosity, and NO−3 concentrationCNO3
(g N g−1soil):
Rden=αF(Tsoil)F(Qwfp)FN(CNO3), (3) whereFN(CNO3) is the dependency of the denitrification rate
on NO−3 concentration (unitless) andαis the maximum den-itrification rate (g N m−2d−1). The detailed calculations of F(Qwfp),FN(CNO3), andαhave been described in Yang et al. (2015).
In each grid cell, there are four natural vegetation types and one crop type. The sum of N2O emission in each grid d−1 is calculated by the following formula:
E=
62 481
X
i=1 5
X
j=1
Nij ×fij
×Ai×106/1012, (4)
whereEis the daily sum of N2O emission from all PFTs in total grids (Tg N yr−1d−1);Nij (g N m−2) is the N2O emis-sion in the grid cellifor PFTj;fijis the fraction of cell used
for PFTj in grid celli; andAi (km2) is the area of theith
grid cell. The factor 106converts square kilometers to square meters, and 1012converts grams to teragrams.
2.2 Input datasets
Input data to drive the DLEM simulation include static and transient data (Tian et al., 2010). Several additional datasets were generated to better represent the terrestrial environ-ment in the preindustrial period as described below. The nat-ural vegetation map was developed based on LUH (Land Use Harmonization; Hurtt et al., 2011) and a new joint 1 km global land cover product (SYNMAP) (Jung et al., 2006), which rendered the fractions of 47 vegetation types
in each 0.5◦grid. These 47 vegetation types were converted to 15 PFTs used in the DLEM through a cross-walk table (Fig. 1). Cropland distribution in 1860 was developed by ag-gregating the 5 arcmin resolution HYDE (History Database of the Global Environment) v3.1 global cropland distribu-tion data (Fig. 2). Half-degree daily climate data (including average, maximum, minimum air temperature, precipitation, relative humidity, and shortwave radiation) were derived from CRU-NCEP (Climate Research Unit – National Cen-ters for Environmental Prediction) climate forcing data (Wei et al., 2014). As a global climate dataset was not available prior to the year 1900, long-term average climate datasets from 1901 to 1930 were used to represent the initial climate state in 1860. The nitrogen deposition dataset was developed based on the atmospheric chemistry transport model (Den-tener, 2006) constrained by the EDGAR(Emission Database for Global Atmospheric Research)-HYDE nitrogen emission data (Aardenne et al., 2001). The nitrogen deposition dataset provided interannual variations in NHx–N and NOy–N
de-position rates. The manure nitrogen production during 1961– 2014 was derived by integrating the national level livestock population from FAO (http://faostat.fao.org) and the default N excretion rate for different livestock from IPCC 2006 Tier 1 (Zhang et al., 2017). Estimates of manure production from 1860 to 1960 were retrieved from the global estimates in Hol-land et al. (2005).
2.3 Model simulation
Figure 1.Global potential natural vegetation map used by DLEM in the preindustrial era. BNEF: boreal needleleaf evergreen forest; BNDF: boreal needleleaf deciduous forest; TBDF: temperate broadleaf deciduous forest; TBEF: temperate broadleaf evergreen forest; TNEF: tem-perate needleleaf evergreen forest; TNDF: temtem-perate needleleaf deciduous forest; TrBDF: tropical broadleaf deciduous forest; TrBEF: tropi-cal broadleaf evergreen forest; Dshrub: deciduous shrubland; Eshrub: evergreen shrubland.
Cropland area (km grid2 -1)
0–150 150–300
300–600 600–1000
1000–1300 1300–1600
1600–2000 > 2000
Figure 2.The spatial distribution of cropland area in 1860.
2.4 Model validation
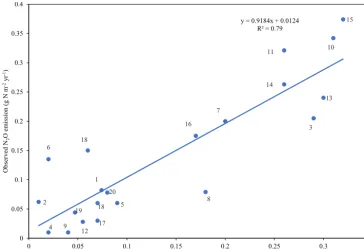
Observations of annual N2O emission accumulations
(g N m−2yr−1) were selected to compare with the simulated emissions at different sites. As there were no field measure-ments in the preindustrial era, observations during 1970–
1
2
3
4
5 6
7
8
9
10 11
12
13 14
15
16
17 18 18
19 20
y = 0.9184x + 0.0124 R² = 0.79
0 0.05 0.1 0.15 0.2 0.25 0.3 0.35 0.4
0 0.05 0.1 0.15 0.2 0.25 0.3 0.35
Ob
se
rv
ed
N2
O em
issio
n
(g
N m
-2yr -1)
Simulated N2O emission (g N m-2yr-1)
Figure 3.The comparison of the DLEM-simulated N2O emissions with field observations. All sites are described in the Supplement (Ta-ble S1).
the simulated N2O emissions have a good correlation with field observations (R2=0.79,p <0.001). This indicates that the DLEM has the capacity to simulate N2O emissions in the preindustrial era driven by environmental factors back then. Detailed information for each site can be found in Table S1 in the Supplement.
2.5 Estimate of uncertainty
In this study, uncertainties in the simulated N2O emission were evaluated through a global sensitivity and uncertainty analysis as described in Tian et al. (2011). Based on sensi-tivity analyses of key parameters that affect terrestrial N2O fluxes, the most sensitive parameters were identified to con-duct uncertainty simulations with the DLEM. These param-eters include potential denitrification and nitrification rates, BNF rates, and the adsorption coefficient for soil NH+4 and NO−3 (Gerber et al., 2010; Tian et al., 2015; Yang et al., 2015). The ranges of five parameters were obtained from pre-vious studies. Chatskikh et al. (2005) set knit to 0.10 d−1; however, it was set to a range of 0.04 to 0.15 d−1 and var-ied with different PFTs in the DLEM simulations. The un-certainty ranges of potential nitrification rates were based on previous studies (Hansen, 2002; Heinen, 2006); the global preindustrial N fixation was estimated to be 58 Tg N yr−1, ranging from 50 to 100 Tg N yr−1 (Vitousek et al., 2013). The spatial distribution of BNF was based on the estimates by Cleveland et al. (1999). The potential denitrification rate was set to an uncertainty range of 0.025–0.74 d−1and varied
with different PFTs in the DLEM. The uncertainty ranges of the adsorption coefficient were based on the sensitivity anal-ysis conducted in Yang et al. (2015). Parameters used in the DLEM simulations for uncertainty analysis were assumed to follow a normal distribution. The improved Latin hypercube sampling (LHS) approach was used to randomly select an en-semble of 100 sets of parameters (R version 3.2.1) (Tian et al., 2011, 2015).
In the DLEM, after the model reached equilibrium state, a spin-up run was implemented using de-trended climate data from 1901 to 1930 for each set of parameter values. Then, each set of the model was run in transient mode for 1860 to produce the result of the preindustrial N2O emissions. All results from 100 groups of simulations are shown in Ta-ble S2. The Shapiro–Wilk test was used on 100 sets of re-sults to check the normality of DLEM simulations. It turned out that the distribution is not normal (P value < 0.05, R ver-sion 3.2.1), as shown in Fig. S1 in the Supplement. Thus, the uncertainty range was represented as the minimum and maximum value of 100 sets of DLEM simulations.
3 Results and discussion
3.1 Magnitude and spatial distribution of N2O emission
The global mean preindustrial soil N2O emission was
120° E 120° E
60° E 60° E
0° 0°
60° W 60° W
120° W 120° W
180° 180°
60° N 60° N
30° N 30° N
0° 0°
30° S 30° S
60° S 60° S
90° 90°
N O emission (g N m yr )2
-2 -1
0– 0.03 0.03–0.06 0.06–0.1
0.10–0.2 0.2–0.3 > 0.3
Figure 4.The spatial distribution of N2O emission in the preindustrial era.
sets of DLEM simulations. The terrestrial ecosystem in the preindustrial period acted as a source of N2O, and its spa-tial pattern mostly depends on the biome distribution across the global land surface. The spatial distribution of annual N2O emission in a 0.5◦×0.5◦ grid (Fig. 4) shows that strong sources were found near the Equator, such as South-east Asia, central Africa, and Central America, where N2O emission reached as high as 0.45 g N m−2yr−1. Weak N2O sources were observed in the northern areas of North Amer-ica and Asia, where the estimated N2O emission was less than 0.001 g N m−2yr−1. Microbial activity in soils deter-mined the rate of nitrification and denitrification processes, which accounts for approximately 70 % of global N2O emis-sions (Smith and Arah, 1990; Syakila and Kroeze, 2011). The tropical regions near the Equator could provide optimum temperatures and soil moistures for microbes to decompose soil organic matter and release more NOxand CO2into the atmosphere (Butterbach-Bahl et al., 2013). Referring to the observational data from field experiments and model simu-lations in the tropics, it has been argued that the tropics are the main sources within the total N2O emissions from nat-ural vegetation (Bouwman et al., 1995; Werner et al., 2007; Zhuang et al., 2012).
In this study, Asia is divided into two parts: Southern Asia and Northern Asia, where the PFTs and climate condi-tions are significantly contrasting. As shown in Fig. 1, trop-ical forest and cropland were dominant PFTs in Southern Asia. In contrast, temperate and boreal forests were the main PFTs in Northern Asia. The estimates of N2O emissions from seven land regions are shown in Fig. 5. On continen-tal scales, the N2O emission was 2.09 (1.63–2.73) Tg N yr−1 in South America, 1.46 (1.13–1.91) Tg N yr−1in Africa, and 1.16 (0.90–1.52) Tg N yr−1 in Southern Asia. South
Amer-ica, AfrAmer-ica, and Southern Asia accounted for 33.77, 23.60, and 18.73 %, respectively, together, which was 76.10 % of global total emission. Europe and Northern Asia contributed 0.45 (0.32–0.66) Tg N yr−1, which was less than 10 % of the total emission.
0.00 0.50 1.00 1.50 2.00 2.50 3.00
Africa Northern
Asia SouthernAsia Oceania Europe AmericaNorth AmericaSouth N2
O
em
iss
io
n
(T
g
N
yr
-1 )
N2
O
em
iss
io
n
ra
te
(g
N
m
-2 yr -1 )
(b)
0.00 0.02 0.04 0.06 0.08 0.10 0.12 0.14 0.16 0.18
(a)
Figure 5.Estimated N2O emission rates(a)and emissions(b)with uncertainty ranges at continental level in 1860. Solid line within each
box refers to the median value of N2O emission rate or amount.
As shown in Fig. 2, cropland areas varied spatially. The regions with large areas of cropland were all of Europe, In-dia, eastern China, and the central–eastern United States. The global N2O emission from croplands was estimated as being 0.41 (0.32–0.55) Tg N yr−1, which is about 10 times less than the estimate reported in the IPCC AR5 (Ciais et al., 2014). As no synthetic N fertilizer was applied to the cropland in 1860, leguminous crops were the major source of N2O emission from croplands, most of which were planted in the central– eastern United States (Fig. 4). Rochette et al. (2004) con-ducted the experiments on the N2O emission from soybean without the application of N fertilizer. Their work was in agreement with the suggestion that legumes may increase
N2O emissions compared with non-BNF crops (Duxbury
et al., 1982) The background emission from ground-based
experiments was as high as 0.31–0.42 kg N ha−1 in Canada (Duxbury et al., 1982; Rochette et al., 2004).
N2
O
em
iss
io
n
ra
te
(g
N
m
-2 yr -1 )
0 0.05 0.1 0.15 0.2 0.25
0.00 0.01 0.02 0.03 0.04 0.05 0.06 0.07
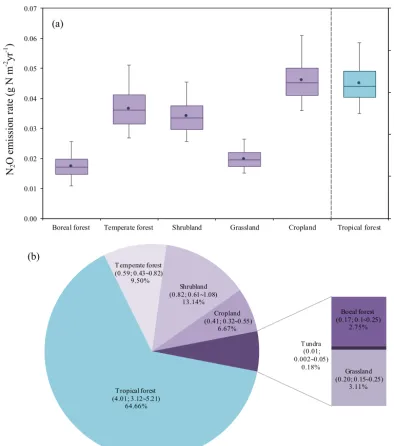
Boreal forest Temperate forest Shrubland Grassland Cropland Tropical forest (a)
Tropical forest (4.01; 3.125.21)
64.66% Temperate forest (0.59; 0.430.82)
9.50%
Boeal forest (0.17; 0.10.25)
2.75%
Tundra (0.01; 0.0020.05)
0.18% Shrubland
(0.82; 0.611.08) 13.14%
Grassland (0.20; 0.150.25)
3.11% Cropland
(0.41; 0.320.55) 6.67% (b)
Figure 6.(a)Estimated N2O emission rate at the biome level in 1860 with the median value (solid line), the mean (solid dot), and the uncertainty range of emission rates from different biomes. The emission rate in the tundra was removed because of the extremely small value
(less than 0.003 g N m−2yr−1).(b)Estimated N2O emission (Tg N yr−1) with uncertainty ranges and its percentage (%) at the biome level
in 1860.
era. Previous studies indicated that agriculture produces the majority of anthropogenic N2O emissions (Ciais et al., 2014; Davidson and Kanter, 2014). Our estimate on country scales could be used as a reference to quantify the net increase in N2O emissions from agriculture activities in countries of hot spots.
There is a debate about whether the natural wetlands and peatlands act as sinks or sources of N2O. Previous studies showed that N2O emissions from natural peatlands are usu-ally negligible; however, the drained peatlands with lower water tables might act as sources of N2O (Augustin et al.,
hy-Table 1.Preindustrial N2O emissions from natural vegetation and croplands in different countries. 1 Mha=104km2.
Vegetation Natural soils Cropland Total
Country area (Mha) (Gg N yr−1) (Gg N yr−1) (Gg N yr−1)
China 756.3 188 62 250
India 306.8 121 64 185
United States 913.9 296 81 377
Pakistan 65.1 5 6 11
Indonesia 174.1 181 2 183
France 52.3 7 9 16
Brazil 835.1 1017 11 1028
Canada 914.6 94 2 96
Germany 36.0 9 4 13
Turkey 74.3 17 11 28
Mexico 191.0 118 3 121
Vietnam 31.7 41 2 43
Spain 48.2 14 6 20
Russian Federation 1575.3 234 19 253
Bangladesh 12.4 2 5 7
Thailand 49.3 56 3 59
drological zone. We were unable to examine N2O fluxes from wetlands and peatlands in 1860 as human-induced land use in those ecosystems was unknown. Thus, we excluded the N2O emissions from wetlands and peatlands in this study.
3.2 Revisiting preindustrial global N2O emission by
incorporating top–down estimates
The “top–down” methodology used to estimate N2O emis-sions is based on atmospheric measurements and inversion modeling (Thompson et al., 2014). Prather et al. (2012) pro-vided an estimate of 9.1±1.0 Tg N yr−1 of natural emis-sions in the preindustrial era using observed preindustrial abundances of 270 ppb and model estimates of lifetime de-creases from 142 years in the preindustrial era to 131±10 years in the present day. Later, Prather et al. (2015) reevalu-ated N2O lifetime based on Microwave Limb Sounder satel-lite measurements of the stratosphere, which were consis-tent with modeled values in the present day. The lifetime in the preindustrial era and the present day was estimated to be 123 and 116±9 years, respectively. The current lifetime in-creases the preindustrial natural emission from 9.1±1.0 to 10.5 Tg N yr−1.
Natural sources for N2O include soil under natural vegeta-tion, oceans, and atmospheric chemistry (Ciais et al., 2014). The emission from atmospheric chemistry was estimated as being 0.6 with an uncertainty range of 0.3–1.2 Tg N yr−1. Syakila and Kroeze (2011) estimated global natural emis-sions from oceans as 3.5 Tg N yr−1. Oceanic emission was estimated as being 3.8 with an uncertainty range of 1.8– 5.8 Tg N yr−1 in the IPCC AR4. However, the uncertainty range became larger (1.8–9.4 Tg N yr−1) in the IPCC AR5. In our study, the simulated N2O emission came from
agri-cultural and natural soils. The natural emission was esti-mated as being 5.78 (4.4–7.72) Tg N yr−1. Combining the at-mospheric chemistry and the ocean emissions in the IPCC AR5 with the natural emissions from our study, the global to-tal natural N2O emissions were 10.18 (6.5–18.32) Tg N yr−1. The large uncertainty range was attributed to the uncer-tainty from oceanic emission, atmospheric chemistry emis-sion, and our estimation. The estimated global total amount (10.18 Tg N yr−1) in this study was comparable to the esti-mate (10.5 Tg N yr−1) by Prather et al. (2015) using the top– down approach.
3.3 Comparison with estimates using the bottom–up methodology
Although Bouwman et al. (1993) has studied the poten-tial N2O emission from natural soils, our study provided a first estimate of spatially distributed N2O emission in 1860 using the biogeochemical process-based model. Bouwman et al. (1993) provided 1◦×1◦ monthly N2O emission us-ing the monthly controllus-ing factors without considerus-ing the impact of N deposition. In their study, the soil fertility and carbon content were constant for every month, which can-not reflect the monthly dynamic changes of carbon and N pools in natural soils. Moreover, although their study repre-sented a spatial distribution of potential N2O emission from natural soils, they did not provide that estimate on biome, continent, and country scales. Thus, their result was hardly to be used as a regional reference for the net human-induced N2O emissions from some hot spots, such as Southern Asia. In contrast, in our study, using a daily climate and N deposi-tion dataset better reflects the real variadeposi-tion in N2O emission through the growing season in natural ecosystems. The com-parison with field observations during 1997–2001 indicated that the DLEM can catch the daily peak N2O emissions in Hubbard Brook Forest (Tian et al., 2010) and Inner Mongo-lia (Tian et al., 2011).
Regarding the N2O emission from croplands, our estimate is comparable to the estimate of 0.3 (0.29–0.35) Tg N yr−1 extracted from Syakila and Kroeze (2011) by digitizing graphs using the Getdata Graph Digitizer. In their study, the estimation was based on the relationship between the crop production and human population during 1500–1970. In con-trast, the result in our study was estimated based on the crop-land area of a specific crop type (mainly soybean, rice, corn, and wheat) in 1860.
Thus, the DLEM is capable of providing an estimate of N2O emission from natural ecosystems on regional and biome scales with a higher spatial resolution. This could be a useful reference for quantifying the effects of human activi-ties – such as LULC change, N fertilizer and manure applica-tion, and, increasingly, atmospheric N deposition – on N2O emissions in different terrestrial ecosystems or sectors in the contemporary period.
3.4 The N2O budget in the preindustrial era
The observed N2O concentration is the result of dynamic production and consumption processes in soils as soils act as sources or sinks of N2O through denitrification and nitri-fication (Chapuis-Lardy et al., 2007). There was a slight in-crease in atmospheric N2O concentration during 1750–1860 according to the ice core records, but these showed a rapid increase from 1860 to present (Ciais et al., 2014). Natural sources of N2O emissions have been discussed in Sect. 3.2 and 3.3. Previous studies found that there were some an-thropogenic N2O emissions along with the natural sources in the preindustrial era (Davidson, 2009; Syakila and Kroeze, 2011). Syakila and Kroeze (2011) found that anthropogenic N2O emission began in 1500 because of biomass burning
and agriculture. The total anthropogenic N2O emission in their study was estimated as being 1.1 Tg N in 1850. In ad-dition, Davidson (2009) derived a time-course analysis of sources and sinks of atmospheric N2O since 1860. The prein-dustrial anthropogenic N2O sources in his study included biomass burning, agriculture (e.g., manure and fertilizer ap-plication and the cultivation of legumes) and human sewage, the sum of which was 0.7 (0.6–0.8) Tg N yr−1 (Davidson, 2009). Thus, anthropogenic N2O emission already existed in 1860, but it was smaller than the contemporary amount.
Davidson (2009) mentioned that there was possibly a cer-tain amount of N2O loss in the preindustrial period through atmospheric sink and the reduced emission from tropical de-forestation. He estimated the anthropogenic sink as being 0.26 Tg N in 1860. In addition, the deforestation of tropical forest may have caused a loss of N2O emissions in 1860, which was estimated as being 0.03 Tg N (Davidson, 2009). However, studies have shown that the conversion of forest to pasture and cropland could increase or have no effect on N2O emissions because the effects depended on the distur-bance intensity of human activities on soil conditions (van Lent et al., 2015). For instance, N2O emissions tended to in-crease during the first 5–10 years after conversion and there-after might decrease to average upland forest or low canopy forest levels in the non-fertilized croplands and pastures. In contrast, emissions were at a high level during and after fer-tilization in fertilized croplands (van Lent et al., 2015). Thus, more work is needed to study how forest degradation affects N2O fluxes (Mertz et al., 2012).
3.5 Future research needs
Large uncertainty still exists in the DLEM simulation associ-ated with the quality of input datasets and parameters applied in simulations. Although input datasets could play a signif-icant role in the variety of the model output, it is difficult to obtain accurate datasets going back to the year 1860. Av-erage climate data from 1901 to 1930 were used to run the model simulation, which could raise the uncertainty in esti-mating N2O emission in 1860. The datasets of LULC, N de-position, and manure application in 1860 could introduce un-certainties into this estimate. The average oceanic and atmo-spheric chemistry emissions cited from the IPCC AR5 could introduce uncertainty into the calculation of the total natu-ral emissions in 1860 when compared with the estimate done by Prather et al. (2015). Thus, a more accurate estimate of oceanic N2O emissions is significant for narrowing the con-fidence estimate of the preindustrial terrestrial sources. The N2O fluxes from wetlands and peat need to be included in any future study.
4 Conclusions
N2O emissions for major PFTs across global land surface. Improved LHS was performed to analyze uncertainty ranges of the estimates. We estimated that preindustrial N2O emis-sion is 6.20 Tg N yr−1. The modeled results showed a large spatial variability due to variations in climate conditions and PFTs. The tropical ecosystem was the dominant contributor of global N2O emissions. In contrast, boreal regions con-tributed less than 5 % to the total emission. China, India, and the United States are the top countries accounting for emis-sions from croplands in 1860. While uncertainties still exist in the N2O emission estimation for the preindustrial era, this study offered a relatively reasonable estimate of the prein-dustrial N2O emission from land soils. Moreover, this study provided a spatial estimate for N2O emission from global hot spots, which could be used as a reference to estimate net human-induced emissions in the contemporary period.
Data availability. All input data and output files used in this pa-per are available from the corresponding author upon request (tian-han@auburn.edu).
The Supplement related to this article is available online at https://doi.org/10.5194/cp-13-977-2017-supplement.
Author contributions. HT, SP, and RX initiated this research and designed model simulations. RX performed DLEM simulations, analyses, and calculations. CL contributed to the model calibration and data analysis. JC contributed to the data processing and sta-tistical analysis. JY took charge of input datasets preparation (en-vironmental factors), data description, and model verification. BZ provided manure N input data. All coauthors contributed to the de-velopment of the paper.
Competing interests. The authors declare that they have no con-flict of interest.
Acknowledgements. This work was supported by National
Key Research and Development Program of China (no.
2017YFA0604700), National Science Foundation (NSF) Grants (1243232, 121036), the Chinese Academy of Sciences STS Pro-gram (KFJ-STS-ZDTP-0), SKLURE Grant (SKLURE2017-1-6), and Auburn University IGP Program. We wish to thank the previous members in the International Center for Climate and Global Change Research, who made great contributions to the improvements of the DLEM in the past decade. We would also thank Eric A. Davidson and one anonymous reviewer who have provided thoughtful comments and suggestions, which led to a major improvement in the paper.
Edited by: Carlo Barbante
Reviewed by: E. A. Davidson and one anonymous referee
References
Aardenne, J. V., Dentener, F., Olivier, J., Goldewijk, C., and
Lelieveld, J.: A 1×1 resolution data set of historical
anthro-pogenic trace gas emissions for the period 1890–1990, Glob. Biogeochem. Cy., 15, 909–928, 2001.
Alexander, V. and Billington, M.: Nitrogen fixation in the Alaskan taiga, in: Forest ecosystems in the Alaskan taiga, Springer, New York, 112–120, 1986.
Augustin, J., Merbach, W., Steffens, L., and Snelinski, B.: Nitrous oxide fluxes of disturbed minerotrophic peatlands, Agribiol. Res., 51, 47–57, 1998.
Bate, G. and Gunton, C.: Nitrogen in the Burkea savanna, in: Ecol-ogy of tropical savannas, Springer, New York, 498–513, 1982. Bouwman, A., Fung, I., Matthews, E., and John, J.: Global
anal-ysis of the potential for N2O production in natural soils, Glob.
Biogeochem. Cy., 7, 557–597, 1993.
Bouwman, A., Van der Hoek, K., and Olivier, J.: Uncertainties in the global source distribution of nitrous oxide, J. Geophys. Res.-Atmos., 100, 2785–2800, 1995.
Butterbach-Bahl, K., Baggs, E. M., Dannenmann, M., Kiese, R., and Zechmeister-Boltenstern, S.: Nitrous oxide emis-sions from soils: how well do we understand the processes and their controls?, Philos. T. R. Soc. B, 368, 20130122, https://doi.org/10.1098/rstb.2013.0122, 2013.
Chapuis-Lardy, L., Wrage, N., Metay, A., CHOTTE, J. L., and
Bernoux, M.: Soils, a sink for N2O? A review, Glob. Change
Biol., 13, 1–17, 2007.
Chatskikh, D., Olesen, J. E., Berntsen, J., Regina, K., and Yamulki, S.: Simulation of effects of soils, climate and management on
N2O emission from grasslands, Biogeochemistry, 76, 395–419,
2005.
Ciais, P., Sabine, C., Bala, G., Bopp, L., Brovkin, V., Canadell, J., Chhabra, A., DeFries, R., Galloway, J., Heimann, M., and Jones, C.: Carbon and other biogeochemical cycles. In Climate Change 2013: The Physical Science Basis. Contribution of Working Group I to the Fifth Assessment Report of the Intergovernmen-tal Panel on Climate Change, Cambridge University Press, Cam-bridge, UK, 465–570, 2014.
Cleveland, C. C., Townsend, A. R., Schimel, D. S., Fisher, H., Howarth, R. W., Hedin, L. O., Perakis, S. S., Latty, E. F., Von Fischer, J. C., and Elseroad, A.: Global patterns of terrestrial
bi-ological nitrogen (N2) fixation in natural ecosystems, Glob.
Bio-geochem. Cy., 13, 623–645, 1999.
Cleveland, C. C., Houlton, B. Z., Neill, C., Reed, S. C., Townsend, A. R., and Wang, Y.: Using indirect methods to constrain symbi-otic nitrogen fixation rates: a case study from an Amazonian rain forest, Biogeochemistry, 99, 1–13, 2010.
Couwenberg, J., Thiele, A., Tanneberger, F., Augustin, J., Bärisch, S., Dubovik, D., Liashchynskaya, N., Michaelis, D., Minke, M., and Skuratovich, A.: Assessing greenhouse gas emissions from peatlands using vegetation as a proxy, Hydrobiologia, 674, 67– 89, 2011.
Davidson, E. A.: The contribution of manure and fertilizer nitrogen to atmospheric nitrous oxide since 1860, Nat. Geosci., 2, 659– 662, 2009.
Denman, K., Brasseur, G., Chidthaisong, A., Ciais, P. M., Cox, P., Dickinson, R., Hauglustaine, D., Heinze, C., Holland, E., Jacob, D., Lohmann, U., Ramachandran, S., da Silva Dias, P., Wofsy, S., and Zhang, X.: Couplings Between Changes in the Climate Sys-tem and Biogeochemistry, in: Climate Change 2007: The Physi-cal Science Basis. Contribution of Working Group I to the Fourth Assessment Report of the Intergovernmental Panel on Climate Change, edited by: Solomon, S., Qin, D., Manning, M., Chen, Z., Marquis, M., Averyt, K. B., Tignor, M., and Miller, H., Cam-bridge University Press, CamCam-bridge, UK and New York, NY, USA, 501–566, 2007.
Dentener, F.: Global maps of atmospheric nitrogen deposition, 1860, 1993, and 2050, Data set, Oak Ridge National Laboratory Distributed Active Archive Center, Oak Ridge, TN, USA, avail-able at: http://daac.ornl.gov/ (last access: August 2015), 2006. Duxbury, J., Bouldin, D., Terry, R., and Tate, R. L.:
Emis-sions of nitrous oxide from soils, Nature, 298, 462–464, https://doi.org/10.1038/298462a0, 1982.
Forster, P., Ramaswamy, V., Artaxo, P., Berntsen, T., Betts, R., Fa-hey, D. W., Haywood, J., Lean, J., Lowe, D.C., Myhre, G. , Nganga, J., Prinn, R., Raga, G., Schulz, M., and Van Dorland, R.: Changes in Atmospheric Constituents and in Radiative Forc-ing, in: Climate Change 2007: The Physical Science Basis, Con-tribution of Working Group I to the Fourth Assessment Report of the Intergovernmental Panel on Climate Change, edited by: Solomon, S., Qin, D., Manning, M., Chen, Z., Marquis, M., Av-eryt, K. B., Tignor, M., and Miller, H. L., Cambridge University Press, Cambridge, United Kingdom and New York, NY, USA, 131–217, 2007.
Galloway, J. N., Dentener, F. J., Capone, D. G., Boyer, E. W., Howarth, R. W., Seitzinger, S. P., Asner, G. P., Cleveland, C., Green, P., and Holland, E.: Nitrogen cycles: past, present, and future, Biogeochemistry, 70, 153–226, 2004.
Gerber, S., Hedin, L. O., Oppenheimer, M., Pacala, S. W., and Shevliakova, E.: Nitrogen cycling and feedbacks in a global dynamic land model, Glob. Biogeochem. Cy., 24, GB1001, https://doi.org/10.1029/2008GB003336, 2010.
Gerber, J. S., Carlson, K. M., Makowski, D., Mueller, N. D., Gar-cia de Cortazar-Atauri, I., Havlík, P., Herrero, M., Launay, M., O’Connell, C. S., and Smith, P.: Spatially explicit estimates of
N2O emissions from croplands suggest climate mitigation
op-portunities from improved fertilizer management, Glob. Change Biol., 22, 3383–3394, https://doi.org/10.1111/gcb.13341, 2016. Hadi, A., Inubushi, K., Furukawa, Y., Purnomo, E., Rasmadi, M.,
and Tsuruta, H.: Greenhouse gas emissions from tropical peat-lands of Kalimantan, Indonesia, Nutr. Cycl. Agroecosys., 71, 73– 80, 2005.
Hall, S. J. and Matson, P. A.: Nitrogen oxide emissions after nitro-gen additions in tropical forests, Nature, 400, 152–155, 1999. Hansen, S.: Daisy, a flexible soil-plant-atmosphere system model,
Report. Dept. Agric, The Royal Veterinary- and Agricultural University, Denmark, 2002.
Heinen, M.: Simplified denitrification models: overview and prop-erties, Geoderma, 133, 444–463, 2006.
Holland, E., Lee-Taylor, J., Nevison, C., and Sulzman, J.: Global
N Cycle: Fluxes and N2O mixing ratios originating from
hu-man activity, Data set, Oak Ridge National Laboratory Dis-tributed Active Archive Center, Oak Ridge, TN, USA, available
at: https://doi.org/10.3334/ORNLDAAC/797 (last access: Octo-ber 2015), 2005.
Holtgrieve, G. W., Jewett, P. K., and Matson, P. A.: Variations in soil N cycling and trace gas emissions in wet tropical forests, Oecologia, 146, 584–594, 2006.
Hurtt, G., Chini, L. P., Frolking, S., Betts, R., Feddema, J., Fischer, G., Fisk, J., Hibbard, K., Houghton, R., Janetos, A., Jones, C. D., Kindermann, G., Kinoshita, T., Goldewijk, K. K., and Riahi, K.: Harmonization of land-use scenarios for the period 1500–2100: 600 years of global gridded annual land-use transitions, wood harvest, and resulting secondary lands, Climatic Change, 109, 117–161, 2011.
Huttunen, J. T., Alm, J., Liikanen, A., Juutinen, S., Larmola, T., Hammar, T., Silvola, J., and Martikainen, P. J.: Fluxes of methane, carbon dioxide and nitrous oxide in boreal lakes and potential anthropogenic effects on the aquatic greenhouse gas emissions, Chemosphere, 52, 609–621, 2003.
Intergovernmental Panel on Climate Change (IPCC): Revised 1996 IPCC Guidelines for National Greenhouse Gas Inventories vol 1/3, edited by: Houghton, J. T., Meira Filho, L. G., Lim, B., Treanton, K., Mamaty, I., Bonduki, Y., Griggs, D. J., and Callan-der, B. A. (London: IPCC, OECD and IEA), 1997.
Jung, M., Henkel, K., Herold, M., and Churkina, G.: Exploiting syn-ergies of global land cover products for carbon cycle modeling, Remote Sens. Environ., 101, 534–553, 2006.
Kroeze, C., Mosier, A., and Bouwman, L.: Closing the global N2O
budget: a retrospective analysis 1500–1994, Glob. Biogeochem. Cy., 13, 1–8, 1999.
Liu, M., Tian, H., Yang, Q., Yang, J., Song, X., Lohrenz, S. E., and Cai, W. J.: Long-term trends in evapotranspiration and runoff over the drainage basins of the Gulf of Mexico during 1901– 2008, Water Resour. Res., 49, 1988–2012, 2013.
Lu, C. and Tian, H.: Net greenhouse gas balance in response to ni-trogen enrichment: perspectives from a coupled biogeochemical model, Glob. Change Biol., 19, 571–588, 2013.
Martikainen, P. J., Nykänen, H., Crill, P., and Silvola, J.: Effect of a lowered water table on nitrous oxide fluxes from northern peat-lands, Nature, 366, 51–53, 1993.
Mertz, O., Müller, D., Sikor, T., Hett, C., Heinimann, A., Castella, J.-C., Lestrelin, G., Ryan, C. M., Reay, D. S., Schmidt-Vogt, D., Danielsen, F., Theilade, I., Noordwijk, M. v., Verchot, L. V., Burgess, N. D., Berry, N. J., Pham, T. T., Messerli, P., Xu, J., Fen-sholt, R., Hostert, P., Pflugmacher, D., Bruun, T. B., Neergaard, A. D., Dons, K., Dewi, S., Rutishauser, E., and Sun, Z. L.: The forgotten D: challenges of addressing forest degradation in
com-plex mosaic landscapes under REDD+, Geogr. Tidsskr., 112,
63–76, https://doi.org/10.1080/00167223.2012.709678, 2012. Morse, J. L., Durán, J., Beall, F., Enanga, E. M., Creed, I. F.,
Fer-nandez, I., and Groffman, P. M.: Soil denitrification fluxes from three northeastern North American forests across a range of ni-trogen deposition, Oecologia, 177, 17–27, 2015.
J., Nauels, A., Xia, Y., Bex, V., and Midgley, P. M., Cambridge University Press, Cambridge, United Kingdom and New York, NY, USA, 661–684, 2013.
NOAA2006A: Combined Nitrous Oxide data from the
NOAA/ESRL Global Monitoring Division, 2016.
Pan, S., Tian, H., Dangal, S. R., Zhang, C., Yang, J., Tao, B., Ouyang, Z., Wang, X., Lu, C., Ren, W., Banger, K., Yang, Q. C., Zhang, B. W., and Li, X.: Complex Spatiotemporal Responses of Global Terrestrial Primary Production to Climate Change and
Increasing Atmospheric CO2in the 21st Century, PloS One, 9,
e112810, https://doi.org/10.1371/journal.pone.0112810, 2014. Pan, S., Tian, H., Dangal, S. R., Yang, Q., Yang, J., Lu, C., Tao, B.,
Ren, W., and Ouyang, Z.: Responses of global terrestrial
evapo-transpiration to climate change and increasing atmospheric CO2
in the 21st century, Earth’s Future, 3, 15–35, 2015.
Prather, M. J. and Hsu, J.: Coupling of nitrous oxide and methane by global atmospheric chemistry, Science, 330, 952–954, 2010. Prather, M. J., Holmes, C. D., and Hsu, J.: Reactive greenhouse
gas scenarios: Systematic exploration of uncertainties and the role of atmospheric chemistry, Geophys. Res. Lett., 39, L09803, https://doi.org/10.1029/2012GL051440, 2012.
Prather, M. J., Hsu, J., DeLuca, N. M., Jackman, C. H., Oman, L. D., Douglass, A. R., Fleming, E. L., Strahan, S. E., Steenrod, S. D., Søvde, O. A., Isaksen, I. S. A., Froidevaux, L., and Funke, B.: Measuring and modeling the lifetime of nitrous oxide including its variability, J. Geophys. Res.-Atmos., 120, 5693–5705, 2015. Ravishankara, A., Daniel, J. S., and Portmann, R. W.: Nitrous oxide
(N2O): the dominant ozone-depleting substance emitted in the
21st century, Science, 326, 123–125, 2009.
Reay, D. S., Davidson, E. A., Smith, K. A., Smith, P., Melillo, J. M., Dentener, F., and Crutzen, P. J.: Global agriculture and nitrous oxide emissions, Nature Climate Change, 2, 410–416, 2012. Ren, W., Tian, H., Xu, X., Liu, M., Lu, C., Chen, G., Melillo, J.,
Reilly, J., and Liu, J.: Spatial and temporal patterns of CO2and
CH4fluxes in China’s croplands in response to multifactor
envi-ronmental changes, Tellus B, 63, 222–240, 2011.
Rochette, P., Angers, D. A., Bélanger, G., Chantigny, M. H.,
Prévost, D., and Lévesque, G.: Emissions of N2O from Alfalfa
and Soybean Crops in Eastern Canada, Soil Sci. Soc. Am. J., 68, 493–506, 2004.
Schmidt, I., van Spanning, R. J., and Jetten, M. S.: Denitrifica-tion and ammonia oxidaDenitrifica-tion by Nitrosomonas europaea wild-type, and NirK-and NorB-deficient mutants, Microbiology, 150, 4107–4114, 2004.
Smith, K. A. and Arah, J.: Losses of nitrogen by denitrification and emissions of nitrogen oxides from soils, Proceedings-Fertiliser Society, UK, 299 pp., 1990.
Syakila, A. and Kroeze, C.: The global nitrous oxide budget revis-ited, Greenhouse Gas Measurement and Management, 1, 17–26, 2011.
Thompson, R. L., Ishijima, K., Saikawa, E., Corazza, M., Karstens, U., Patra, P. K., Bergamaschi, P., Chevallier, F., Dlugokencky, E., Prinn, R. G., Weiss, R. F., O’Doherty, S., Fraser, P. J., Steele, L. P., Krummel, P. B., Vermeulen, A., Tohjima, Y., Jordan, A., Haszpra, L., Steinbacher, M., Van der Laan, S., Aalto, T., Mein-hardt, F., Popa, M. E., Moncrieff, J., and Bousquet, P.: TransCom
N2O model inter-comparison – Part 2: Atmospheric inversion
es-timates of N2O emissions, Atmos. Chem. Phys., 14, 6177–6194,
https://doi.org/10.5194/acp-14-6177-2014, 2014.
Tian, H., Xu, X., Liu, M., Ren, W., Zhang, C., Chen, G., and Lu,
C.: Spatial and temporal patterns of CH4and N2O fluxes in
ter-restrial ecosystems of North America during 1979–2008: appli-cation of a global biogeochemistry model, Biogeosciences, 7, 2673–2694, https://doi.org/10.5194/bg-7-2673-2010, 2010. Tian, H., Xu, X., Lu, C., Liu, M., Ren, W., Chen, G., Melillo, J.,
and Liu, J.: Net exchanges of CO2, CH4, and N2O between
China’s terrestrial ecosystems and the atmosphere and their con-tributions to global climate warming, J. Geophys. Res.-Biogeo., 116, G02011, https://doi.org/10.1029/2010JG001393, 2011. Tian, H., Chen, G., Zhang, C., Liu, M., Sun, G., Chappelka, A.,
Ren, W., Xu, X., Lu, C., Pan, S., Chen, H., Hui, D.F., McNulty, S., Lockaby, Graeme, and Vance, E.: Century-scale responses of ecosystem carbon storage and flux to multiple environmental changes in the southern United States, Ecosystems, 15, 674–694, 2012.
Tian, H., Chen, G., Lu, C., Xu, X., Ren, W., Zhang, B., Banger, K., Tao, B., Pan, S., Liu, M., Zhang, C., Bruhwiler, L., and Wofsy, S.: Global methane and nitrous oxide emissions from terrestrial ecosystems due to multiple environmental changes, Ecosystem Health and Sustainability, 1, 1–20, 2015.
Tian, H., Lu, C., Ciais, P., Michalak, A. M., Canadell, J. G., Saikawa, E., Huntzinger, D. N., Gurney, K. R., Sitch, S., and Zhang, B., Yang, J., Bousquet, P., Bruhwiler, L., Chen, G., Dlu-gokencky, E., Friedlingstein, P., Melillo, J., Pan, S., Poulter, B., Prinn, R., Saunois, M., Schwalm, C. R., and Wofsy, S. C.: The terrestrial biosphere as a net source of greenhouse gases to the atmosphere, Nature, 531, 225–228, 2016.
van Lent, J., Hergoualc’h, K., and Verchot, L. V.: Reviews and
syntheses: Soil N2O and NO emissions from land use and
land-use change in the tropics and subtropics: a meta-analysis, Biogeosciences, 12, 7299–7313, https://doi.org/10.5194/bg-12-7299-2015, 2015.
Vitousek, P. M., Menge, D. N., Reed, S. C., and Cleveland, C. C.: Biological nitrogen fixation: rates, patterns and ecological controls in terrestrial ecosystems, Philos. T. Roy. Soc. B, 368, 20130119, https://doi.org/10.1098/rstb.2013.0119, 2013. Wei, Y., Liu, S., Huntzinger, D. N., Michalak, A. M., Viovy, N.,
Post, W. M., Schwalm, C. R., Schaefer, K., Jacobson, A. R., Lu, C., Tian, H., Ricciuto, D. M., Cook, R. B., Mao, J., and Shi, X.: The North American Carbon Program Multi-scale Syn-thesis and Terrestrial Model Intercomparison Project – Part 2: Environmental driver data, Geosci. Model Dev., 7, 2875–2893, https://doi.org/10.5194/gmd-7-2875-2014, 2014.
Werner, C., Butterbach-Bahl, K., Haas, E., Hickler, T., and Kiese,
R.: A global inventory of N2O emissions from tropical rainforest
soils using a detailed biogeochemical model, Glob. Biogeochem. Cy., 21, GB3010, https://doi.org/10.1029/2006GB002909, 2007. Wrage, N., Velthof, G., Van Beusichem, M., and Oenema, O.: Role of nitrifier denitrification in the production of nitrous oxide, Soil Biol. Biochem., 33, 1723–1732, 2001.
Yang, Q., Tian, H., Friedrichs, M. A., Hopkinson, C. S., Lu, C., and Najjar, R. G.: Increased nitrogen export from eastern North America to the Atlantic Ocean due to climatic and anthro-pogenic changes during 1901–2008, J. Geophys. Res.-Biogeo., 120, 1046–1068, 2015.
Magnitude, spatiotemporal patterns, and environmental controls, Global Biogeochem. Cy., 30, 1246–1263, 2016.
Zhang, B., Tian, H., Lu, C., Dangal, S. R. S., Yang, J., and Pan, S.: Manure nitrogen production and application in cropland and rangeland during 1860–2014: A 5-minute gridded global data set for Earth system modeling, Earth System Science Data Discus-sion, in review, https://doi.org/10.5194/essd-2017-11, 2017.
Zhuang, Q., Lu, Y., and Chen, M.: An inventory of global N2O