www.clim-past.net/12/849/2016/ doi:10.5194/cp-12-849-2016
© Author(s) 2016. CC Attribution 3.0 License.
Sea surface temperature variability in the central-western
Mediterranean Sea during the last 2700 years:
a multi-proxy and multi-record approach
Mercè Cisneros1, Isabel Cacho1, Jaime Frigola1, Miquel Canals1, Pere Masqué2,3,4, Belen Martrat5, Marta Casado5, Joan O. Grimalt5, Leopoldo D. Pena1, Giulia Margaritelli6, and Fabrizio Lirer6
1GRC Geociències Marines, Departament de Dinàmica de la Terra i de l’Oceà, Facultat de Geologia,
Universitat de Barcelona, Barcelona, Spain
2Institut de Ciència i Tecnologia Ambientals & Departament de Física, Universitat Autònoma de Barcelona,
Bellaterra, Spain
3School of Natural Sciences and Centre for Marine Ecosystems Research, Edith Cowan University,
Joondalup, Australia
4Oceans Institute and School of Physics, The University of Western Australia, Crawley, Australia 5Institut de Diagnosi Ambiental i Estudis de l’Aigua (IDAEA), Consell Superior d’Investigacions
Científiques (CSIC), Barcelona, Spain
6Istituto per l’Ambiente Marino Costiero (IAMC)–Consiglio Nazionale delle Ricerche, Calata Porta di Massa,
Interno Porto di Napoli, 80133, Naples, Italy
Correspondence to: Mercè Cisneros ([email protected])
Received: 28 September 2015 – Published in Clim. Past Discuss.: 18 November 2015 Revised: 10 March 2016 – Accepted: 13 March 2016 – Published: 7 April 2016
Abstract.This study presents the reconstructed evolution of sea surface conditions in the central-western Mediterranean Sea during the late Holocene (2700 years) from a set of multi-proxy records as measured on five short sediment cores from two sites north of Minorca (cores MINMC06 and HER-MC-MR3). Sea surface temperatures (SSTs) from alkenones and Globigerina bulloides Mg/Ca ratios are combined with
δ18O measurements in order to reconstruct changes in the regional evaporation–precipitation (E–P) balance. We also revisit the G. bulloides Mg/Ca–SST calibration and re-adjusted it based on a set of core-top measurements from the western Mediterranean Sea. Modern regional oceanographic data indicate that Globigerina bulloides Mg/Ca is mainly controlled by seasonal spring SST conditions, related to the April–May primary productivity bloom in the region. In con-trast, the alkenone–SST signal represents an integration of the annual signal.
The construction of a robust chronological framework in the region allows for the synchronization of the different core sites and the construction of “stacked” proxy records in order
1 Introduction
The Mediterranean is considered one of the most vulnerable regions with regard to the current global warming (Giorgi, 2006). This high sensitivity to climate variability has been evidenced in several studies on past natural changes (Rohling et al., 1998; Cacho et al., 1999a; Moreno et al., 2002; Mar-trat et al., 2004; Reguera, 2004; Frigola et al., 2007; Com-bourieu Nebout et al., 2009). Palaeo-studies focussed mostly on the rapid climate variability in the last glacial period have shown solid evidence of a close connection between changes in North Atlantic oceanography and climate over the western Mediterranean region (Cacho et al., 1999b, 2000, 2001; Moreno et al., 2005; Sierro et al., 2005; Frigola et al., 2008; Fletcher and Sanchez-Goñi, 2008). Nevertheless, cli-mate variability during the Holocene, and particularly during the last millennium, is not so well described in this region, although its understanding is crucial for placing the nature of the 20th century trends in the recent climate history (Huang, 2004).
Some previous studies have already proposed that the Holocene centennial climate variability in the western Mediterranean Sea could be linked to the North Atlantic Os-cillation (NAO) variability (Jalut et al., 1997, 2000; Com-bourieu Nebout et al., 2002; Goy et al., 2003; Roberts et al., 2012; Fletcher et al., 2012). In particular, nine Holocene episodes of enhanced deep water convection in the Gulf of Lion (GoL) and surface cooling conditions have been de-scribed in the region (Frigola et al., 2007). These events have also been correlated to intensified upwelling conditions in the Alboran Sea and tentatively described as two-phase scenar-ios driven by distinctive NAO states (Ausín et al., 2015).
A growing number of studies have revealed considerable climate fluctuations during the last 2 kyr (Abrantes et al., 2005; González-Álvarez et al., 2005; Holzhauser et al., 2005; Kaufman et al., 2009; Lebreiro et al., 2006; Martín-Puertas et al., 2008; Pena et al., 2010; Kobashi et al., 2011; Nieto-Moreno et al., 2011, 2013; Nieto-Moreno et al., 2012; PAGES 2K Consortium, 2013; Esper et al., 2014; McGregor et al., 2015). However, there is no agreement on the exact time span of the different climatic periods defined, such as the Me-dieval Climatic Anomaly (MCA), a term coined originally by Stine (1994).
The existing Mediterranean climatic records for the last 1 or 2 kyr are mostly based on terrestrial archives such as tree rings (Touchan et al., 2005, 2007; Griggs et al., 2007; Es-per et al., 2007; Büntgen et al., 2011; Morellón et al., 2012), speleothem records (Frisia et al., 2003; Mangini et al., 2005; Fleitmann et al., 2009; Martín-Chivelet et al., 2011; Wassen-burg et al., 2013), or lake reconstructions (Pla and Catalan, 2005; Martín-Puertas et al., 2008; Corella et al., 2011; Morel-lón et al., 2012). All of these archives can be good sensors of temperature and humidity changes, but it is often diffi-cult to disentangle the effect of both variables in the proxy records. Recent efforts focussed on integrating these 2 kyr
records into regional climatic signals reveal complex regional responses and evidence the scarcity of marine records to form a more complete picture (PAGES, 2009; Lionello, 2012).
Marine records are often limited by the lack of aquate time resolution and/or robust chronologies for de-tailed comparison with terrestrial records. However, marine records provide a wider range of temperature-sensitive prox-ies. There are few marine palaeoclimate records available for the last 2 kyr in the Mediterranean Sea (Schilman et al., 2001; Versteegh et al., 2007; Piva et al., 2008; Taricco et al., 2009, 2015; Incarbona et al., 2010; Fanget et al., 2013; Grauel et al., 2013; Lirer et al., 2013, 2014; Di Bella et al., 2014; Goudeau et al., 2015) and they are even more scarce in the western basin. Unfortunately, the existing pool of marine proxy data in the Mediterranean for the last two millennia is too sparse to recognize common patterns of climate variability (Taricco et al., 2009; Nieto-Moreno et al., 2011; Moreno et al., 2012, and references therein).
The aim of the present study is to characterize changes in surface water properties from the Minorca margin in the Catalan–Balearic Sea (central-western Mediterranean) in or-der to contribute to a better unor-derstanding of the climate variations in this region during the last 2.7 kyr. Sea sur-face temperature (SST) has been reconstructed by means of two independent proxies, Mg/Ca analyses on the planktonic foraminifera Globigerina bulloides and alkenone-derived SST (Villanueva et al., 1997; Lea et al., 1999; Barker et al., 2005; Conte et al., 2006). The application of G. bulloides Mg/Ca as a palaeothermometer in the western Mediter-ranean Sea is tested through the analysis of a series of core-top samples from different locations of the western Mediterranean Sea and the calibration reviewed consistently. Mg/Ca thermometry is applied in conjunction with δ18O in order to evaluate changes in the evaporation–precipitation (E–P) balance of the basin, which are ultimately linked to salinity (Lea et al., 1999; Pierre, 1999; Barker et al., 2005).
One of the intrinsic limitations of studying the climate evo-lution of the last 2 kyr is that the magnitude of climatic os-cillations is often below the sensitivity of the selected prox-ies. In order to overcome this limitation we have produced “stack” proxy records from multicores in the same region. The stack record captures the first-order climatic variability from the proxy records and removes the noise, therefore al-lowing for a more robust identification of regional climatic variability.
6° E
5° E 5° E
4° E 4° E
3° E 3° E
2° E 2° E
1° E 1° E
0° 0°
1° W 1° W
38
° N
0 50 100 200 km
l
MR3 MIN Pyrenees
Balearic Promontory
0
-29
00
Depth (m) 39°
N
40
°
N
41° N
42
°
N
43
° N
38
°
N
39
°
N
40
°
N
41
°
N
42
°
N
43
° N
Cores MR3 & MIN (this study)
Cores used for Mg/Ca-SST calibration (Table 1)
Cores C90–1 m, C90 & C386 used in age models
20° E 20° E
15° E 15° E
10° E 10° E
5° E 5° E
0° 0°
5° W 5° W
45
° N
45
° N
42
° N
42
° N
39
° N
39
° N
36
° N
36
° N
OceanAtlantic Western Mediterranean Basin
(a) (b)
Strait of Gibraltar WMDW
Catalan-Balearic Sea
Gulf of Lion
WMDW NC
NC
Figure 1.Location of the studied area. (a) Central-western Mediterranean Sea: cores MIN and MR3 (red dots). NC: Northern Current
(surface). WMDW: Western Mediterranean Deep Water. (b) Cores used in age model development from the Tyrrhenian Sea (green triangles;
Lirer et al., 2013) and cores used in Mg/Ca–SST calibration from the western Mediterranean Basin (blue squares).
events in Minorca and to the classic climatic ones defined in the literature (i.e. Nieto-Moreno et al., 2011, 2013; Moreno et al., 2012; Lirer et al., 2013, 2014).
2 Climatic and oceanographic settings
The Mediterranean Sea is a semi-enclosed basin located in a transitional zone between different climate regimes, from the temperate zone in the north to the subtropical zone in the south. Consequently, the Mediterranean climate is char-acterized by mild wet winters and warm to hot, dry sum-mers (Lionello et al., 2006). Interannual climate variability is very much controlled by the dipole-like pressure gradient between the Azores (high) and Iceland (low) system, known as the North Atlantic Oscillation (NAO; Hurrell, 1995; Li-onello and Sanna, 2005; Mariotti, 2011; Ausín et al., 2015). However, the northern part of the Mediterranean region is also linked to other mid-latitude teleconnection patterns (Li-onello, 2012).
The Mediterranean Sea is a concentration basin (Béthoux, 1980; Lacombe et al., 1981) and the excess of evaporation with respect to freshwater input is balanced by water ex-change at the Strait of Gibraltar (i.e. Pinardi and Masetti, 2000; Malanotte-Rizzoli et al., 2014). The basin-wide cir-culation pattern is predominantly cyclonic (Millot, 1999). Three convection cells promote the Mediterranean deep and intermediate circulation: a basin-wide open cell and two sep-arated closed cells, one for the western part of the basin and one for the eastern part. The first one connects the two basins of the Mediterranean Sea though the Strait of Sicily, where
water masses interchange occurs at intermediate depths. This cell is associated with the inflow of Atlantic Water (AW) at the Strait of Gibraltar and the outflow of the Levantine Inter-mediate Water (LIW) that flows below the first (Lionello et al., 2006).
In the north-western Mediterranean Sea, the Northern Cur-rent (NC) represents the main feature of the surface cir-culation transporting waters alongshore from the Ligurian Sea to the Alboran Sea (Fig. 1a). North-east of the Balearic Promontory a surface oceanographic front separates Mediter-ranean waters transported by the NC from the Atlantic waters that recently entered the Mediterranean (Millot, 1999; Pinot et al., 2002; André et al., 2005).
Deep convection occurs offshore of the GoL due to the action of persistent cold and dry winter winds such as the tramontana and the mistral. These winds cause strong evap-oration and cooling of surface water, thus increasing their density, sinking to greater depths and leading to Western Mediterranean Deep Water formation (WMDW; MEDOC, 1970; Lacombe et al., 1985; Millot, 1999). Dense shelf wa-ter cascading (DSWC) in the GoL also contributes to the sink of large volumes of water and sediments into the deep basin (Canals et al., 2006).
increases until maximum SST values during August. After-wards, a SST drop can be observed in October, although with some interannual variability (Pastor, 2012).
3 Material and methods
3.1 Sediment core description
The studied sediment cores were recovered from a sedi-ment drift built by the action of the southward branch of the WMDW north of Minorca (Fig. 1). Previous studies car-ried out at this site have already described high sedimenta-tion rates (> 20 cm kyr−1; Frigola et al., 2007, 2008; Moreno et al., 2012), suggesting that this location was suitable for a detailed study of the last millennia. The cores were recov-ered with a multicore system in two different stations lo-cated at about 50 km north of Minorca. Cores MINMC06-1 and MINMC06-2 (henceforth MINMINMC06-1 and MIN2; 40◦290N, 04◦010E; 2391 m water depth; 31 and 32.5 cm core length, respectively) were retrieved in 2006 during the HERMES 3 cruise onboard the R/V Thethys II. The recovery of cores HER-MC-MR3.1, HER-MC-MR3.2, and HER-MC-MR3.3 (henceforth MR3.1, MR3.2, and MR3.3; 40◦290N, 3◦370E; 2117 m water depth; 27, 18, and 27 cm core length, respec-tively) took place in 2009 during the HERMESIONE expe-dition onboard the R/V Hespérides. The distance between MIN and MR3 cores is∼30 km and both stations are located at an intermediate position within the sediment drift, which extends along a water depth range from 2000 to 2700 m (Frigola, 2012; Velasco et al., 1996; Mauffret, 1979). The MIN cores are from sites that are about 300 m deeper than the MR3 ones.
MIN cores were homogeneously sampled at 0.5 cm reso-lution in the laboratory. In the MR3 cores a different strat-egy was followed. MR3.1 and MR3.2 were initially subsam-pled with a PVC tube and split into two halves for X-ray fluorescence (XRF) analyses in the laboratory. Both halves of core MR3.1 (MR3.1A and MR3.1B) were used for the present work as replicates of the same core, and records for each half are shown separately. All MR3 cores were sam-pled at 0.5 cm resolution in the upper 15 cm and at 1 cm in the deeper sections, with the exception of MR3.1B that was sampled at 0.25 cm resolution. The MR3 cores were com-posed of brown–orange nannofossil and foraminifera silty clay, which was lightly bioturbated and contained layers en-riched in pteropods and fragments of gastropods as well as some dark layers.
Additionally, core-top samples from seven multicores col-lected at different locations in the western Mediterranean have also been used for the correction of the Mg/Ca–SST calibration from G. bulloides (Table 1; Fig. 1).
3.2 Radiocarbon analyses
Twelve 14C AMS dates were measured in cores MIN1, MIN2, and MR3.3 (Supplement Table S1) using 4–22 mg samples of the planktonic foraminifer Globorotalia inflata handpicked from the > 355 µm fraction. The ages were cali-brated with the standard marine correction of 408 years and the regional average marine reservoir correction (1R) for the central-western Mediterranean Sea using Calib 7.0 software (Stuiver and Reimer, 1993) and the MARINE13 calibration curve (Reimer et al., 2013).
3.3 Radionuclides210Pb and137Cs
The concentrations of the naturally occurring radionuclide
210Pb (Supplement Fig. S1) were determined in cores
MIN1, MIN2, MR3.1A, and MR3.2 by alpha spectroscopy (Sanchez-Cabeza et al., 1998). The concentrations of the an-thropogenic radionuclide137Cs in core MIN1 (Fig. S1) were measured by gamma spectrometry using a high-purity intrin-sic germanium detector. The226Ra concentrations were de-termined from the gamma emissions of214Pb that were also used to calculate the excess210Pb concentrations. The sed-iment accumulation rates for the last century (Sect. S1.1 in the Supplement) were calculated using the CIC (constant ini-tial concentration) and the CF : CS (constant flux : constant sedimentation) models (Appleby and Oldfield, 1992; Krish-naswami et al., 1971), constrained by the137Cs concentration profile in core MIN1 (Masqué et al., 2003).
3.4 Bulk geochemical analyses
The elemental composition of cores MR3.1B and MR3.2 was obtained with an Avaatech XRF core-scanner system (CORELAB, University of Barcelona), which is equipped with an optical variable system that allows determining the length (10–0.1 mm) and the extent (15–2 mm) of the bun-dle of X-rays in an independent way. This method allows obtaining qualitative information of the elementary compo-sition of the core materials. The core surfaces were scraped, cleaned, and covered with a 4 µm thin SPEXCertiPrep Ultra-lene foil to prevent contamination and minimize desiccation (Richter and van der Gaast, 2006). Sampling was performed every 1 cm and scanning took place at the split core surface directly. Among the several elements measured in this study, the Mn profile was used for the construction of the age mod-els (see Supplement for age model development).
3.5 Planktonic foraminiferal analyses
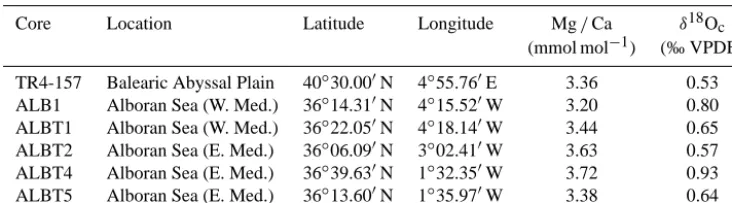
Table 1.Core tops included in the calibration’s adjustment.δ18Ocand Mg/Ca have been obtained from G. bulloides (Mg/Ca procedure
has been performed without reductive step).
Core Location Latitude Longitude Mg/Ca δ18Oc
(mmol mol−1) (‰ VPDB)
TR4-157 Balearic Abyssal Plain 40◦30.000N 4◦55.760E 3.36 0.53
ALB1 Alboran Sea (W. Med.) 36◦14.310N 4◦15.520W 3.20 0.80
ALBT1 Alboran Sea (W. Med.) 36◦22.050N 4◦18.140W 3.44 0.65
ALBT2 Alboran Sea (E. Med.) 36◦06.090N 3◦02.410W 3.63 0.57
ALBT4 Alboran Sea (E. Med.) 36◦39.630N 1◦32.350W 3.72 0.93
ALBT5 Alboran Sea (E. Med.) 36◦13.600N 1◦35.970W 3.38 0.64
(sampling every 0.25 cm). Additionally, quantitative analy-sis of planktonic foraminiferal assemblages was carried out in core MR3.3 and on the upper part of core MR3.1A by using the fraction size above 125 µm (Fig. S2). The 42 stud-ied samples showed abundant and well-preserved planktonic foraminifera.
The samples for trace elements analyses consisted of∼45 specimens of G. bulloides that were crushed under glass slides to open the chambers. Foraminifera cleaning consisted of clay removal and oxidative and weak acid leaching steps (Pena et al., 2005). Samples from core MR3.1A were also cleaned including the “reductive step”. Elemental ratios were measured on an inductively coupled plasma mass spectrome-ter (ICP-MS, Perkin Elmer ELAN 6000) in the Scientific and Technological Centers of the University of Barcelona (CCiT-UB). A standard solution with known elemental ratios was used for sample standard bracketing (SSB) as a correction for instrumental drift. The average reproducibility of Mg/Ca ratios, taking into account the known standard solutions con-centrations, was 97 and 89 % for MIN1 and MIN2 cores, and 99 and 97 % for cores MR3.1A, MR3.1B, and MR3.3, re-spectively.
Procedural blanks were routinely measured to detect any potential contamination problem during cleaning and disso-lution. The Mn/Ca and Al/Ca ratios were also always mea-sured to identify potential contaminations due to the presence of manganese oxides and/or aluminosilicates (Barker et al., 2003; Lea et al., 2005; Pena et al., 2005, 2008).
To avoid the overestimation of Mg/Ca–SST by diage-netic contamination, Mn/Ca values > 0.5 mmol mol−1were discarded from core MR3.1B and only those higher than 1 mmol mol−1were removed from MIN1 and MR3.3. Sam-ples suspected to have detrital contamination with elevated Al/Ca ratios were also removed. No significant correlation exists between Mg/Ca and Mn/Ca or Al/Ca ratios after data filtering (r< 0.29,pvalue=0.06).
The Mg/Ca ratios were transferred into SST values us-ing the calibration proposed in the present study (Sect. 5.1). In the case of the MR3.1A record, which was cleaned us-ing the reductive procedure, and as was expected (Barker et al., 2003; Pena et al., 2005; Yu et al., 2007), the Mg/Ca
ratios were about 23 % lower than those measured in core MR3.1B without the reductive step. The obtained percent-age of Mg/Ca lowering is comparable to or higher than those percentages previously estimated for different plank-tonic foraminifera, although data from G. bulloides have not been previously reported (Barker et al., 2003). Mg/Ca–SST in core MR3.1A was calculated after the Mg/Ca correction of this 23 % offset by application of the calibration used with the other records.
Stable isotope measurements were performed by means of sonication on 10 specimens of G. bulloides after methanol cleaning to remove fine-grained particles. The analyses were performed in a Finnigan MAT 252 mass spectrometer fit-ted with a Kiel-IV carbonate microsampler in the CCiT-UB. The analytical precision of laboratory standards forδ18O was better than 0.08 ‰. Calibration to Vienna Pee Dee Belem-nite (VPDB) was carried out by means of NBS-19 standards (Coplen, 1996).
Seawaterδ18O (δ18Osw) was obtained after removing the
temperature effect on the G. bulloides δ18O signal using the Mg/Ca–SST records of the Shackleton palaeotemper-ature equation (Shackleton, 1974). The results are expressed in the SMOW (Standard Mean Ocean Water) water stan-dard (δ18Osw) after the correction of Craig (1965). The use
of specific temperature equations for G. bulloides was also considered (Bemis et al., 1998; Mulitza et al., 2003), but the core-top estimates providedδ18Oswvalues of 2.1–1.5 ‰
SMOW, which were significantly higher than those measured in water samples from the central-western Mediterranean Sea (∼1.2 ‰ SMOW) (Pierre, 1999). After application of the empirical Shackleton (1974) palaeotemperature equation, the core-topδ18Oswestimates averaged 1.1 ‰ SMOW and were
closer to the actual seawater measurements. This, it was de-cided that this equation provided more realistic oceanograph-ical conditions in this location.
3.6 Alkenones
Measurements of the relative proportion of unsaturated C37
in-formation about the methodology and equipment used can be found in Villanueva et al. (1997). The precision of this palaeothermometry tool has been determined to be about ±0.5◦C (Eglinton et al., 2001). Furthermore, taking into ac-count duplicate alkenone analysis carried out on core MR3.3, the precision achieved results better than±0.8◦C. The recon-struction of SST records was based on the global calibration of Conte et al. (2006), which considers an estimation stan-dard error of 1.1◦C in surface sediments.
4 Age model development
Obtaining accurate chronologies for each of the studied sed-iment cores is particularly critical to allow intercomparison and produce a stack record that represents the regional cli-matic signal. With this objective, a wide set of parameters have been combined in order to obtain chronological mark-ers in all the studied sedimentary records, including absolute dates and stratigraphical markers based on both geochemi-cal and micro-palaeontologigeochemi-cal data (Tables S2 and S4). The methodology of age model development is explained in de-tail in the Supplement.
5 Sea surface temperatures andδ18O data
5.1 Mg/Ca–SST calibration
The Mg/Ca ratio measured in G. bulloides is a widely used proxy to reconstruct SST (Barker et al., 2005), although the calibrations available can provide very different results (Lea et al., 1999; Mashiotta et al., 1999; Elderfield and Ganssen, 2000; Anand et al., 2003; McConnell and Thunell, 2005; Cléroux et al., 2008; Thornalley et al., 2009; Patton et al., 2011). Apparently, the regional Mg/Ca–temperature re-sponse varies due to parameters that have not yet been iden-tified (Patton et al., 2011). A further difficulty arises from the questioned Mg/Ca thermal signal in high-salinity re-gions such as the Mediterranean Sea, where anomalously high Mg/Ca values have been observed (Ferguson et al., 2008). This apparent high salinity sensitivity in foraminiferal Mg/Ca ratios is under discussion and has not been sup-ported by recent culture experiments (Hönisch et al., 2013), which, in addition, could be attributed to diagenetic over-prints (Hoogakker et al., 2009; van Raden et al., 2011). In or-der to test the value of the Mg/Ca ratios in G. bulloides from the western Mediterranean Sea and also review its signifi-cance in terms of seasonality and depth habitat, a set of core-top samples from different locations of the western Mediter-ranean Sea have been analysed. Cotop samples were re-covered using a multicorer system, and they can be con-sidered representative of present conditions (Masqué et al., 2003; Cacho et al., 2006). The studied cores are located in the 35–45◦N latitude range (Table 1 and Fig. 1) and mostly represent two different trophic regimes, defined by the
clas-18O
c t
em
pe
ra
tu
re
ѝ
Temperature (ºC)
Depth (m)
April
May
200 160 120 80 40
012 14 16 18 20
(b)
8 1218 16 20
Oc temperature (ºC)
0 1 2 3 4 5
M
g/
C
a
(m
m
ol
m
ol
-1)
Mediterranean Atlantic
δ
(a)
Mg/Ca=(0.704±0.071) exp (0.094±0.0067) T R 2 =0.92
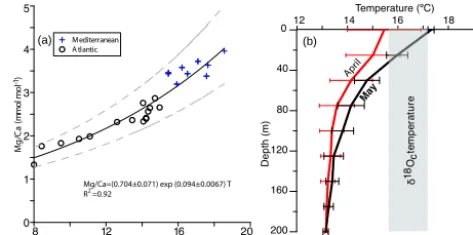
Figure 2.(a) Exponential function and correlation betweenδ18Oc
temperatures and Mg/Ca. Dashed lines show the 1σ confidence
limits of the curve fit. The standard error of our temperature
cali-bration taking into account eachδ18Octemperature from core tops
(Table 1) is±0.6◦C. Error of temperature estimates based on our
G. bulloides calibration for the western Mediterranean is±1.4◦C.
These uncertainties are higher but still in the range of±0.6◦C
ob-tained for the Atlantic Ocean in Elderfield and Ganssen (2000) and
also 1.1◦C in G. bulloides culture data (Lea et al., 1999). (b) April
(red) and May (black) temperature profiles of the first 200 m mea-sured during years 1945–2000 in stations corresponding to the
stud-ied core tops (MEDAR GROUP, 2002). Theδ18Ocaverage
temper-ature of all cores is shown (grey, vertical band).
sical spring bloom (the most north-western basin) and an in-termittent bloom (D’Ortenzio and Ribera, 2009).
The resulting Mg/Ca ratios have been compared with the isotopically derived calcification temperatures based on the
δ18O measurements performed also in G. bulloides from the same samples. This comparison was performed after use of the Shackleton (1974) palaeotemperature equation and the
δ18Owaterdata published by Pierre (1999), always
consider-ing the values of the closer stations and the top 100 m. The resulting Mg/Ca–SST data have been plotted together with those of G. bulloides from North Atlantic core tops previ-ously published by Elderfield and Ganssen (2000). The re-sulting high correlation (r2=0.92; Fig. 2a) strongly supports that the Mg/Ca ratios of the central-western Mediterranean Sea are dominated by a thermal signal. Thus, the new data set from the Mediterranean core tops improves temperature sensitivity range over the warm end of the calibration. The resulting exponential function indicates∼9.4 % Mg/Ca per ◦C sensitivity in the Mg uptake with respect to temperature,
which is in agreement with the range described in the litera-ture (i.e., Elderfield and Ganssen, 2000; Barker et al., 2005; Patton et al., 2011). The new equation for the Mg/Ca–SST calibration including data from the western Mediterranean Sea and the Atlantic Ocean is as follows:
Mg/Ca=0.7045(±0.0710)e0.0939(±0.0066)T. (1)
Al-though significant regional and interannual variations have been observed, the obtained calcification temperatures of our core-top samples show the best agreement with temperature values of the upper 40 m during the spring months (April– May; Fig. 2b). This water depth is consistent with preferen-tial depth ranges for G. bulloides found by plankton tows in the Mediterranean (Pujol and Vergnaud-Grazzini, 1995) and with results from multiannual sediment trap monitoring in the Alboran Sea and the GoL, where maximum G. bulloides percentages were observed just before the beginning of ther-mal stratifications (see Bárcena et al., 2004; Bosc et al., 2004; Rigual-Hernández et al., 2012). Although the information available about depth and seasonality distribution of G.
bul-loides is relatively fragmented, this species is generally found
in intermediate or even shallow waters (i.e. Bé and Hut-son, 197; Ganssen and Kroon, 2000; Schiebel et al., 2002; Rogerson et al., 2004; Thornalley et al., 2009). However, G.
bulloides has also been observed at deeper depths in some
western Mediterranean Sea sub-basins (Pujol and Vergnaud-Grazzini, 1995). Extended data with enhanced spatial and seasonal coverage are required in order to better character-ize production, seasonality, and geographic and distribution patterns of live foraminifera such as G. bulloides. Neverthe-less, the obtained core-top data set offers solid evidence on the seasonal character of the recorded temperature signal in the Mg/Ca ratio.
5.2 A regional stack for Mg/Ca–SST records
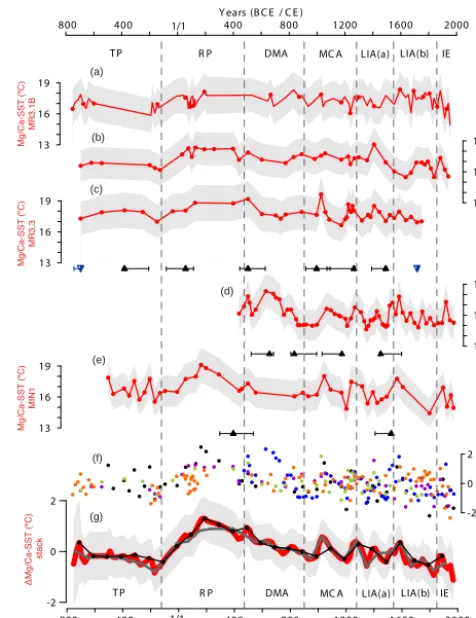
The Mg/Ca–SST profiles obtained from our sediment records are plotted with the resulting common age model in Fig. 3. The average SST values for the last 2700 years ranged from 16.0±0.9 to 17.8±0.8◦C (uncertainties of average values represent 1σ; uncertainties of absolute values include analytical precision and reproducibility and also those de-rived from the Mg/Ca–SST calibration). SST records show the warmest sustained period during the RP, approximately between 170 BCE and 300 CE, except in core MIN2, since this record ends at the RP–DMA transition. In addition, all the records show a generally consistent cooling trend after the RP with several centennial-scale oscillations. The maxi-mum SST value is observed in core MR3.3 (19.6±1.8◦C) during the MCA (Fig. 3c) and the minimum is recorded in core MIN1 (14.4±1.4◦C) during the LIA (Fig. 3e). Centennial-scale variability is predominant throughout the records. Particularly, during MCA some warm episodes reached slightly higher SST than the averaged SST maxi-mum (i.e. 19.6±1.8◦C at ∼1021 CE). These events were far shorter in duration compared to the RP (Fig. 3). The highest frequency of intense cold events occurred during the LIA and, in particular, the last millennium recorded the min-imum average Mg/Ca–SST (15.2±0.8◦C). Four of the five records show a pronounced SST drop after 1275 CE, coin-ciding with the onset of the LIA. Based on the different Mg/Ca–SST patterns, the LIA period has been divided into
800 400 400 800 1200 1600 2000
Y ears (B C E / C E ) 13
16 19
13 16 19 13
16
19 13
16 19 13
16 19
-2 0 2
-2 0 2
TP R P DMA MC A LIA(a) LIA(b) IE
800 400 1/1 Y ears (B C E / C E )400 800 1200 1600 2000
TP R P DMA MC A LIA(a) LIA(b) IE
1/1
ΔMg/Ca-SST
(ºC)
Mg/Ca-SST
(ºC)
MIN2
Mg/Ca-SST
(ºC)
MR3.1A
Mg/Ca-SST
(ºC)
MR3.1B
Mg/Ca-SST
(ºC)
MR3.3
Mg/Ca-SST
(ºC)
MIN1
ΔMg/Ca-SST
(ºC)
stack
(a)
(b)
(c)
(d)
(e)
(f)
(g)
Figure 3. SST obtained from Mg/Ca for cores: (a) MR3.1B,
(b) MR3.1A, (c) MR3.3, (d) MIN2, and (e) MIN1. The grey shaded areas integrate uncertainties of average values and
rep-resent 1σ of the absolute values. This uncertainty includes
an-alytical precision and reproducibility and the uncertainties de-rived from the G. bulloides core-top calibrations for the central-western Mediterranean Sea developed in this paper. (f) All indi-vidual SST anomalies on their respective time step (MR3.1B: or-ange; MR3.1A: purple; MR3.3: green; MIN2: blue; MIN1: black
dots). (g) 20 yr cm−1stacked temperature anomaly (red plot) with
its 2σ uncertainty (grey band). The 80 yr cm−1(grey plot) and the
100 yr cm−1(black plot) stacks are also shown. The triangles
repre-sent14C dates (black) and biostratigraphical dates based on
plank-tonic foraminifera (blue) and are shown below the corresponding
core, including their associated 2σerrors.
800 400 400 800 1200 1600 2000 Y ears (B C E /C E )
1.5 1
1.5 1
1.5 1
1.5 1 1.5 1
0.1 0 -0.1
0.5 0 -0.5 2.5 2 1.5 1 2.5 2 1.5 1 2.5 2 1.5 1 2.5 2 1.5 1 2.5 2 1.5 1
0.4 0 -0.4
TP R P DMA MC A LIA(a) LIA(b) IE
TP R P DMA MC A LIA(a) LIA(b) IE
800 400 1/1 400Y ears (B C E /C E )800 1200 1600 2000
1/1
Δδ O
stack
18
sw
δ O
18
sw MIN2
δ O 18
sw MIN1
δ O 18
sw MR3.3
δ O 18
sw MR3.1A
δ O 18
sw MR3.1B
δ O MR3.1B
18
c
δ O MR3.1A
18
c
δ O MR3.3
18
c
δ O MIN1
18
c
δ O MIN1
18
c
Δ
δ O 18
c
Δδ O stack
18
c
(a)
(b)
(c)
(d)
(e)
(f)
(g)
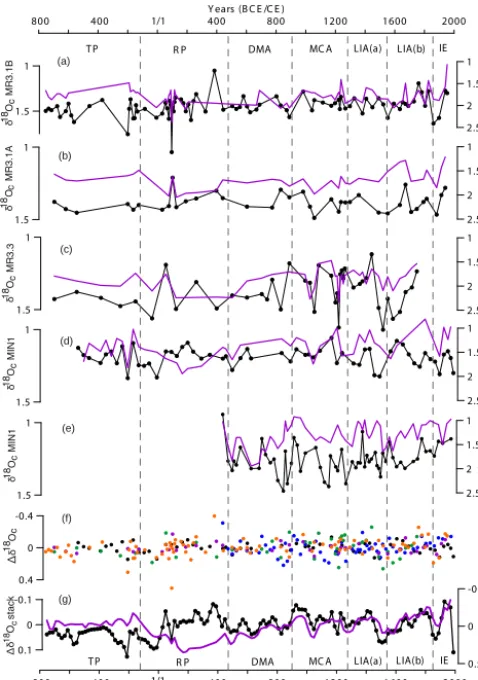
Figure 4.Oxygen isotope measured on carbonate shells of G.
bul-loides (δ18Oc‰ VPDB, in black) and their derivedδ18Osw
(pur-ple) for cores: (a) MR3.1B, (b) MR3.1A, (c) MR3.3, (d) MIN2, and
(e) MIN1. (f) Individualδ18Oc(‰ VPDB) anomalies on their
re-spective time step. (g)δ18Ocandδ18Oswanomaly stacked records
(‰ VPDB and ‰ SMOW, respectively).
records were interpolated. Interpolation at three different res-olutions did not result in significant differences (Fig. 3g). Subsequently, we selected the stack that provided the best resolution offered by our age models (20 yr cm−1) since it very well preserves the high-frequency variability of the indi-vidual records (Fig. 3g). The obtained SST anomaly stack al-lows for a better identification of the most significant features at centennial timescales. Abrupt cooling events are mainly recorded during the LIA (−0.5 to−0.7◦C 100 yr−1), while
abrupt warmings (0.9 to 0.6◦C 100 yr−1) are detected
dur-ing the MCA. Events of similar magnitude have been also documented during the LIA–IE transition. When consider-ing the entire SST anomaly record, a long-term coolconsider-ing trend of about −1 to−2◦C is observed. However, focussing on the last 1800 years, since the RP maxima, the observed cool-ing trend was far more intense, at about −3.1 to −3.5◦C (−0.3 to −0.8◦C kyr−1). This is consistent within the re-cent 2 kyr global reconstruction published by McGregor et
al. (2015; estimation of the SST cooling trend, using the av-erage anomaly method 1 for the period 1–2000 CE:−0.3 to −0.4◦C kyr−1).
5.3 Oxygen isotope records
The oxygen isotopes measured on carbonate shells of G.
bulloides (δ18Oc) and their derived δ18Osw after removing
the temperature effect with the Mg/Ca–SST signals (see Sect. 3.5) are shown in Fig. 4.δ18Ocand their derivedδ18Osw
profiles have been respectively stacked following the same procedure for the Mg/Ca–SST stack (Sect. 5.2). In general terms, all the records present a highly stable pattern during the whole period with a weak depleting trend, which is al-most undetectable in some cases (i.e. core MIN1).
The averageδ18Ocvalues range from 1.2 to 1.4 ‰ VPDB
and, in general, the MR3 cores show slightly higher values (∼1.4 ‰ VPDB) than the MIN cores (∼1.2 ‰ VPDB). The lowestδ18Ocvalues (1.0 to 1.2 ‰ VPDB) mostly occur
dur-ing the RP, although some short, low excursions can also be observed during the end of the MCA and/or the LIA. The highest values (1.4 to 1.8 ‰ VPDB) are mainly associated with short events during the LIA, the MCA, and over the TP–RP transition. A significant increase inδ18Oc values is
observed at the LIA–IE transition, although a sudden drop is recorded at the end of the stack record (after 1867 CE), which could result from a differential influence of the records (i.e. MIN1) and/or an extreme artefact (Fig. 4g).
After removing the temperature effect from the δ18Oc
record, the remainingδ18Oswrecord mainly reflects changes
in E–P balance, thus resulting in an indirect proxy of sea surface salinity. The averageδ18Oswvalues obtained for the
period studied ranged from 1.3 to 1.8 ‰ SMOW. The high-estδ18Oswvalues (from 2.4 to 1.9 ‰ SMOW) are recorded
during the RP, when the longest warm period is also ob-served, and some values are notable during the MCA too. Enhancements of the E–P balance (δ18Oswhigher values)
co-incide with higher SST. The lowestδ18Oswvalues (from 0.8
to 1.5 ‰ SMOW) are recorded particularly during the onset and the end of the LIA and also during the MCA. A drop in theE−P balance has been obtained from approximately the end of LIA to the most recent years. The most significant changes in ourδ18Oswstack record correspond to increases
in the most recent times and around 1200 CE (MCA) and to the decrease observed at the end of the LIA (Fig. 4).
5.4 Alkenone–SST records
16 18
16 18 16
18
-1 0 1
-1 0 1
TP RP DMA MCA LIA(a) LIA(b) IE
800 400 1/1 400 800 1200 1600 2000
Years (BCE / CE)
800 400 1/1 400 800 1200 1600 2000
TP RP DMA MCA LIA(a) LIA(b) IE
Alk-SST
(ºC) MR3.3
Years (BCE / CE)
(a)
(b)
(c)
(d)
(e)
Alk-SST
(ºC) MIN1
∆Alk-SST
(ºC)
stack
Alk-SST
(ºC) MIN2
∆Alk-SST
(ºC)
Figure 5.Alkenone temperature records from Minorca (this study)
for cores (a) MR3.3, (b) MIN2, and (c) MIN1. Triangles
repre-sent14C dates (black) and biostratigraphical dates based on
plank-tonic foraminifera (blue) and are shown below the
correspond-ing core with their associated 2σ errors. (d) Individual
alkenone-derived SST anomalies in their respective time step (MR3.3: green;
MIN2: blue; MIN1: black dots). (e) 20 yr cm−1 stacked
temper-ature anomaly (orange plot). The 80 yr cm−1 (grey plot) and the
100 yr cm−1(black plot) stacks are also shown.
and about −1.7◦C since the SST maximum recorded dur-ing the RP. The mean SST uncertainties in this section have been estimated as±1.1◦C, taking into account the estimated standard error (see Sect. 3.6).
Previous studies have interpreted the alkenone–SST signal in the western Mediterranean Sea as an annual average (Ter-nois et al., 1996; Cacho et al., 1999a, b; Martrat et al., 2004). The average alkenone–SST values for the studied period (last 2700 years) ranged from 17.0 to 17.4◦C.
The coldest alkenone temperatures (∼16.0◦C) have been obtained in core MIN2 during the LIAa and the warmest (∼18.4◦C) in core MR3.3 during the MCA. Values near the average of maxima SST (from 17.9 to 18.4◦C) are observed more frequently during the TP, RP, and MCA, while temper-atures during the onset of MCA and LIA show many values closer to the average of minima SST (ranging from 16.0 to 16.2◦C). Abrupt coolings are observed during the LIA and some events during MCA (−0.8◦C 100 yr−1) and to a lesser extent during the LIA–IE transition (−0.5◦C 100 yr−1). The highest warming rates are recorded during the MCA (0.4◦C 100 yr1) and also during the RP.
5.5 Mg/Ca–SST vs. alkenone–SST records
In this section, the uncertainties of the alkenone, 1.1◦C, have been calculated from the estimated standard error of the calibration (see Sect. 3.6) and those of Mg/Ca–SST include the analytical precision and reproducibility and the standard error of the calibration. The measured Mg/Ca– SST and alkenone–SST averages are identical within er-ror (16.9±1.4◦C vs. 17.2±1.1◦C), but the temperature range of the Mg/Ca records shows higher amplitude (see Sects. 5.2 and 5.4).
The similarity in SST averages of both proxies does not reflect the different habitat depths, since alkenones should mirror the surface photic layer (< 50 m), with relatively warm SST, while G. bulloides has the capability to de-velop in a wider and deeper environment (Bé, 1977; Pujol and Vergnaud-Grazzini, 1995; Ternois et al., 1996; Sicre et al., 1999; Ganssen and Kroon, 2000; Schiebel et al., 2002; Rogerson et al., 2004; Thornalley et al., 2009), where lower SST would be expected.
The enhanced Mg/Ca–SST variability is reflected in the short-term oscillations, at centennial timescales, which are larger in the Mg/Ca record with oscillations over 0.5◦C. This larger Mg/Ca–SST variability could be attributed to the highly restricted seasonal character of the signal, which purely reflects SST changes during the spring season. How-ever, the coccolith signal integrates a wider time period from autumn to spring (Rigual-Hernández et al., 2012, 2013) and, consequently, changes associated with specific seasons be-come more diluted in the resulting averaged signal.
The annual mean SST corresponding to a Balearic site is 18.7±1.1◦C, according to the integrated values of the upper 50 m (Ternois et al., 1996; Cacho et al., 1999a) of the GCC-IEO database between January 1994 and July 2008. Our core-top records represent the last decades and show SST values closer to the annual mean in the case of alkenone– SST, whereas the Mg/Ca–SST record shows slightly lower values.
fluxes have already started to decrease (Rigual-Hernández et al., 2012, 2013). This different growth season can explain the proxy bias in the SST reconstructions, with more smoothed alkenone–SST signals.
Both Mg/Ca–SST and Uk370–SST records show consis-tent cooling trends of about −0.5◦C kyr−1during the stud-ied period (2700 years), which is consistent with the re-cent 2 kyr global reconstruction (McGregor et al., 2015; see Sect. 5.2). The recorded cooling since the RP SST maxima (∼200 CE) is more pronounced in the Mg/Ca– SST (−1.7 to −2.0◦C kyr−1) than in the alkenone signal (−1.1◦C kyr−1). These coolings are larger than those
esti-mated in the global reconstruction (McGregor et al., 2015) for the last 1200 years (average anomaly method 1:−0.4 to −0.5◦C kyr−1). It should be noted that the global reconstruc-tion includes alkenone–SST from MIN cores (data published in Moreno et al., 2012).
The detailed comparison of the centennial SST variability recorded by both proxy stacks consistently indicates a puz-zling antiphase (Fig. 6b and c). Although the main trends are consistently parallel in both alkenone and Mg/Ca proxies (r=0.5; p value=0) as observed in other regions, short-term variability appears to have an opposite character. Sta-tistical analysis of these differences examined by means of Welch’s test indicates that the null hypothesis (means are equal) can be discarded at the 5 % error level: tobserved
(12.446) >tcritical(1.971). This a priori unexpected proxy
dif-ference outlines the relevance of the seasonal variability for climate evolution and suggests that extreme winter coolings were followed by more rapid and intense spring warmings. Nevertheless, regarding the low amplitude of several of these oscillations, often close to the proxy error, this observation needs to be supported by further constraints as a solid re-gional feature.
6 Discussion
6.1 Climate patterns during the last 2.7 kyr
The SST changes in the Minorca region have implications for the surface air mass temperature and moisture source regions that could influence on air mass trajectories and ultimately precipitation patterns in the western Mediterranean region (Millán et al., 2005; Labuhn et al., 2015). Recent observa-tions have identified SST as a key factor in the development of torrential rain events in the western Mediterranean Basin (Pastor et al., 2001), constituting a potential source of mass instability that transits over these waters (Pastor, 2012). In this context, the combined SST andδ18Oswrecords can
pro-vide information on the connection between thermal changes and moisture export from the central-western Mediterranean Sea during the last 2.7 kyr.
The oldest period recorded in our data is the so-called Ta-laiotic Period (TP), which corresponds to the ages of an-tiquity such as the period of ancient Greece in other
geo-800 400 400 800 1200 1600 2000
Y ears (B C E / C E )
-2 0 2 -33
-31 -29 -2 2
-1 0 1 0.1
0 -0.1
0.5 0 -0.5
2 0 -2
-80 0 80
-2 0 2
R C I R C II
R C III R C IV
TP R P DMA MC A LIA(a) LIA(b) IE
cold warm 800 400 400Y ears (B C E / C E )800 1200 1600 2000
TP R P DMA MC A LIA(a) LIA(b) IE
1/1
1/1
ΔCentral Europe JJA Tª (ºC)
ΔEurope Tª (ºC)
∆Alk-SST
(ºC)
stack
Δ
δ O
18
sw
stack
Δ
δ O stack
18
c
ΔMg/Ca-SST (ºC) stack
δ O (‰VPDB)
18
G.ruber
GISP2 Tª (ºC)
(a)
(b)
(c)
(d)
(e)
( f )
(g)
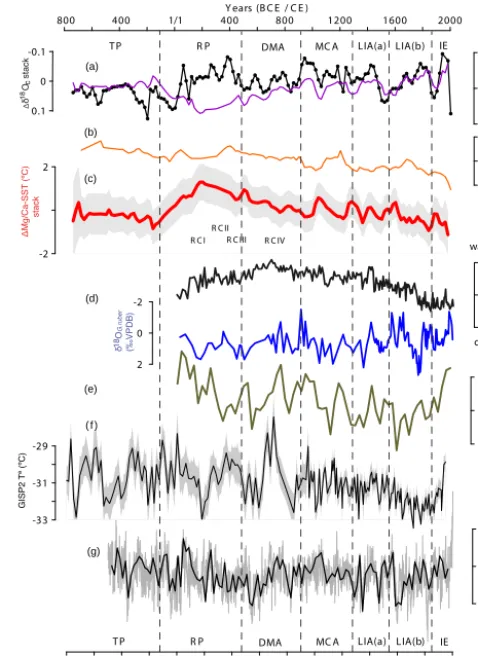
Figure 6.Temperature and isotope anomaly records from Minorca
(this study) and data from other regions. (a)δ18Oc and δ18Osw
(‰ SMOW) Minorca stacks; (b) alkenone–SST anomaly Minorca
stack; (c) Mg/Ca–SST anomaly Minorca stack; (d) warm and cold
phases andδ18OG.ruberrecorded by planktonic foraminifera from
the southern Tyrrhenian composite core, with RCI to RCIV show-ing Roman cold periods (Lirer et al., 2014); (e) 30-year averages of the PAGES 2k Network (2013) Europe anomaly temperature recon-struction; (f) Greenland snow surface temperature (Kobashi et al., 2011); and (g) central Europe summer anomaly temperature recon-struction in central Europe (Büntgen et al., 2011).
graphic areas. Both Mg/Ca–SST and alkenone–SST records are consistent in showing a general cooling trend from ∼500 BCE and reaching minimum values by the end of the period (∼120 BCE; Fig. 6a–b). Very few other records are available from this time period, which make comparisons of these trends at regional scale difficult.
recon-structions from north-west Spain (Martínez-Cortizas et al., 1999), and to some extent with SST proxies in the south-eastern Tyrrhenian Sea (Lirer et al., 2014). However, none of these records indicates that the RP was the warmest period of the last 2 kyr. Other records from higher latitudes such as Greenland (Dahl-Jensen et al., 1998), and northern Europe (Esper et al., 2014), North Atlantic Ocean (Bond et al., 2001; Sicre et al., 2008), as well as speleothem records from north-ern Iberia (Martín-Chivelet et al., 2011) and even the mul-tiproxy PAGES 2K reconstruction from Europe, suggest a rather warmer early RP than late RP and, again, none of these records highlights the Roman times as the warmest climate period of the last 2 kyr. Consequently, these very warm RP conditions recorded in the Minorca Mg/Ca–SST stack seem to have a regional character and suggest that climate evolu-tion during this period followed a rather heterogeneous ther-mal response along the European continent and surrounding marine regions.
Moreover, the observed δ18Oswstack of the RP suggests
an increase in the E–P ratio (Fig. 6a) during this period, which has also been observed in some nearby regions like the Alps (Holzhauser et al., 2005; Joerin et al., 2006). In contrast, a lake record from southern Spain indicates relatively high water levels when theδ18Oswstack indicates the maximum
in E–P ratio (Martín-Puertas et al., 2008). This information is not necessarily contradictory, since enhanced E–P balance in the Mediterranean could be balanced out by enhanced precip-itation in some of the regions, but more detailed geographical information is required to interpret these proxy records from distinct areas.
After the RP, during the whole DMA and until the MCA, the Mg/Ca–SST stack shows a cooling of ∼1◦C (−0.2◦C 100 yr−1), which is 0.3◦C in the case of the alkenone–SST stack and the E–P rate decreases. This trend contrasts with the general warming trend interpreted from the speleothem records of northern Iberia (Martín-Chivelet et al., 2011) or the transition towards drier conditions ob-served in Alboran records (Nieto-Moreno et al., 2011). How-ever, SST proxies from the Tyrrhenian Sea show a cooling trend after the second half of the DMA and the Roman IV cold/dry phase (Lirer et al., 2014) that can be tentatively cor-related with our SST records (Fig. 6). This cooling phase is also documented in the δ18OG. ruber record of the Gulf of
Taranto (Grauel et al., 2013). These heterogeneities in the signals from the different proxies and regions illustrate the difficulties in characterizing the climate variability during these short periods and reinforce the need for a better geo-graphical coverage of individual proxies.
The medieval period is usually described as a very warm period in numerous regions in the Northern Hemisphere (Hughes and Diaz, 1994; Mann et al., 2008; Martín-Chivelet et al., 2011), but this interpretation is challenged by an in-creasing number of studies (i.e. Chen et al., 2013). The Mi-norca SST stacks also show the occurrence of significant temperature variability that does not reflect a specific warm
period within the last 2 kyr (Fig. 6). An important warming event is observed at∼1000 CE, followed by a later cooling with minimum values at about 1200 CE (Fig. 6). Higher tem-perature variability is found in Greenland records (Kobashi et al., 2011), while an early warm MCA and posterior cooling is also observed in temperature reconstructions from central Europe (Büntgen et al., 2011) and in the European multi-proxy 2 kyr stack of the PAGES 2K Consortium (2013). Nev-ertheless, all these proxies agree in indicating overall warmer temperatures during the MCA than during the LIA. At the MCA–LIA transition, a progressive cooling and a change in oscillation frequency before and after the onset of LIA are recorded. This transition is consistent with the last rapid cli-mate change (RCC) described in Mayewski et al. (2004).
In the context of the Mediterranean Sea, the lake, marine, and speleothem records consistently agree in showing drier conditions during the MCA than during the LIA (Moreno et al., 2012; Chen et al., 2013; Nieto-Moreno et al., 2013; Wassenburg et al., 2013). Examination of the δ18sw stack
shows several oscillations during the MCA and LIA but no clear differentiation between these periods can be inferred from this proxy, indicating that reduced precipitation also involved reduced evaporation in the basin and that the E–P balance recorded by theδ18Oswproxy was not modified. The
centennial-scale variability found in both the Mg/Ca–SST andδ18Oswstack reveals that higher E–P conditions existed
during the warmer intervals (Fig. 6a and c).
According to the Mg/Ca–SST stack, the LIA stands out as a period of high thermal variability in which two substages can be differentiated, a first involving large SST oscillations and warm average temperatures (LIAa) and a second sub-stage with short oscillations and cold average SST (LIAb). We suggest that the LIAa interval could be linked to the Wolf and Spörer solar minima and that the LIAb corresponds to Maunder and Dalton cold events, in agreement with previous observations (i.e. Vallefuoco et al., 2012).
These two LIA substages are also present in the Green-land record (Kobashi et al., 2011). The intense cooling drop (0.8◦C 100 yr−1) at the onset of the LIAb is in agreement with the suggested coolings of 0.5 and 1◦C in the North-ern Hemisphere (i.e. Matthews and Briffa, 2005; Mann et al., 2009). These two steps within the LIA are better reflected in the Mg/Ca–SST stack than in the alkenone–SST stack. This is also the case of the alkenone records in the Alboran Sea (Nieto-Moreno et al., 2011), which may result from smaller SST variability of the alkenone proxies (see Sect. 5.5).
consis-tent with the described enhanced storm activity over the GoL in this period (Sabatier et al., 2012), explaining the enhanced humidity transport towards the Mediterranean Sea as a con-sequence of the reduced E–P ratio observed in the δ18Osw,
particularly during the LIAb (Fig. 6a).
The end of the LIA and onset of the IE is marked with a warming phase of about 1◦C in the Mg/Ca–SST stack and a lower-intensity change in the alkenone–SST stack. This initial warm climatic event is also documented in other Mediterranean regions (Taricco et al., 2009; Marullo et al., 2011; Lirer et al., 2014) and Europe (PAGES 2K Consor-tium, 2013), which is coincident with a total solar irradiance (TSI) enhancement after Dalton minima. The two Minorca SST stacks show a cooling trend by the end of the record, which does not seem to be consistent with the instrumental atmospheric records. In the western Mediterranean, warming has been registered in two main phases: from the mid-1920s to 1950s and from the mid-1970s onwards (Lionello et al., 2006). The Minorca stacks do not show this warming, but they do not cover the second warming period. Nevertheless, the instrumental data from the beginning of the 20th century in the western Mediterranean do not display any warming trends before the 1980s (Vargas-Yáñez et al., 2010).
6.2 Climate forcing mechanisms
The general cooling trend observed in both Mg/Ca–SST and alkenone–SST stacks shows a good correlation with the evolution of summer insolation in the North Hemi-sphere, which dominates the present annual insolation bal-ance (r=0.2 and 0.8,pvalue≤0.007, respectively; Fig. 7). In numerous records from the Northern Hemisphere (i.e. Wright, 1994; Marchal et al., 2002; Kaufman et al., 2009; Moreno et al., 2012), this external forcing has also been proposed to control major SST trends during the Holocene period. In addition, summer insolation seems to have had significant influence in the decreasing trend of the iso-tope records during the whole period spanned (r=0.4,
pvalue=0), as has been suggested in, for example, Ausín et al. (2015). In any case, a different forcing mechanism needs to account for the centennial-scale variability of the records, e.g. increased volcanism in the last millennium (McGregor et al., 2015), although no significant correlations have been observed between our records and volcanic reconstructions (Gao et al., 2008).
Solar variability has frequently been proposed to be a pri-mary driver of the Holocene millennial-scale variability (i.e. Bond et al., 2001). Several oscillations observed in the TSI record (Fig. 7a), but the correlations with the Mg/Ca–SST and alkenone–SST stacks are low, since most of the ma-jor TSI drops do not correspond to SST cold events. How-ever, some correlation is observed between TSI and alkenone SSTs (r=0.5,pvalue=0). In any case, TSI does not seem to be the main driver of the centennial-scale SST variability in the studied records.
800 400 400 800 1200 1600 2000
Y ears (B C E /C E )
-2 2
424 432 440 448
-1 0 1
-2 2
A
M
O
-3 0 3
-0.8 0.8
4 2 0
P
a
lae
o
s
to
rm
-2 0 2
N
A
O
0.5 0 -0.5
TP R P DMA MC A LIA(a) LIA(b) IE
S ummer ins lation 40º N
+
-800 400 400Y ears (B C E /C E )800 1200 1600 2000
TP RP DMA MC A LIA(a) LIA(b) IE
1/1 1/1
∆
Mg/Ca-SST (ºC) stack
-2
Δ
TSI (W m )
Δ
δ
O
stack
18
sw
NAO
∆Alk-SST
(
ºC)
stack
o (a)
(b)
(c)
(e) (d)
(f)
(g)
(h)
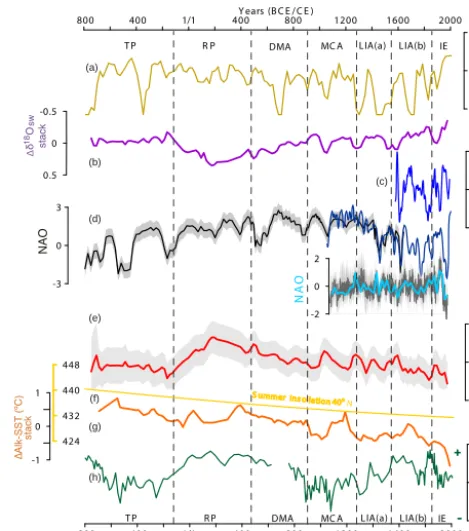
Figure 7.Temperature and isotope anomaly records from Minorca
(this study) and data from other regions and with external forcings:
(a) total solar irradiance (Steinhilber et al., 2009, 2012), (b)δ18Osw
Minorca stacks, (c) Atlantic Multidecadal Oscillation (AMO; Gray et al., 2004), (d) North Atlantic Oscillation (NAO) reconstructions (Olsen et al., 2012; Trouet et al., 2009; and, for the last millennium,
Ortega et al., 2015), (e) Mg/Ca–SST anomaly Minorca stack,
(f) summer insolation at 40◦N (Laskar et al., 2004), (g) alkenone–
SST anomaly Minorca stack, and (h) palaeostorm activity in the Gulf of Lion (Sabatier et al., 2012).
controver-1000 1200 1400 1600 1800 2000 Y ears (B C E /C E )
0 -0.4
18O
S
W
sta
ck
5 0
P
al
eo
st
o
rm
1 -1
N
A
O
0.4 0 -0.4
+
-Δ
δ
(a)
(b)
a
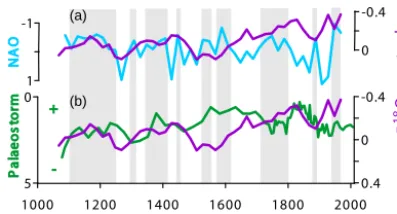
Figure 8.δ18OswMinorca stack (‰ SMOW) during the last
mil-lennium (age is expressed in years CE) plotted with (a) NAO re-construction (Ortega et al., 2015) and (b) palaeostorm activity in the Gulf of Lion (Sabatier et al., 2012). Notice that the NAO axis is on a descending scale. Grey vertical bars represent negative NAO phases.
sial, some NAO reconstructions on proxy records are start-ing to become available for the period studied (Lehner et al., 2012; Olsen et al., 2012; Trouet et al., 2012; Ortega et al., 2015). The last millennium is the best-resolved period, and it allows a direct comparison with our data to evaluate the potential link to NAO.
The correlations between our Minorca temperature stacks with NAO reconstructions (Fig. 7) are relatively low in the case of Mg/Ca–SST (r=0.3,pvalue≤0.002) and not sig-nificant in the alkenone stack, indicating that this forcing is probably not the driver of the main trends in these records, al-though several uncertainties still exist about the long NAO re-constructions (Lehner et al., 2012). If detailed analysis is per-formed focussing on the more intense negative NAO phases (Fig. 7), they mostly appear to correlate with cooling phases in the Mg/Ca stack. The frequency of these negative events is particularly high during the LIA, and mostly during its second phase (LIAb), when the coldest intervals of our SST stacks were observed.
When several different proxy last century records of an-nual resolution, tested with some model assimilations (Or-tega et al., 2015), are compared with the last NAO recon-struction, the observed correlations withδ18Osware not
sta-tistically significant. However, the Welch’s test results do not allow for the null hypothesis to be discarded. A coherent pat-tern of NAO variability with ourδ18Oswreconstruction, with
high (low) isotopic values mainly dominating during posi-tive (negaposi-tive) NAO phases, can be observed in the last cen-turies (Fig. 8). This pattern is consistent with the described E–P increase during high NAO phases described for the last decades (Tsimplis and Josey, 2001). The SST stacks also sug-gest some degree of correlation between warm SST and high NAO values (Fig. 7), but a more coherent picture is observed when the SST records are compared to the Atlantic Merid-ional Oscillation (AMO) reconstruction: warm SST domi-nated during high AMO values (Fig. 9). This pattern of salin-ity changes related to NAO and SST to AMO has also been
-2 0 2
A
M
O
1600 1700 1800 1900 2000
Y ears (B C E /C E )
-1.5 -1 -0.5 0 0.5
S
S
T
(
ºC
)
Mg/C a-S S T
Uk'37-S S T
Figure 9. Mg/Ca–SST and alkenone–SST Minorca anomaly
stacks during the last centuries plotted with AMO reconstruction (Gray et al., 2004).
described in climate studies encompassing the last decades (Mariotti, 2011; Guemas et al., 2014) and confirms the com-plex but tight response of the Mediterranean to atmospheric and marine changes over the North Atlantic Ocean.
The pattern of high δ18Osw at dominant positive NAO
corresponds to a reduction in the humidity transport over the Mediterranean region as a consequence of high atmo-spheric pressure (Tsimplis and Josey, 2001). Accordingly, several periods of increased/decreased storm activity in the GoL (Fig. 8; Sabatier et al., 2012) correlate with low/high values in theδ18Osw, indicating that, during negative NAO
conditions, northern European storm waves arrived more frequently in the Mediterranean Sea (Lionello and Sanna, 2005), contributing to the reduction of the E–P balance (Fig. 8). Our data also indicate that, during these enhanced storm periods, cold SST conditions dominated in the region as previously suggested (Sabatier et al., 2012). Nevertheless, not all the NAO oscillations had identical expression in the compared records, which is coherent with recent observa-tions indicating that negative NAO phases may correspond to different atmospheric configuration modes and impact dif-ferently over the western Mediterranean Sea (Sáez de Cá-mara et al., 2015). Regarding the lower part of the record, the maximum SST temperatures andδ18Oswrecorded during
the RP (100–300 CE) may suggest the occurrence of persis-tent positive NAO conditions, which would also be consispersis-tent with a high pressure-driven drop in relative sea level as has been reconstructed in the north-western Mediterranean Sea (southern France,−40±10 cm; Morhange et al., 2013).
Mg/Ca–SST stack record may have caught this cooling, which would prove the robustness of our age models (see Supplement for age model development).
7 Summary and conclusions
The review of new core-top data of G. bulloides Mg/Ca ratios from the central-western Mediterranean Sea together with previous published data support a consistent temper-ature sensitivity for the Mediterranean samples and allows for the previous calibrations to be refined. The recorded Mg/Ca–SST signal from G. bulloides is interpreted to re-flect April–May conditions from the upper 40 m layer. In contrast, the alkenone–SST estimations are interpreted to in-tegrate a more annually averaged signal, although they are biased toward the winter months since primary productiv-ity during the summer months in the Mediterranean Sea is extremely low. The averaged signal of the alkenone–SST records may explain its relatively smoothed oscillations in comparison to the Mg/Ca–SST records.
After careful construction of a common chronology for the studied multicores, based on several chronological tools, the individual proxy records have been grouped in an anomaly-stacked record to allow a better identification of the main pat-terns and structures. Both Mg/Ca–SST and alkenone stacks show a consistent cooling trend over the studied period. Since the RP maximum, this cooling has ranged between−1.7 and −2.0◦C kyr−1in the Mg/Ca record and is less pronounced in the alkenone record (−1.1◦C kyr−1). This cooling trend is consistent with the general lowering of summer insolation. The overall cooling is punctuated by several SST oscillations at centennial timescales, which represent maximum SST dur-ing most of the RP; a progressive cooldur-ing durdur-ing the DMA; a pronounced variability during the MCA with two intense warming phases reaching warmer SST than during the LIA; and a very unstable and rather cold LIA, with two substages – a first one with larger SST oscillations and warmer aver-age temperatures (LIAa) and a second one with shorter os-cillations and colder average SST (LIAb). The described two stages within the LIA are clearer in the Mg/Ca–SST stack than in the alkenone–SST record. Comparison of Mg/Ca– SST andδ18Oswstacks indicates that warmer intervals have
been accompanied by higher evaporation–precipitation (E– P) conditions. The E–P balance oscillations over each de-fined climatic period during the last 2.7 kyr suggest varia-tions in the thermal change and moisture export patterns in the central-western Mediterranean.
Comparison of the Minorca SST stacks with other Eu-ropean palaeoclimatic records suggests a rather heteroge-neous thermal response along the European continent and surrounding marine regions. Comparison of the new Mediter-ranean records with the reconstructed variations in TSI does not support a clear connection with this climate forcing. Nev-ertheless, changes in the NAO and AMO seem to have
in-fluenced the regional climate variability. The negative NAO phases correlate mostly with cooling phases of the Mg/Ca stack, although this connection is complex and apparently better defined during the most intense negative phases. Fo-cussing on the last 1 kyr, when NAO reconstructions are bet-ter constrained, provides a more consistent patbet-tern, with cold and particularly fresherδ18Oswvalues (reduced E–P balance)
during negative NAO phases. Our results are consistent with enhanced southward transport of European storm tracks dur-ing this period and previous reconstructions of storm activity in the GoL. Nevertheless, the SST stacks show a more tied relation to AMO during the last four centuries (the available period of AMO reconstructions) in which warm SST dom-inated during high AMO values. This evidence supports a close connection between Mediterranean and North Atlantic climatology over the last 2 kyr.
The Supplement related to this article is available online at doi:10.5194/cp-12-849-2016-supplement.
Acknowledgements. Cores MINMC06 were recovered by the
HERMES 3 cruise in 2006 on R/V Thethys II and HER-MC-MR3 cores were collected by the HERMESIONE expedition onboard R/V Hespérides in 2009. This research was financially supported by OPERA (CTM2013-48639-C2-1-R) and Consolider-Redes (CTM2014-59111-REDC). We thank Generalitat de Catalunya Grups de Recerca Consolidats for grant 2009 SGR 1305 to GRC Geociències Marines. The Project of Strategic Interest NextData PNR 2011–2013 (www.nextdataproject.it) also collaborated in the financing. We are grateful to M. Guart (Dept. de Dinàmica de la Terra i de l’Oceà, Universitat de Barcelona), M. Romero, T. Padró and J. Perona (Serveis Cientifico-Tècnics, Universitat de Barcelona), J. M. Bruach (Departament de Física, Universitat Autònoma de Barcelona), and B. Hortelano, Y. Gonzalez-Quinteiro, and I. Fernández (Institut de Diagnosi Ambiental i Estudis de l’Aigua, CSIC, Barcelona) for their help with the laboratory work; to D. Amblàs for his collaboration with the artwork of maps; and to Paleoteam for the unconditional support. E. Garcia-Solsona, S. Giralt, and M. Blaauw are acknowledged for their help. We also acknowledge the guest editor and anonymous reviewers for their comments, which contributed to improving this paper. Belen Mar-trat acknowledges funding from CSIC-Ramon y Cajal post-doctoral programme RYC-2013-14073. Mercè Cisneros benefited from a fellowship of the University of Barcelona. Leopoldo D. Pena acknowledges support from the Ramón y Cajal programme (MINECO, Spain). Isabel Cacho thanks the ICREA-Academia programme from the Generalitat de Catalunya.
Edited by: J. Guiot
References
sediment cores record climate variability and earthquake activ-ity off Lisbon (Portugal) for the last 2000 years, Quaternary Sci. Rev., 24, 2477–2494, doi:10.1016/j.quascirev.2004.04.009, 2005.
Anand, P., Elderfield, H., and Conte, M. H.: Calibration
of Mg/Ca thermometry in planktonic foraminifera from
a sediment trap time series, Paleoceanography, 18, 1050, doi:10.1029/2002PA000846, 2003.
André, G., Garreau, P., Garnier, V., and Fraunié, P.: Modelled variability of the sea surface circulation in the North-western Mediterranean Sea and in the Gulf of Lions, Ocean Dynam., 55, 294–308, 2005.
Appleby, P. G. and Oldfield, F.: Application of Lead-210 to Sed-imentation Studies, Clarendon Press, Oxford, Chapt. 21, 731– 778, 1992.
Ausín, B., Flores, J. A., Sierro, F. J., Cacho, I., Hernández-Almeida, I., Martrat, B., and Grimalt, J. O.: Atmospheric pat-terns driving Holocene productivity in the Alboran Sea (West-ern Mediterranean): a multiproxy approach, Holocene, 25, 1–13, doi:10.1177/0959683614565952, 2015.
Bárcena, M. A., Flores, J. A., Sierro, F. J., Pérez-Folgado, M., Fabres, J., Calafat, A., and Canals, M.: Planktonic re-sponse to main oceanographic changes in the Alboran Sea (Western Mediterranean) as documented in sediment traps and surface sediments, Mar. Micropaleontol., 53, 423–445, doi:10.1016/j.marmicro.2004.09.009, 2004.
Barker, S., Greaves, M., and Elderfield, H.: A study of
cleaning procedures used for foraminiferal Mg/Ca
pa-leothermometry, Geochem. Geophy. Geosy., 4, 8407,
doi:10.1029/2003GC000559, 2003.
Barker, S., Cacho, I., Benway, H., and Tachikawa, K.:
Plank-tonic foraminiferal Mg/Ca as a proxy for past oceanic
tem-peratures: a methodological overview and data compilation for the Last Glacial Maximum, Quaternary Sci. Rev., 24, 821–834, doi:10.1016/j.quascirev.2004.07.016, 2005.
Barriendos, M. and Martin-Vide, J.: Secular climatic oscillations as indicated by catastrophic floods in the spanish mediterranean coastal area (14th–19th centuries), Climatic Change, 38, 473– 491, 1998.
Bé, A. W. H. and Hutson, W. H.: Ecology of planktonic foraminifera and biogeographic patterns of life and fossil assemblages in the Indian Ocean, Micropaleontology, 23, 369–414, 1977.
Bemis, B. E., Spero, H. J., Bijma, J., and Lea, D. W.: Reevaluation of the oxygen isotopic composition of planktonic foraminifera: Experimental results and revised paleotemperature equations, Paleoceanography, 13, 150–160, doi:10.1029/98PA00070, 1998. Benito, G., Sopeña, A., Sánchez-Moya, Y., Machado, M. J., and Pérez-González, A.: Palaeoflood record of the Tagus River (Cen-tral Spain) during the Late Pleistocene and Holocene, Quaternary Sci. Rev., 22, 1737–1756, doi:10.1016/S0277-3791(03)00133-1, 2003.
Béthoux, J. P.: Mean water fluxes across sections in the Mediter-ranean Sea, evaluated in the basis of water and salt budgets and of observed salinities, Oceanol. Acta, 3, 79–88, 1980.
Bond, G., Kromer, B., Beer, J., Muscheler, R., Evans, M. N., Showers, W., Hoffmann, S., Lottibond, R., Hajdas, I., and Bonani, G.: Persistent solar influence on North At-lantic climate during the holocene, Science, 294, 2130–2136, doi:10.1126/science.1065680, 2001.
Bosc, E., Bricaud, A., and Antoine, D.: Seasonal and interan-nual variability in algal biomass and primary production in the Mediterranean Sea, as derived from 4 years of SeaW-iFS observations, Global Biogeochem. Cy., 18, 2003–2034, doi:10.1029/2003GB002034, 2004.
Büntgen, U., Tegel, W., Nicolussi, K., McCormick, M., Frank, D., Trouet, V., Kaplan, J. O., Herzig, F., Heussner, K. U., Wanner, H., Luterbacher, J., and Esper, J.: 2500 years of European cli-mate variability and human susceptibility, Science, 331, 578–82, doi:10.1126/science.1197175, 2011.
Cacho, I., Pelejero, C., Grimalt, J. O., Calafat, A., and Canals, M.: C37 alkenone measurements of sea surface temperature in the Gulf of Lions (NW Mediterranean), Org. Geochem., 30, 557– 566, 1999a.
Cacho, I., Grimalt, J. O., Pelejero, C., Canals, M., Sierro, F. J., Flo-res, J. A., and Shackleton, N.: Dansgaard-Oeschger and Heinrich event imprints in Alboran Sea paleotemperatures, Paleoceanog-raphy, 14, 698–705, 1999b.
Cacho, I., Grimalt, J. O., Sierro, F. J., Shackleton, N., and Canals, M.: Evidence for enhanced Mediterranean thermohaline circula-tion during rapid climatic coolings, Earth Planet. Sc. Lett., 183, 417–429, doi:10.1016/S0012-821X(00)00296-X, 2000. Cacho, I., Grimalt, J., Canals, M., Sbaffi, L., Shackleton, N. J.,
Schönfeld, J., and Zahn, R.: Variability of the western Mediter-ranean Sea surface temperature during the last 25 000 years ans its connection with the Northern Hemisphere climatic changes, Paleoceanography, 16, 40–52, 2001.
Cacho, I., Shackleton, N., Elderfield, H., Sierro, F. J., and Grimalt, J.
O.: Glacial rapid variability in deep-water temperature andδ18O
from the Western Mediterranean Sea, Quaternary Sci. Rev., 25, 3294–3311, doi:10.1016/j.quascirev.2006.10.004, 2006. Canals, M., Puig, P., De Madron, X. D., Heussner, S., Palanques, A.,
and Fabres, J.: Flushing submarine canyons, Nature, 444, 354– 357, doi:10.1038/nature05271, 2006.
Chen, L., Zonneveld, K. A. F., and Versteegh, G. J. M.: The Holocene Paleoclimate of the Southern Adriatic Sea re-gion during the “Medieval Climate Anomaly” reflected by organic walled dinoflagellate cysts, Holocene, 23, 645–655, doi:10.1177/0959683612467482, 2013.
Cléroux, C., Cortijo, E., Anand, P., Labeyrie, L., Bassinot, F.,
Caillon, N., and Duplessy, J. C.: Mg/Ca and Sr/Ca
ra-tios in planktonic foraminifera: proxies for upper water col-umn temperature reconstruction, Paleoceanography, 23, PA3214, doi:10.1029/2007PA001505, 2008.
Combourieu Nebout, N., Turon, J., Zahn, R., Capotondi, L., Lon-deix, L., and Pahnke, K.: Enhanced aridity and atmospheric high-pressure stability over the western Mediterranean during the North Atlantic cold events of the past 50 k.y., Geology, 30, 863– 866, 2002.
Combourieu Nebout, N., Peyron, O., Dormoy, I., Desprat, S., Beau-douin, C., Kotthoff, U., and Marret, F.: Rapid climatic variability in the west Mediterranean during the last 25 000 years from high resolution pollen data, Clim. Past, 5, 503–521, doi:10.5194/cp-5-503-2009, 2009.
Conte, M. H., Sicre, M. A., Rühlemann, C., Weber, J. C., Schulte, S., Schulz-Bull, D., and Blanz, T.: Global temperature calibration
of the alkenone unsaturation index (UK370) in surface waters and