Atmos. Meas. Tech., 6, 3407–3423, 2013 www.atmos-meas-tech.net/6/3407/2013/ doi:10.5194/amt-6-3407-2013
© Author(s) 2013. CC Attribution 3.0 License.
Atmospheric
Measurement
Techniques
Open Access
COMPASS – COMparative Particle formation in the Atmosphere
using portable Simulation chamber Study techniques
B. Bonn1,*, S. Sun1,**, W. Haunold1, R. Sitals1, E. van Beesel1, L. dos Santos1, B. Nillius1, and S. Jacobi2 1Institute for Atmospheric and Environmental Sciences, J.W. Goethe University, Altenhöferallee 1,
60438 Frankfurt am Main, Germany
2Hessian Agency for the Environment and Geology (HLUG), Rheingaustrasse 186, 65203 Wiesbaden, Germany *now at: Institute for Advanced Sustainable Studies, Berliner Straße 130, 14467 Potsdam, Germany
**now at: Department of Biogeochemistry, Max Planck Institute for Chemistry, Hahn-Meitner-Weg 1,
55028 Mainz, Germany
Correspondence to: B. Bonn ([email protected])
Received: 5 June 2013 – Published in Atmos. Meas. Tech. Discuss.: 27 June 2013
Revised: 20 September 2013 – Accepted: 4 November 2013 – Published: 9 December 2013
Abstract. In this study we report the set-up of a novel twin chamber technique that uses the comparative method and es-tablishes an appropriate connection of atmospheric and lab-oratory methods to broaden the tools for investigations. It is designed to study the impact of certain parameters and gases on ambient processes, such as particle formation online, and can be applied in a large variety of conditions. The character-isation of both chambers proved that both chambers operate identically, with a residence timexT (COMPASS1) = 26.5± 0.3 min and xT (COMPASS2) = 26.6±0.4 min, at a typi-cal flow rate of 15 L min−1 and a gas leak rate of (1.6± 0.8)×10−5s−1. Particle loss rates were found to be larger (due to the particles’ stickiness to the chamber walls), with an extrapolated maximum of 1.8×10⁻³s−1at 1 nm, i.e. a hun-dredfold of the gas leak rate. This latter value is associated with sticky non-volatile gaseous compounds, too. Compari-son measurement showed no significant differences. There-fore operation under atmospheric conditions is trustworthy. To indicate the applicability and the benefit of the system, a set of experiments was conducted under different condi-tions, i.e. urban and remote, enhanced ozone and terpenes as well as reduced sunlight. In order to do so, an ozone lamp was applied to enhance ozone in one of two cham-bers; the measurement chamber was protected from radiation by a first-aid cover and volatile organic compounds (VOCs) were added using a small additional flow and a temperature-controlled oven. During the elevated ozone period, ambient particle number and volume increased substantially at urban
and remote conditions, but by a different intensity. Protection of solar radiation displayed a clear negative effect on parti-cle number, while terpene addition did cause a distinct daily pattern. E.g. addingβ pinene particle number concentration rose by 13 % maximum at noontime, while no significant ef-fect was observable during darkness. Therefore, the system is a useful tool for investigating local precursors and the details of ambient particle formation at surface locations as well as potential future feedback processes.
1 Introduction
The change of climate conditions on regional and global scale has been reported and is established (IPCC report, Solomon et al., 2007). In this context certain aspects such as temperature, radiation budgets, volatile organic compounds and ozone will change differently on different scales. In or-der to unor-derstand and approximate certain effects and their feedback on climate in an appropriate way, novel tools are needed to link laboratory-based results with ambient obser-vations. This includes detailed laboratory techniques and the extrapolation of knowledge to ambient conditions in order to understand ambient observations.
3408 B. Bonn et al.: COMPASS
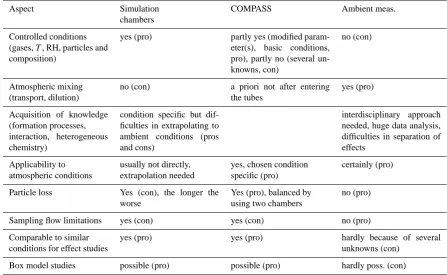
Table 1. List of pros and cons for the present set-up (COMPASS) compared to simulation chamber studies and atmospheric measurements.
Aspect Simulation chambers
COMPASS Ambient meas.
Controlled conditions (gases,T, RH, particles and composition)
yes (pro) partly yes (modified param-eter(s), basic conditions, pro), partly no (several un-knowns, con)
no (con)
Atmospheric mixing (transport, dilution)
no (con) a priori not after entering the tubes
yes (pro)
Acquisition of knowledge (formation processes, interaction, heterogeneous chemistry)
condition specific but dif-ficulties in extrapolating to ambient conditions (pros and cons)
interdisciplinary approach needed, huge data analysis, difficulties in separation of effects
Applicability to atmospheric conditions
usually not directly, extrapolation needed
yes, chosen condition specific (pro)
certainly (pro)
Particle loss Yes (con), the longer the worse
Yes (pro), balanced by using two chambers
no (pro)
Sampling flow limitations yes (con) yes (con) no (pro)
Comparable to similar conditions for effect studies
yes (pro) yes (pro) hardly because of several unknowns (con)
Box model studies possible (pro) possible (pro) hardly poss. (con)
are wall losses, limited amount of mixture ingredients, mod-erate path lengths for spectroscopy, enhanced concentrations and – depending on the set-up – either a limited amount of re-action time (flow chambers) or of volume (static chambers). Otherwise, conditions are well defined and mechanistic stud-ies of e.g. kinetics are possible. This facilitates the applica-tion of a box model to simulate observed processes in a very detailed way. The conditions are rather different for ambi-ent studies; important compound concambi-entrations sometimes hardly exceed the detection limit, a notable heterogeneity of the site is present with changes in the local compound dis-tribution and the time resolution actually depends on the in-struments used. Usually no past condition can be changed or investigated again, that means the benefit of laboratory tech-niques to repeat the experiment for different conditions is not available. A summary of all these aspects is given in Table 1. Both approaches include strong benefits and some weak-nesses: the smog-chamber-based one investigates processes under well quantified conditions such as temperature, humid-ity, radiation and gaseous concentrations. The conditions can be chosen in the way that best suits the observational tech-niques. Because of volume limitations (static chambers) or time limitations (flow chambers) this approach is limited in process time. The smog-chamber approach can be divided into subgroups, i.e. set-ups exploring definite mixtures in a static or dynamic vessel with an artificial light source that is supposed to be similar to the ambient one. Examples are the sphere reactor at Max Planck Institute for Chemistry (Neeb
B. Bonn et al.: COMPASS 3409
range of different conditions and their annual patterns. These include, in general, micrometeorology and gas- and aerosol-phase measurements. Examples of this kind of set-up can be found e.g. at the SMEAR research stations in Hyytiälä (FIN) (Rannik, 1998) or at the Blodgett forest (USA) (Holzinger et al., 2005). Seasonal impacts of parameters on specific pro-cesses and changes over time have been derived from the ob-servations made (Hyvönen et al., 2005; Lyubovtseva et al., 2005). Missing aspects can be revealed as well as quanti-fied. Examples include missing volatile organic compound emissions (Goldstein and Galbally, 2007), missing OH re-activity (Lelieveld et al., 2008; Lelieveld, 2010; Nölscher et al., 2012) and the lack in process understanding of ambient new aerosol particle formation (Kulmala et al., 2013). How-ever, the reduced concentration of parameters in the ambient conditions competes with the detection limits of the applied instruments, resulting in a gap of knowledge.
However, due to the spot-like measurements that are af-fected by transport, local sources and sinks and the time reso-lution of instruments, separation of individual aspects is chal-lenging in the highly nested atmospheric system. We aim to address this gap with our new comparative and portable twin flow chamber COMPASS, which facilitates the usage of lab-oratory tools in a certain time frame under ambient condi-tions. The flow-chamber approach allows the investigation of a process in a certain time scale for ambient and modified conditions. Since the set-up is portable, different locations and conditions can be compared with respect to atmospheric conditions and the extrapolation of laboratory-based results can be checked. Based on this approach, a future increase in temperature or of natural gas concentrations, for example, could be investigated, as well as the impact of certain anthro-pogenically enhanced species. In this study, the construction, characterisation and exemplary application for a well-known ambient problem is explained.
This well-known problem concerns the ambient new aerosol particle formation processes from gaseous pre-cursors, which have been observed all around the globe (Kulmala et al., 2004c) and which have been studied for more than a century. A wide range of theories have been devel-oped as explanations; these include primarily sulfuric-acid-related mechanisms such as binary and ternary nucleation (Kulmala et al., 2004b). These are expected to take place in the free troposphere and in the vicinity of significant ammo-nia sources, such as agriculture and farming (Korhonen et al., 1999; Spracklen et al., 2010). Others, like the ion-induced nucleation (Hirsikko et al., 2011; Kirkby et al., 2011) or the iodine oxide related oligomerisation (Burkholder et al., 2004), have been demonstrated to be relevant for the upper troposphere or the coastal zones, whereas algae emissions of diiodomethane (CH2I2)occur at draught stress conditions
(O’Dowd and Hoffmann, 2005). In the case of coastal new particle formation, the emitted volatile organic compounds (VOCs) subsequently react with ambient ozone and start the process of new aerosol particle production. Besides the
mentioned ones, several further theories have been postulated (Ryding et al., 2012; Bonn et al., 2002; Bonn and Moort-gat, 2003; Bonn et al., 2008) but could not be proven by aerosol mass spectrometry techniques (Jimenez et al., 2009) as the corresponding particular mass is too small and parti-cles undergo chemical transformation during accumulation. This problem is severe, since only very tiny amounts (per-haps less than a pptv)of a compound are required to
cre-ate a new phase, if the compound of interest has the right physic–chemical properties, i.e. low volatility, notable inter-action with other species or a high chemical reactivity (Bonn et al., 2007, 2013). Nevertheless, once the new particles are formed, a significant fraction grows beyond the size at which it can act as cloud condensation nuclei (CCN) and alter the physical size distribution of cloud droplets. This has a re-markable impact on the radiation budget in the climate sys-tem (Kulmala et al., 2004a; Merikanto et al., 2009) and pro-vides the key uncertainty in predicting climate feedbacks and processes. Therefore, a novel technique for investigating these processes is needed.
So far most of the so-called nucleation studies have been performed under controlled laboratory conditions, some-times with enhanced precursor concentrations to speed up the formation and early growth. The concluding results are then used to interpret ambient observations and processes (Bonn et al., 2009), an aspect that is subject to criticism. In this study, we report a novel technique that uses the com-parative method and provides a mixture of atmospheric and laboratory methods. It is designed to study the impact of cer-tain parameters and gases online and can be applied in a large variety of conditions.
2 Material and methods
2.1 Construction
The construction of two identical twin chambers aims to measure atmospheric situations under two sets of conditions, identical except for one parameter, to investigate the impact of the parameters on the process observed (Sun, 2013). It shall allow a notable residence time to investigate slowly oc-curring processes and aims to reduce dry wall loss to a min-imum and the surface to be chemically inert. Thus both twin chambers shall alter ambient conditions to a minimum level. The surface material is made of ethylene tetrafluoroethy-lene (ETFE, Texlon GmbH). It has a high level of trans-parency in the UV region (95 %) and in the visible range (83.6 %) (Table 2) i.e. higher than glass. It is inert, self-cleaning and very resistant to chemical reactive substances like ozone. It is temperature-resistant up to 150 degrees Cel-sius. The material is weatherproof (wind, temperature and rain) and the selected foil has a thickness of 25 µm.
3410Figures B. Bonn et al.: COMPASS
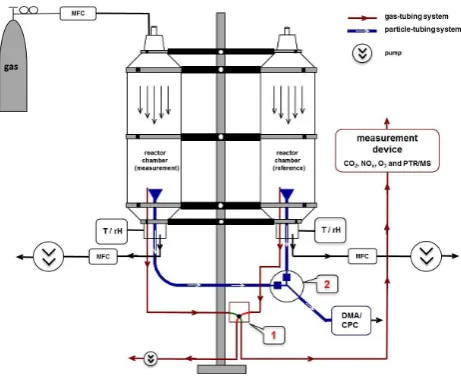
Figure 1
Fig. 1. Flow chart of the COMPASS system. Valve system 1 (mag-netic valve) and 2 (Grotec valve) are used for the periodic change of gas and particle sampling between modification and reference chamber.
towers on the right and left sides of the scaffold with several carrier rings (Fig. 1). The foothold material is formed as two rings on each chamber, i.e. one on the outside and one in-side. Each outer (carrier) ring is fixed on the scaffold and its diameter can be narrowed by a screw to fix the foil between the outer and inner ring. The foil is welded vertically to a cylinder. This cylindrical main section of each chamber has a total height of 1.8 m and a diameter of 50 cm. At the inlet and outlet region of the chamber, the cylindrical form is re-duced concentrically. Above and below the main section, the diameter of the cylinder reduces from 50 to 15 cm in both, i.e. the upper and lower, parts. The reduction of the inlet di-ameter aims to focus the direction of the inlet stream and to minimise the influence of turbulence. Mounted at the top is an inlet tube consisting of acrylic glass, which is connected to a cover plate with a flange. Finally, a flexible aluminium tube bent towards the ground is fixed at each of the chambers to protect them from rain.
In the following, one of the chambers is used as a refer-ence (COMPASS1) while the second one (COMPASS2) is modified as desired. Therefore COMPASS2 has an additional glass inlet for adding gases.
The chamber outlet is situated in the centre of the flow tube at the lowest part of the chamber. Two different out-let lines for gases and aerosol particles are chosen to pre-vent destruction of chemicals in the conducting tubes for the aerosol particle analysis. The flow dynamics are kept lam-inar with a Reynolds number (Re) of 420 and can be ex-pected as simulated using the FLUENT 6.1 software (Fig. 2) for 15 L min−1. The total flow rate in each chamber is con-trolled by mass flow controllers and electrical pumps. To allow sampling with a minimum of instrumentation, both
Figure 2
Fig. 2. Flow simulation for the COMPASS system using the FLU-ENT 6.1 software.
chamber outlets (COMPASS1 and 2) for gases and particles are connected to electrical switches (gases: magnetic valve, Bückert; particles: OSE-KKP, Grotec) controlled by a Lab-view card (National Instruments) and program that switches in 5 min intervals between both chambers (1t=10 min). To guarantee that the flow is stable during the changing time of the magnetic valve, there is a second magnetic valve, which is coupled with the first one. In this way an additional pump with the same flow rate as the gas measurement device can stabilise the flow of that chamber, which is current uncoupled from the gas measurement.
2.2 Instrumentation for measurements
2.2.1 Gaseous and meteorological measurements
Temperature and relative humidity are measured by Hy-grosens sensors (Model: HYTE-ANA-10V, HyHy-grosens) at the end of each chamber in 5 s intervals. A comparison of the two sensors at controlled laboratory conditions yielded no significant difference outside the measurement uncertainty. Note that both sensors are not protected from sunlight in order to modify flow conditions only to a minimum extent. Thus temperatures higher than the ambient ones are to be ex-pected. The chambers are constructed identically in order to enable one to compare the data afterward on a relative scale. Ozone was detected using the Horiba APOA-350E instru-ment alternatively in COMPASS1 and 2. Its sampling flow was set to 1 L min−1, and the measurement range was
B. Bonn et al.: COMPASS 3411
Table 2. Transparency measurements concerning the chamber wall material of ETFE foil obtained for a thickness of 200 µm (Asahi Glass Company Ltd.).
Spectral range Percentage of light passing
300–380 nm (UV) 90.5 % 380–780 nm (visible) 83.5 % 300–2100 nm (sunlight) 91.9 %
or were selected because of significant local sources. The sampling time for the individual masses was adapted to the present mixing ratio range, i.e. the smaller the concentration the larger the measurement time resulting in a total time res-olution between 32 and 37.4 s. For more details the reader is referred to Bourtsoukidis et al. (2012).
2.2.2 Particle phase measurements
In order to physically characterise the ambient particle num-ber and mass concentration, two different set-ups were ap-plied: (a) for quantification of the total aerosol number con-centration, a buthanol-based condensation particle counter (CPC, TSI 3025A, TSI Inc., US) with a lower cut-off size of 2.7 nm in diameter was used and averaged for 30 s inter-vals. Flows were calibrated before application and regularly afterwards. (b) To measure the particle volume and mass as well, the system was extended to a scanning mobility parti-cle sizer (SMPS, TSI 3936, TSI Inc., US). This instrument was configured as follows: sample flow = 1.5 L min−1(high flow), sheath flow = 6.0 L min−1, particle density assumed to be 1.2 g cm−3, and two scans per sample with 120 s upscan and 15 s downscan. These times result in a total sampling time of the SMPS per sample of 4 min 30 s. The remaining 30 s for a total of 5 min interval the SMPS was set to pause in order to prevent measurements during the switch from one to the other chamber.
To maintain the total flow rates in both chambers identical a set of 4 flow controllers was used. Since gas- and particle-phase measurements took place in alternating chambers with a match of the total flow rates of gases and of aerosol parti-cles (1.5 L min−1) the corresponding residual flows were
se-lected accordingly.
2.2.3 Data analysis and intercomparison
Since the focus is on a relative comparison of the two cham-ber results, the measurements for each parameter were di-vided into data sets for the individual chambers using the recorded valve switching times and the MATLAB software (The MathWorks, Inc.). Subsequently all values between 30 s and 4.5 min after switching were averaged. The mean values were used to calculate the ratio of value (COM-PASS2) / value(COMPASS1) using the COMPASS2 inter-val following the COMPASS1 interinter-val, which is the first to
be measured when starting the magnetic and the GROTEC valves. This assumes that no significant change occurs in any chamber in smaller time steps than 5 min.
3 Results
3.1 Determination of chamber residence time
Due to the unreactive properties of CO2, this gas was used as
a trace gas to determinate the residence time inside the ber. The gas was added into the inlet region of the cham-ber from a specific time on. At the outlet region the time-dependent rise of the CO2mixing ratio was measured by a
CO2-measurement device (BIOS® 100). The 50 % change
time between the initial and the final CO2-mixing value was
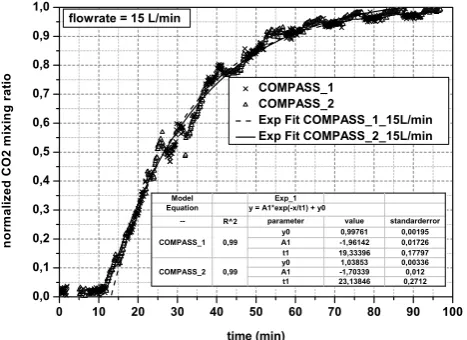
taken as the residence time for gases and aerosol particles in the central area of the chambers covered by the hopper-shaped outlet. An exponential fit of the normalised CO2data
vs. time was added to calculate the residence time with fol-lowing function:
y=A1exp
−x
t1
+y0, (1)
→xτ= −ln
y−y
0 A1
·t1. (2)
x represents the measured time,y the normalised CO2
mix-ing ratio, y0 the normalised initial CO2 mixing ratio and A1andt1 are fitting parameters. The residence timexτ can be calculated by Eq. (2) assumingy=0.5 andy0=0 by
ap-plication of the fitting values from Eq. (1) (Fig. 3).
The derived residence time, xτ, was found to change between 22 and 36 min as flows varied between 10 and 20 L min−1(Table 3). In this context the value at 10 L min−1 (COMPASS1) was excluded from further analysis because of the heat exhaust of an oven close by that was turned on during this particular measurement. Using all residence time values except the discarded one the relation between flow rate and mean residence time for both identical chambers becomes xτ =
(264.0±11.7)L
flow rate +(9.3±0.8)min. (3) The residence time used for ambient measurements at 15 L min−1was derived as (26.5±0.3) min for the reference
3412 B. Bonn et al.: COMPASS
Figure 3
Fig. 3. Measured temporal pattern of the normalised CO2mixing
ratio at the outlet at a flow rate of 15 L min−1 at a sudden CO2 increase at the inlet. Exponential fitting of the data points for calcu-lation of the residence time.
3.2 Determination of the loss rate of the chambers
3.2.1 Gas dry-wall loss rate
The reduction of a chemically inert trace gas between inlet and outlet is based on gaseous diffusion and dry deposition to and as well as leakage through the chamber walls (wall loss) if the trace gas is not sticky and does not get lost on aerosol surfaces. In this case an identical sampling line has been used to measure the relative reduction of the CO2
mix-ing ratio from the inlet to outlet. The wall leak rate of inert gases is described by the following equation (Seinfeld and Pandis, 2006):
vmrCO2=vmr0,CO2·exp(−kleak,gas·xτ), (4)
with vmrCO2= CO2 – volume mixing ratio at inlet;
vmr0,CO2= CO2volume mixing ratio at outlet;kloss,gas= dry
gas-phase loss rate;xτ= residence time.
Restructuring Eq. (4) the variableklossresults in: kdep,leak=ln
vmr
0,CO2
vmrCO2
· 1
xτ
. (5)
With this the mean kleak,gas was obtained as (1.3±0.6)×
10−5s−1. Both chambers show identical results within the range of uncertainty, having values that are in the range of laboratory-derived values (Table 4). The total loss rate of gases includes not only leak rate, but also the rate of the dry deposition onto the walls’ surface (sticking). This total loss rate was extrapolated from the particle loss rate to molecular sizes with 1 nm in spherical diameter (Sect. 3.2.2)
3.2.2 Particle loss rate
For determining the particle dry wall loss rates, the same ap-proach as in case of the gas wall loss rate was applied for
Table 3. Calculated residence timexτ and standard deviationσ by using the measured CO2mixing ratio for flow rates of 10, 15 and 20 L min−1between measurement and reference chamber. The ad-ditional flow rate of the CO2was (30±1) mL min−1.
flow
rate (L min−1) chamber xτ (min) σ (xτ)(min)
10 COMPASS1 35.9 0.2
COMPASS2 38.4∗ 0.4∗
15 COMPASS1 26.6 0.4
COMPASS2 26.5 0.3
20 COMPASS1 23.1 0.4
COMPASS2 22.3 0.4
∗The value was excluded from intercomparison due to external heat impact but
is shown for completeness.
individual particle sizes:
Cparticle(Dp)=C0,particle(Dp)·exp(−kloss,part·xτ), (6) with Cparticle= particle concentration at outlet; C0,particle= particle concentration at inlet (aerosol
dy-namic corrected); kloss,part= loss rate [s−1]; xτ= residence time [s].
And againkloss,partbecomes kdep,loss(Dp)=ln
C
0,particle(Dp) Cparticle(Dp)
· 1
xτ
. (7)
Due to the residence time of 26.6 min at a flow rate of 15 L min−1 inside any chamber, notable aerosol dynamics
will affect particle concentrations. Those include the forma-tion, coagulation and coalescence as well as the loss of parti-cles and will have effects on the size distributions to be cor-rected for intercomparison purposes. However, since the lo-cal formation of particles still remains an aspect not fully understood and might be partially related to traffic emis-sions, this process is assumed to compensate for the surface losses in the smallest size range most. Because of that, parti-cles in the size range below 50 nm in diameter was excluded from the fitting. Because of the relevance of aerosol dynamic contributions, the dynamical effect was calculated using an aerosol dynamics box model (Jacobson, 2005) in MATLAB 2009 (The MathWorks Inc., US). The model was initialised with the aerosol size distribution gained at the inlet from am-bient air at Campus Riedberg and calculated in 1s time steps for the entire residence time in the corresponding chamber. The size distribution derived from the aerosol dynamics com-putations after the residence time period therefore replaces the initial particle concentration in Eq. (7) to quantify the particle deposition onto the foil surface.
B. Bonn et al.: COMPASS 3413
Table 4. Calculated wall loss rate of gas with the measured CO2mixing ratio at the inlet and outlet region of the chamber.
Chamber VMR (inlet) (ppmv) VMR (outlet) (ppmv) kloss,gas(s−1) 1kloss,gas(s−1)
COMPASS1 828.3±6.3 815.2±3.3 1.0×10⁻⁵ 5.4×10⁻⁶ COMPASS2 752.4±8.7 734.1±3.2 1.6×10⁻⁵ 7.8×10⁻⁶
Figure 4
Fig. 4. Observed normalised particle number and volume concen-trations at the inlet and outlet of the reference (COMPASS1) and modification chamber (COMPASS2). Normalisation was based on the maximum of COMPASS1.
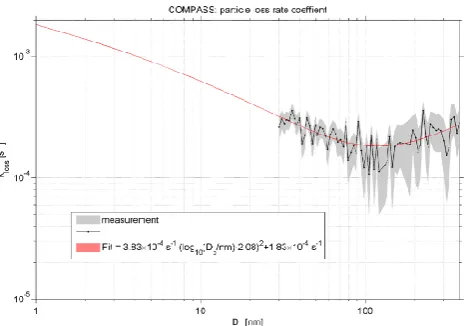
The differences may partially originate from a non-stable ini-tial aerosol, and therefore different diffusion mixing within the two chambers. However, the values of both chambers dis-play no significant difference. The total loss rate of particles per second is provided in Fig. 5. Therefore, the fit of the mean values between 50 and 422 nm in particle diameter is used. Since ambient air was used for testing, smaller particles may be affected by new particle formation and subsequent growth in both chambers (see above). Therefore, the size range of potential effects is excluded from the fit.
Above, the deposition rate declines to a minimum at nearly 250 nm. The average fit curve for both chambers is provided by
kloss,part=3.83×10⁻⁴s−1·(log10(Dp[nm])−2.08)2
+1.83×10⁻⁴s−1. (8)
This means that particles in such a size range pass the cham-ber with the smallest loss. As noted in Sect. 3.2.1, the gas loss rate was determined for a non-sticking gas (leak rate). If we extrapolate the particle-based loss rate, including stick-ing to the chamber wall surfaces, a loss rate of condensable gases ofkloss,stick,gas= (1.84±0.01)×10−3s−1is obtained.
Therefore sticking gases will get lost on the chamber walls about 100 times faster because of the different contributions of leak and wall deposition loss rates (compare Table 4), pro-viding a lifetime of sticking gases in the gas phase of about
Fig. 5. Dry particle wall loss ratekloss,partinside the measurement and reference chambers as a function of the particle size. The un-certainty ranges are displayed by the shaded areas. The fit for the average values of both chambers between 30 and 370 nm is shown in red and extended to molecular sizes.
9 min. As the extrapolated loss rate of particles to molecular sizes results in a total loss of about 92 % for sticky gases, we conclude that the use of two chambers is highly preferable for our kind of comparable effect studies.
3.3 Intercomparison measurement period
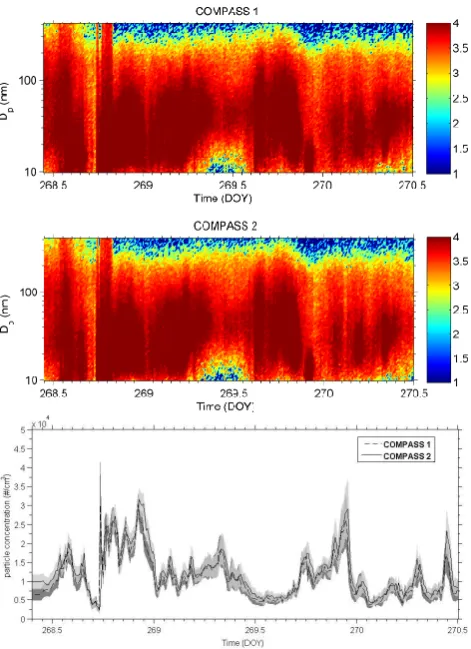
The intercomparison of both chambers at ambient conditions took place without any modifications in one of the chambers during September 2012 at the Riedberg campus of Frankfurt University. The results are displayed in Fig. 6. No difference is visible in the two size distribution measurements (top and centre plots), or in total particle number concentration (bot-tom graph), or in particle volume for more than two days at a variety of ambient conditions. Therefore the two chambers are considered to work identically.
3414 B. Bonn et al.: COMPASS
Figure 7
Fig. 6. Top and centre plots: particle size distribution dN/d log (Dp) at non-modified conditions for both chambers to indicate similarity (DOY 268–270, 2012). The colour bar is logarithmic scaled. Bot-tom: same for total particle number concentration.
formation process is mainly influenced by exhaust gas from automobiles. In this case the primary chemical substances are BTEX, NOx, SO2and polycyclic aromatic hydrocarbons
(PAHs).
The bottom graph in Fig. 6 shows the time-dependent particle concentration of both chambers. The maximal par-ticle concentration occurs around evening time, at 3× 10⁴particles cm−3. By contrast, the minimal particle concen-tration occurs about noontime, at 5000–104particles cm−3. The condition of higher traffic intensity during rush hour is supposed to control the height of the particle concentration at this time. In addition the uncertainty regions of both data series overlap continuously. So there are no significant dif-ferences between the measured particle concentrations of the two chambers.
4 Comparative measurements
For testing and investigation purposes, the novel twin cham-ber set-up was applied in two different environments: (a) the urban environment of Frankfurt am Main at the university
campus Riedberg (September/October 2012) and (b) the remote biogenically affected area at Taunus Observatory (Mt. Kleiner Feldberg, 825 m a.s.l.) at a spruce forest site dur-ing sprdur-ing 2013.
4.1 Urban environment (Frankfurt am Main)
The experiment conducted in Frankfurt was operated in two phases: phase 1 addressed an artificial rise in ambient ozone by positioning a pen-ray lamp with a wavelength of 253.7 nm in the inlet section (uppermost part) of COMPASS2, with protection from the lamps light for the reference chamber. Phase 2 focused on the impact of solar radiation by cover-ing COMPASS2 with aluminium foil to prevent radiation and heat from penetrating inside.
4.1.1 Phase 1 – test of urban conditions: ozone enhancement
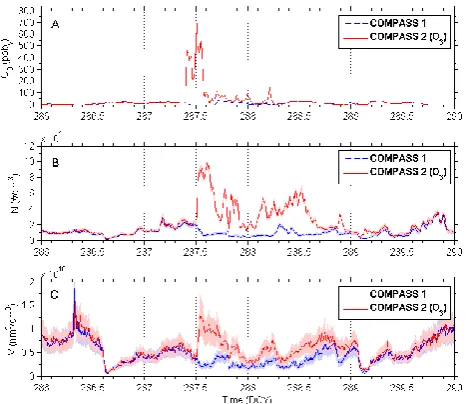
The impact of ozone was investigated between DOY 287.5 to 288.5 (start of October) and during a repetition in late November. The ozone mixing ratio climbed to values of 700– 800 ppbvin the modification chamber 2 and particle number
concentrations increased to a up to a concentration tenfold greater than that of reference chamber 1 (Fig. 7). It is of inter-est that the particular enrichment does not only occur at day-time, but also at nightday-time, although the ozone value enrich-ment was generally smaller than the maximum during 287 at noon (800 ppbv). This indicates a significant interaction
of ozone with not only direct particle precursor compounds, but also nitrogen oxide species during night. Because of this NO3 levels are supposed to be remarkably enhanced in the
modification chamber, leading to an enhanced oxidation ca-pacity during the night. During daylight the increased ozone will be photolysed, intensifying the OH production and the HOx-cycling (OH and HO2)at the same time. The notable
urban NO sink of these radicals is remarkably reduced due to their conversion to the less reactive and therefore longer-lived NO2. A repetition in November showed similar but
weaker increases in ozone as well as in number concentra-tions, indicating different source strength of precursors and smaller reaction rates. The volume concentration displayed a similar pattern and behaviour as the number concentration. However, the increase with ozone enrichment was less in-tense.
Figure 7 shows the measured ozone mixing ratio (panel a), particle concentration (panel b) and particle volume con-centration (panel c) in both chambers during the ozone ex-periment. In Fig. 7a, an increase of the ozone mixing ra-tio is observed in COMPASS2, reaching a maximum of nearly 700 ppbv. In contrast to that the ozone mixing ratio
in COMPASS1, which measured continuously under atmo-spheric background conditions, stayed at a quite lower level (around 30 ppbv). The maximal ozone mixing ratio in
B. Bonn et al.: COMPASS 3415
Figure 7
Fig. 7. Urban air (Frankfurt am Main): ozone mixing ratio (A), par-ticle concentration (B) and parpar-ticle volume concentration (C) dur-ing the ozone enhancement experiment (DOY 286–290). The ozone mixing ratio was increased in chamber 2 by pen ray (λ= 253.7 nm).
that it decreased to nearly 100 ppbv, which is still higher than
the ozone mixing ratio in COMPASS1 by factor of 3. Re-garding particle concentration (Fig. 7b) there were no differ-ences at the time period DOY 286–287.5, when the ozone mixing ratio was not increased. With the addition of ozone to COMPASS2, an increase in the particle concentration (up to a maximum of 105 particles per cm3) was observed. In the reference chamber, COMPASS1, the particle concentra-tion stayed at quite low levels. The complete particle size distribution between 9.6 and 422 nm in spherical diameter is provided in Fig. 8. The significance of the increase is appar-ent when comparing both data series between DOY 287.5 and 288.5. This is apparent in the scatter plot of measured ozone vs. total particle number concentration in both cham-bers (Fig. 9), too. A clear positive relationship for 30 min averaged time intervals is visible. For this plot six extraor-dinary ozone mixing ratios above 600 ppbvwith huge error
bars have been excluded. Please note that because ozone is not the direct particle precursor, but is involved in a set of chemical reaction steps depending on NOxas well as VOCs,
no linear behaviour was expected or observed.
In case of the particle volume concentration, there is a trend of rising identical to that of the particle concentration. The volume concentration in the COMPASS2 is significantly higher than in COMPASS2 during the ozone enrichment pe-riod (Fig. 7, lower plot).
Both increases, i.e. in particle number and volume concen-trations, at elevated ozone mixing ratios result in a significant increase in mode diameters of the particle number concen-tration (Fig. 10). The fitting was performed with Gaussian type curves at a maximum number of 3. In cases in which
Fig. 8. Particle size distribution plots during the urban ozone en-hancement experiment between the modified (COMPASS2, lower plot) and reference chamber (COMPASS1, upper plot). The colour bar displays the logarithmic scaled dN/d log (Dp) values.
a smaller number caused a better fit, the number of modes was reduced (Hussein et al., 2005). Atmospheric and ele-vated ozone derived values are marked with two different colours, the atmospheric ozone derived ones in black and the elevated ozone derived values in red. Please not the different symbols for individual modes.
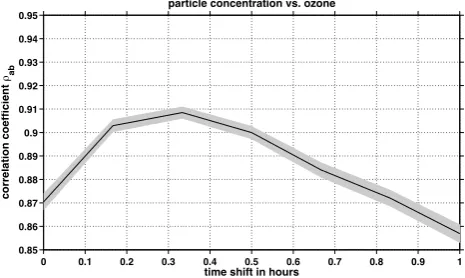
Figure 11 shows the cross-correlation between the differ-ence of particle concentration and ozone mixing ratio in both chambers. A clear correlation between these two parame-ters is observed with the maximal cross-correlation coeffi-cient of 0.9 at a time shift of (0.34±0.17) h or (20±10) min. The values of time shift above 0.34 h correspond to times at which the residence time of 26 min inside the chamber was exceeded. The scatter plot of the ozone concentration ratio of both chambers vs. the particle number concentration ra-tio indicates a linear rise by a factor of 2.8±0.3 for the city of Frankfurt at the start of October 2012. This means that if ozone increases by 10 %, the particle number concentration would rise by about 30 %, indicating that ozone is an impor-tant polluimpor-tant and precursor for ambient particles.
4.1.2 Phase 2 – tests at urban conditions: impact of solar radiation
3416 B. Bonn et al.: COMPASS
Fig. 9. Scatter plot of measured ozone mixing ratios and total par-ticle number concentrations above a diameter of 9.6 nm as 30 min averages in both chambers (unchanged in blue, elevated ozone in red). Three outliers between 600 and 800 ppb of ozone have been excluded.
Fig. 10. Mean mode diameters fitted to particle number size distri-butions measured in both COMPASS chambers. Elevated ozone is displayed in red, while normal conditions are shown in black.
Consequently the saturation vapour pressure of aerosol phase affine compounds drops and the chemical lifetime of re-active aerosol species increases. By contrast, new potential aerosol material is formed by hydroxyl radical reactions in the reference chamber. Comparing the importance of both aspects, the OH contribution seems evidently more impor-tant for (a) the number but also for (b) mass and volume, although warmer temperatures were present (Fig. 12). Both were lower in the covered chamber (COMPASS2) compared to the reference one (COMPASS1) except during night when no difference between the two chambers could be found. This is in line with the expectations.
Both investigations in the urban area of Frankfurt clearly demonstrate that ozone and solar radiation lead to an en-hanced particle number and mass concentration, i.e. issues for public health and therefore potential future problems.
Figure 11
Fig. 11. Cross-correlation of measured particle number concen-tration and ozone volume mixing ratio difference between COM-PASS2 (modified) and COMPASS1 (reference) during the ozone enrichment experiment (DOY 286–290, 2012).
Figure 12
Fig. 12. Particle number and volume concentration measurements during the period during which COMPASS2 was shaded from sun-light at urban conditions.
4.2 Remote region: Taunus Observatory, spruce forest
4.2.1 Impact of solar radiation and ozone
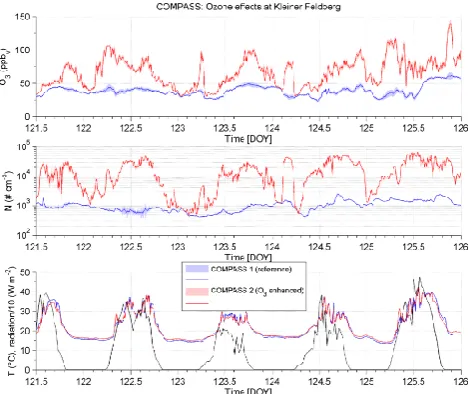
For investigating the local effect of ozone on new particle formation, a pen-ray with a wavelength maximum at 253.7 nm was mounted at the inlet of COMPASS2 and shielded in the direction of the reference chamber COMPASS1 in an identical way as was done for urban experiments.
In this period of observation, two phases were chosen: (A) only ozone was enriched and (B) ozone was enriched and radiation was reduced in COMPASS2.
Phase A – tests at remote conditions: (a) ozone enrichment
Because of the pen-ray lamp, the ozone value in COMPASS2 was kept constant above 100 ppbv(at minimum 1.5 to
B. Bonn et al.: COMPASS 3417
Fig. 13. Remote conditions at Taunus Observatory, Phase A: (top) Ozone mixing ratio in COMPASS1 (reference) and COMPASS2 (Ozone enhancement). (centre) Particle number concentration dur-ing the ozone increase experiment in both chambers and (bottom) temperature and global radiation in both chambers.
only a moderate increase at nighttime i.e. especially during periods with a relative humidity close to 100 %, and the ozone was most intense during daytime at driest environ-mental conditions. The ambient ozone mixing ratio itself displayed a typical daily cycle, varying between 30 ppbvat
minimum and 60 ppbvat maximum (mean: 47.9±6.1 ppbv)
in the reference chamber. The temperature in both chambers was 18.1±6.2◦C and no significant difference was observed between the two enclosures (1T =0.4±0.6◦C). The same applies for the relative humidity (RH) that was measured as 59±26 % with a difference of1RH = 0±2 %.
Particles
With respect to total particle number concentration (N) the observations are evident above 3 nm in diameter. In every case ozone is significantly enhanced, (Fig. 13a) the total particle number concentration increased remarkably (ca. +75 % ppbv−1 of ozone increase, Fig. 13b). While
temperatures and relative humidity in both chambers are measured identically (Fig. 13c) and no indication for a difference in solar radiation is available, the presence of ozone and thus a subsequent reaction with an aerosol particle precursor gas evidently causes the increase. In some cases the measured particle number concentration even exceeded the upper detection limit of the particle counter (105# cm−3) (Fig. 13b) and no further rise could be quantified.
Fig. 14. Ozone enhancement and reduction of solar radiation in COMPASS2 at Taunus Observatory, Phase 2: (top) ozone mixing ratios in COMPASS1 and 2 as well as global radiation at the site of interest. (bottom) Effect on particle concentration measured.
Gases
When enhancing only ozone, several oxidative VOCs (presumably oxidation products of terpenoids such as mono-and sesquiterpenes) indicate a clear rise (Table 5): form-and acetaldehyde, acetone form-and the molar mass 72 (poten-tially propene, butanal or butanone). Formic acid increases while acetic acid decreases. No clear change is observable for mono- and sesquiterpenes, although a tendency for reduction is apparent. This can be understood especially for sesquiterpenes because of their primary constituent, β caryophyllene, and the short atmospheric lifetime (of less than a minute) and the scattering of observations around detection limit (ca. 10–20 pptv). These reactive gases will
not pass the enclosure. But the notable increase of oxidation products within the residence time of ca. 27 min within the chambers indicates a notable chemical conversion and time for further growth. The surrounding forest (i.e. spruce) is no predominant isoprene emitter, and so a difference of very small mixing ratios is hardly detectable.
Phase B – tests at remote conditions: ozone enrichment and solar radiation reduction
Particles
3418 B. Bonn et al.: COMPASS
Table 5. Impact of solar radiation and ozone on VOC mixing ratios observed. Bold marked values indicate significant changes.
COMPASS2/COMPASS1 at COMPASS2/COMPASS1 at elevated O3
elevated ozone and reduced radiation
Molar mass Compound Nighttime (%) Daytime (%) All (%) Nighttime Daytime All
30 Formaldehyde +31.5±19.7 +20.0±11.1 25.5±16.0 +48.3±6.4 +35.4±12.4 +39.8±12.3
32 Methanol +4.5±4.1 +2.7±3.2 +3.3±3.4 −7.4±2.6 −10.1±4.0 −9.1±3.8
44 Acetaldehyde +11.7±5.0 +8.4±5.9 +9.9±5.4 +5.6±2.5 +5.8±5.8 +5.7±4.9
46 Formic acid −0.4±2.4 +0.6±11.1 −0.2+2.5 +1.8±2.0 +1.6±4.0 +1.7±3.5
58 Acetone +9.6±5.1 +5.0±5.2 +6.9±5.3 +4.7±2.0 +5.2±4.5 +5.0±3.8
60 Acetic acid −9.1±6.8 −7.6±9.5 −8.8±5.7 +10.4±5.4 +4.9±8.4 +6.8±8.0
66 Cyclopentadiene, −9.4±33.3 −5.4±30.8 −6.7±31.6 +11.4±53.9 +21.5±49.4 +18.0±51.1 malononitrile
68 Isoprene +1.3±7.8 +2.1±8.1 +1.6±7.6 +0.8±6.0 +1.3±7.4 +1.1±6.9
72 1-propene, butanal, +13.7±9.4 +7.6±7.3 +10.5±8.3 +2.6±3.6 +2.9±5.2 +2.8±4.7
2-butanone
78 Benzene +23.4±39.8 +20.0±37.5 +21.8±31.3 +25.6±34.0 +25.9±38.4 +25.8±36.8
81∗ MT fragment −5.0±7.3 −1.7±8.5 −3.4±7.6 −8.4±7.5 −8.0±9.6 −8.2±8.9
92 Toluene −0.5+30.6 +1.9±28.9 +1.3±29.9 −5.8±27.6 +3.1±25.2 ±0±26.3
136 Monoterpenes (MT) −5.2±15.5 −1.9±16.0 −3.4±15.3 −7.7±15.3 −11.7±16.9 −10.3±16.4 138 Nopinone, sabina ketone +5.7±44.3 +2.5±40.9 +4.3±43.5 +11.9±46.3 +7.7±41.5 +9.2±43.2 152 Methyl salicylate +24.6±80.3 +15.4±84.7 +17.4±82.0 +22.8±88.2 +31.9±94.6 +28.8±92.2
154 Linalool +8.6±50.3 +1.9±46.8 +3.75±46.5 +1.6±36.6 −0.3±32.1 +0.4±33.6
204 Sesquiterpenes −7.0±36.1 −7.0±36.1 −7.2±37.3 +5.5±31.6 +7.5±36.9 +6.8±35.1 ∗Primary fragment ion of monoterpenes (MT).
order to quantify the individual contributions the correlation coefficient ρ has been calculated for the rise in ozone as well as the present radiation in COMPASS1 (reference) and the particle number increase. Both values show a significant dependency:ρ(1O3,1N) = 73.8±0.4 at no time difference
andρ(radiation,1N) = 79.6±0.3 at identical time. However the correlation increases up to a value of 83.9±0.3 with a time shift (radiation earlier) by about 2.7 h. This indicates an earlier production of precursor gases by radiation or radiation-initiated chemistry (OH) in anticipation of some ideal conditions, such as the potential activation of nuclei. Thus, the ozone effect, where the correlation clearly declines with time shift between rise in ozone and in particles, is the limiting step. This becomes obvious in Fig. 15, in which the relative particle number enhancement in the case of the ozone-only experiment is split into different times of the day (day- and nighttime). The daytime data display a higher slope (ca.+100 % per ppbvof ozone) than the nighttime data
(ca.+17 % per ppbvozone), again indicating the importance
of solar radiation – potentially for OH and further radical production, but perhaps not during the residence time in the flow chambers. In this context it is interesting to note that the increase of ozone seems to occur primarily above ca. 35 ppbvof ambient ozone. This indicates a link to the ozone
stress-related emission of sesquiterpenes (Bourtsoukidis et al., 2012).
Fig. 15. Scatter plot of relative ozone vs. relative particle number increase at different times in COMPASS.
Gases
In this phase i.e. reduction of solar radiation, the ob-servations were slightly different than the previous ones (Table 5). Although both of the smallest aldehydes were observed to increase in the presence of ozone, too, methanol clearly reduced. Terpenes and their larger oxidation products only provide a tendency for reduction of terpenes and increase of oxidation products that is in line with enhanced ozone mixing ratios and presumably intensified atmospheric reactions in chamber 2. It is worth mentioning that the presence of NOx may cause notable contributions of the
B. Bonn et al.: COMPASS 3419
Figure 16
Fig. 16. Phase 3: experiment with external monoterpene (upper plot) supply to COMPASS2. Upper plot: monoterpene mixing ra-tio at the end of each chamber. Bottom plot: the rara-tio of 10 min averaged particle number concentrations of COMPASS2 to those of COMPASS1.
Impact of BVOCs
To test the influence of volatile organic compounds (VOCs) and their oxidation products on particle formation, two different biogenic VOCs were selected: (1) the monoterpene (C10H16)βpinene, which is expected to react primarily with
ambient OH-radicals (approximated daily average: ca. 80 % oxidation by OH), and (2) the sesquiterpene (SQT, C15H24) β caryophyllene, which is known to be quickly oxidised by the present ozone molecules (ca. 95 % of total sink). Next to the addition, the monoterpene is expected to start reacting with either of the two radicals (daytime: OH, nighttime: NO3). This leads to the formation of large organic peroxy
radicals (RO2) and several longer-lived products such as
nopinone. By contrast, the sesquiterpene reacts with ambient ozone, forming a large variety of products e.g. the Criegee intermediates (Criegee, 1975) and the intramolecularly formed secondary ozonide (Beck et al., 2011). Both biogenic volatile organic compounds (BVOCs) were added in a small bypass air flow of (10±1) cm3min−1to COMPASS2 using a permeation oven at a defined temperature. The oven temperature was set to (29±0.2)◦C in the case of the monoterpene (Phase C) and to (47.8±0.2)◦C in the case of the sesquiterpene (Phase D). Both compounds were monitored by the PTR-MS instrument at the outlet of the chamber.
During both terpene-addition related phases (C and D), temperature and humidity in both chambers were identical within the measurement uncertainties. This is why we will focus primarily on the gaseous, i.e. VOC, measurements. The VOCs measured by PTR-MS displayed several significant changes. Those are briefly summarised in Table 6 and will be discussed in the corresponding “Gases” sections follow-ing.
Phase C – tests at remote conditions: monoterpene addition
Gases
While a clear rise in monoterpene signal could be ob-served in phase C (Table 4, left), further VOCs indicated a clear rise either during nighttime or the entire time. The ones increasing all the time were methanol and mass 66 g mole−1(pres. cyclopentadiene or malononitrile), while formaldehyde, isoprene and toluene only displayed a sig-nificant change during nighttime. All of these observations may result from three different processes: (a) increased production by a specific monoterpene compared with a mixture of monoterpenes in the atmosphere, (b) a change in local sink intensity, i.e. a significant reaction with with OH but not with ambient NO3and finally (c) lower source
intensities i.e. lower emission and meteorological transport at nighttime. Further masses, such as nopinone, indicated trends but remained below the range of significance (one standard deviation).
Phase D – tests at remote conditions: sesquiterpene addition
Gases
In the case of sesquiterpene addition, no significant changes have been monitored for any VOC (Table 6, right). However, the ozone mixing ratio dropped due to the reaction with the sesquiterpene. Because of the very short lifetime of β caryophyllene (ca. 45 s), the increase was assumed to be identical with the drop in the ozone mixing ratio. Our observations indicate a rise between 0 and (4.5±1.5) ppbv.
As for monoterpene addition, several masses, i.e. presum-able oxidation products of β caryophyllene with ozone, displayed trends (e.g. in formaldehyde) but remained within the uncertainty range. Since the competitors in the case of ozone reactions are minor, the effects were found to be non-significant for other VOCs. But oxidation products with ozone are expected to be rather non-volatile and effects will primarily occur in the aerosol phase.
Particles
3420 B. Bonn et al.: COMPASS
Table 6. Impact of monoterpene (βpinene) addition on the VOC mixing ratios observed. Bold marked values indicate significant changes. Sesquiterpene (βcaryophyllene) addition did not show any significant changes due to high reactivity of SQTs and the fact that it was added in smaller amounts.
Molar mass Compound COMPASS2/COMPASS1 at elevated MT (g mole−1) Nighttime (%) Daytime (%) All (%)
30 Formaldehyde +7.0±5.4 +1.9±7.2 +4.6±6.9 32 Methanol -5.8±2.3 +6.4±2.6 −6.2±2.5 44 Acetaldehyde −0.8±2.0 +2.9±6.3 +0.7±5.5 46 Formic acid −0.4±2.4 +0.5±3.3 −0.1+2.8 58 Acetone −0.5±1.6 +1.5±4.9 +0.8±4.1 60 Acetic acid −0.2±0.4 0.0±5.4 +0.1±4.9 66 Cyclopentadiene, malononitrile +217.7±96.6 +123.5±30.0 +168.9±125.5 68 Isoprene +12.1±7.8 +5.4±9.5 +9.0±9.2 72 1-propene, butanal, 2-butanone −0.9±3.6 −0.6±5.8 +0.7±5.0 78 Benzene +23.7±26.5 +9.3±20.5 +14.3±21.3 81∗ MT fragment +452.8±138.8 +204.6±181.2 +252.8±210.6 92 Toluene 37.1+15.5 +20.0±24.1 +30.6±22.1 115 Proline −4.0±20.2 +0.3±21.2 −0.3±21.4 136 Monoterpenes (MT) +461.3±143.5 +222.3±190.2 +300.1±212.1 138 Nopinone, sabina ketone +10.0±12.9 +1.5±15.2 +5.8±15.0 148 MBO, SQT fragment −0.8±6.5 −0.1±5.9 −0.2±6.1 152 Methyl salicylate +11.5±67.1 −0.1±40.8 +0.1±42.1 154 Linalool +2.3±23.7 +0.7±21.3 +2.1±22.3 168 Pinonaldehyde, caronaldehyde, limona ketone +0.6±44.9 +0.3±40.3 +0.3±39.9 204 Sesquiterpenes +2.2±18.9 −0.8±17.5 −1.4±18.1
∗Primary fragment ion of monoterpenes.
limited at both stages, i.e. the cluster production or the activation. From our observations during the addition of the monoterpene, one would tend to say that the OH oxidation production takes place in the activation stage. By contrast the sesquiterpene-ozone production may contribute earlier and lack in activation around midnight, when favourable compounds such as OH- or NO3-driven products display a
minimum. Because of that, secondary oxidation products which are important for aerosol mass production will be formed less (Li et al., 2011).
This shows evidence that both BVOCs take place in the ambient particle formation process. However, the stage of impact, i.e. in the cluster formation steps or the activation of clusters, cannot be elucidated by the current measurements, since the available aerosol instrumentation was insufficient for that. This requires detailed future studies with either ion instruments or a CPC battery with the smallest size range of particles. Nevertheless, the difference in daily pattern is in agreement with the assumption of a stable cluster pool pro-duction below 2.7 nm in diameter, and a solar-radiation (OH) driven activation of these clusters.
5 Conclusions
The novel twin-chamber technique COMPASS has been shown to act as an appropriate tool for investigating the
impact and the role of different parameters and gases in the particle formation process under a variety of different condi-tions. The system is not necessarily limited to particles, but can be operated for cloud nuclei or gas-phase studies as well. The magnitude of the observed change depends on the res-idence time required for the particular process studied. This can be achieved by flow variation between 2 min (Re = 1150) and tenths of minutes, limited by the required sample flow rates. The flow system provides a laminar flow field as shown by FLUENT simulations, and uses two identical chambers for the evaluation of results, i.e. one reference and one exper-imental chamber for modifications. Because of the parallel operating chambers, wall loss is a minor process and its con-tribution will become important only at long residence times. Characterisations of both individual chambers demonstrated no significant change between the chambers. Therefore it is evident that the two function in an identical manner and that their application for measurements under atmospheric condi-tions is reasonable.
B. Bonn et al.: COMPASS 3421
Fig. 17. Phase 4: experiment with external sesquiterpene supply to COMPASS2. Upper plot: additional sesquiterpene mixing ratio as approximated by the difference in ozone mixing ratio between both COMPASS chambers (reference-modified one). Bottom plot: the ratio of the 10 min averaged particle number concentrations of COMPASS2 to those of COMPASS1. Note the time shift due to the residence time in the chamber by ca. 0.5 h.
Experiments in the urban air of Frankfurt clearly demon-strated the formation potential of particular number and mass based on ozone and solar radiation. Therefore this indicates a potential rise in particle mass during elevated ozone episodes as expected in future climate projections (Pachauri et al., 2007; Field et al., 2012). Based on our measurements in ur-ban and forested regions an important role of ozone in new particle formation is evident. Suppressing solar radiation re-duced the measured particle number and volume concen-tration. However, when both changes, i.e. ozone enhance-ment and radiation reduction, are overlapped, ozone seems dominant and may produce precursor gases or activating gases via an alternative pathway, such as NO3 production.
Adding volatile organic compounds (VOCs) such as mono-and sesquiterpenes lead to a clear rise in particle number, depending on the primary oxidant and the time of the day. While the monoterpeneβ pinene reacts primarily with OH the particle enhancement displays the same pattern as solar radiation. By contrast, the sesquiterpeneβ caryophyllene is oxidised by ozone resulting in a constant production of new particles. It is important to note that there is a minimum at
Fig. 18. Daily pattern of particle number concentration ratio of both chambers during both terpene additions, i.e.βpinene (MT, OH re-active) in black dots andβcaryphyllene (SQT, ozone reactive) in red dots.
midnight although ozone remains fairly constant. However, the nitrogen oxides decline and the nitrate radical production is drastically reduced. This may explain that although clus-ters are available, the ozone oxidation products are incapable to activate those on their own without a radical initiated ac-tivation. Since these new particles will grow further to sizes at which they alter the Earth’s radiation budget via cloud mi-crophysics, the understanding of the processes involved are key to elucidating future climate changes.
This demonstrates the wide range of measurements pos-sible that can increase understanding of the environmental processes affecting health, climate and feedback processes. The novel chamber seems to be an appropriate tool for that.
Acknowledgements. The authors would like to thank Efstra-tios Bourtsoukidis for support with respect to the PTR-MS measurements. Shang Sun was responsible for setting up the COMPASS chambers.
Edited by: H. Herrmann
References
Beck, M., Winterhalter, R., Herrmann, F., and Moortgat, G. K.: The gas-phase ozonolysis ofα-humulene, Phys. Chem. Chem. Phys., 13, 10970–11001, 2011.
Becker, K. H.: The European Photoreactor “EUPHORE”, Final re-port, Contract EV5V-CT92-0059, European Community, Wup-pertal, 1996.
3422 B. Bonn et al.: COMPASS
Bonn, B., Schuster, G., und Moortgat, G.: Influence of water va-por on the process of new particle formation during monoterpene ozonolysis, J. Phys. Chem., 106, 2869–2881, 2002.
Bonn, B., Korhonen, H., Petäjä, T., Boy, M., and Kulmala, M.: Understanding the formation of biogenic secondary organic aerosol fromα-pinene in smog chamber studies: role of organic peroxy radicals, Atmos. Chem. Phys. Discuss., 7, 3901–3939, doi:10.5194/acpd-7-3901-2007, 2007.
Bonn, B., Kulmala, M., Riipinen, I., Sihto, S.-L., and Ruuskanen, T. M.: How biogenic terpenes govern the correlation between sulfu-ric acid concentrations and new particle formation, J. Geophys. Res., 113, D12209, doi:10.1029/2007JD009327, 2008.
Bonn, B., Boy, M., Kulmala, M., Groth, A., Trawny, K., Borchert, S., and Jacobi, S.: A new parametrization for ambient par-ticle formation over coniferous forests and its potential im-plications for the future, Atmos. Chem. Phys., 9, 8079–8090, doi:10.5194/acp-9-8079-2009, 2009.
Bonn, B., Bourtsoukidis, E., Sun, T. S., Bingemer, H., Rondo, L., Javed, U., Li, J., Axinte, R., Li, X., Brauers, T., Sonderfeld, H., Koppmann, R., Sogachev, A., Jacobi, S., and Spracklen, D. V.: The link between atmospheric radicals and newly formed par-ticles at a spruce forest site in Germany, Atmos. Chem. Phys. Discuss., 13, 27501–27560, doi:10.5194/acpd-13-27501-2013, 2013.
Bourtsoukidis, E., Bonn, B., Dittmann, A., Hakola, H., Hellén, H., and Jacobi, S.: Ozone stress as a driving force of sesquiter-pene emissions: a suggested parameterisation, Biogeosciences, 9, 4337–4352, doi:10.5194/bg-9-4337-2012, 2012.
Burkholder, J. B., Curtius, J., Ravishankara, A. R., and Lovejoy, E. R.: Laboratory studies of the homogeneous nucleation of io-dine oxides, Atmos. Chem. Phys., 4, 19–34, doi:10.5194/acp-4-19-2004, 2004.
Criegee, R.: Mechanismus der Ozonolyse, Angew. Chem., 87, 765– 771, doi:10.1002/ange.19750872104, 1975.
Field, C. B., Barros, V., Stocker, T. F., Qin, D., Dokken, D. J., Ebi, K. L., Mastrandrea, M. D., Mach, K. J., Plattner, G.-K., Allen, S. K., Tignor, M., and Midgley, P. M. (Eds.): IPCC special report: Managing the Risks of Extreme Events and Disasters to Advance Climate Change Adaptation, Cambridge Univ. Press, Cambridge, UK, 2012.
Goldstein, A. H. and Galbally, I. E.: Known and unexplored organic constituents in the Earth’s atmosphere, Environ. Sci. Technol., 41, 1514–1521, 2007.
Hirsikko, A., Nieminen, T., Gagné, S., Lehtipalo, K., Manninen, H. E., Ehn, M., Hõrrak, U., Kerminen, V.-M., Laakso, L., McMurry, P. H., Mirme, A., Mirme, S., Petäjä, T., Tammet, H., Vakkari, V., Vana, M., and Kulmala, M.: Atmospheric ions and nucle-ation: a review of observations, Atmos. Chem. Phys., 11, 767– 798, doi:10.5194/acp-11-767-2011, 2011.
Holzinger, R., Lee, A., Paw, K. T., and Goldstein, U. A. H.: Ob-servations of oxidation products above a forest imply biogenic emissions of very reactive compounds, Atmos. Chem. Phys., 5, 67–75, doi:10.5194/acp-5-67-2005, 2005.
Hussein, T., Dal Maso, M., Petäjä, T., Koponen, I. K., Paatero, P., Aalto, P. P., Hämeri, K., and Kulmala, M.: Evaluation of an auto-matic algorithm for fitting the particle number size distributions, Boreal Environ. Res., 10, 337–355, 2005.
Hyvönen, S., Junninen, H., Laakso, L., Dal Maso, M., Grönholm, T., Bonn, B., Keronen, P., Aalto, P., Hiltunen, V., Pohja, T.,
Lau-niainen, S., Hari, P., Mannila, H., and Kulmala, M.: A look at aerosol formation using data mining techniques, Atmos. Chem. Phys., 5, 3345–3356, doi:10.5194/acp-5-3345-2005, 2005. Jacobson, M. Z.: Fundamentals of atmospheric modeling,
Cam-bridge University Press, 2nd Edn., CamCam-bridge, USA, 2005. Jimenez, J. L., Canagaratna, M. R., Donahue, N. M., Prevot, A. S.
H., Zhang, Q., Kroll, J. H., DeCarlo, P. F., Allan, J. D., Coe, H., Ng, N. L., Aiken, A. C., Docherty, K. S., Ulbrich, I. M., Grieshop, A. P., Robinson, A. L., Duplissy, J., Smith, J. D., Wil-son, K. R., Lanz, V. A., Hueglin, C., Sun, Y. L., Tian, J., Laak-sonen, A., Raatikainen, T., Rautiainen, J., Vaattovaara, P., Ehn, M., Kulmala, M., Tomlinson, J. M., Collins, D. R., Cubison, M. J., Dunlea, E. J., Huffman, J. A., Onasch, T. B., Alfarra, M. R., Williams, P. I., Bower, K., Kondo, Y., Schneider, J., Drewnick, F., Borrmann, S., Weimer, S., Demerjian, K., Salcedo, D., Cot-trell, L., Griffin, R., Takami, A., Miyoshi, T., Hatakeyama, S., Shimono, A., Sun, J. Y., Zhang, Y. M., Dzepina, K., Kimmel, J. R., Sueper, D., Jayne, J. T., Herndon, S. C., Trimborn, A. M., Williams, L. R., Wood, E. C., Middlebrook, A. M., Kolb, C. E., Baltensperger, U., and Worsnop, D. R.: Evolution of Organic Aerosols in the Atmosphere, Science, 326, 1525–1529, 2009. Kang, E., Root, M. J., Toohey, D. W., and Brune, W. H.:
Introduc-ing the concept of Potential Aerosol Mass (PAM), Atmos. Chem. Phys., 7, 5727–5744, doi:10.5194/acp-7-5727-2007, 2007. Karl, M. Brauers, T., Dorn, H. P., Holland, F., Komenda, M., Poppe,
D., Rohrer, F., Rupp, L., Schaub, A., and Wahner, A.: Kinetic Study of the OH-isoprene and O3-isoprene reaction in the atmo-sphere simulation chamber, SAPHIR, Geophys. Res. Lett., 31, L05117, doi:10.1029/2003GL019189, 2004.
Kirkby, J., Curtius, J., Almeida, J., Dunne, E., Duplissy, J., Ehrhart, S., Franchin, A., Gagne, S., Ickes, L., Kürten, A., Kupc, A., Met-zger, A., Riccobono, F., Rondo, L., Schobesberger, S., Tsagkoge-orgas, G., Wimmer, D., Amorim, A., Bianchi, F., Breitenlechner, M., David, A., Dommen, J., Downard, A., Ehn, M., Flagan, R. C., Haider, S., Hansel, A., Hauser, A., Jud, W., Junninen, H., Kreissl, F., Kvashin, A., Laaksonen, A., Lehtipalo, K., Lima, J., Love-joy, E. R., Makhmutov, V., Mathot, S., Mikkilä, J., Minginette, P., Mogo, S., Nieminen, T., Onnela, A., Pereira, P., Petäjä, T., Schnitzhofer, R., Seinfeld, J. H., Sipilä, M., Stozhkov, Y., Strat-mann, F., Tome, A., Vanhanen, J., Viisanen, Y., Vrtala, A., Wag-ner, P. E., Walther, H., WeingartWag-ner, E., Wex, H., Winkler, P. M., Carslaw, K. S., Worsnop, D. R., Baltensperger, U., and Kulmala, M.: Role of sulphuric acid, ammonia and galactic cosmic rays in atmospheric aerosol nucleation, Nature, 476, 429–434, 2011. Korhonen, P., Kulmala, M., Laaksonen, A., Viisanen, Y., McGraw,
R., and Seinfeld, J.: Ternary nucleation of H2SO4, NH3and H2O in the atmosphere, J. Geophys. Res., 104, 26349–26353, 1999. Kroll, J. H. and Seinfeld, J. H.: Representation of secondary organic
aerosol laboratory chamber data for the interpretation of mecha-nisms of particle growth, Environ. Sci. Technol., 39, 4159–4165, 2005.
Kulmala, M., Suni, T., Lehtinen, K. E. J., Dal Maso, M., Boy, M., Reissell, A., Rannik, Ü., Aalto, P., Keronen, P., Hakola, H., Bäck, J., Hoffmann, T., Vesala, T., and Hari, P.: A new feedback mecha-nism linking forests, aerosols, and climate, Atmos. Chem. Phys., 4, 557–562, doi:10.5194/acp-4-557-2004, 2004a.
Tam-B. Bonn et al.: COMPASS 3423
met, H.: Initial steps of aerosol growth, Atmos. Chem. Phys., 4, 2553–2560, doi:10.5194/acp-4-2553-2004, 2004b.
Kulmala, M., Vehkamäki, H., Petäjä, T., Dal Maso, M., Lauri, A., Kerminen, V.-M., Birmili, W., and McMurry, P. H.: Formation and growth rates of ultrafine atmospheric particles: a review of observations, J. Aerosol. Sci., 35, 143–176, 2004c.
Kulmala, M., Kontkanen, J., Junninen, H., Lehtipalo, K., Manni-nen, H. E., NiemiManni-nen, T., Petäjä, T., Sipilä, M., Schobesberger, S., Rantala, P., Franchin, A., Jokinen, T., Järvinen, E., Äijälä, M., Kangasluoma, J., Hakala, J., Aalto, P. P., Paasonen, P., Mikkilä, J., Vanhanen, J., Aalto, J., Hakola, H., Makkonen, U., Ruuska-nen, T., Mauldin III, R. L., Duplissy, J., Vehkamäki, H., Bäck, J., Kortelainen, A., Riipinen, I., Kurtén, T., Johnston, M. V., Smith, J. N., Ehn, M., Mentel, T. F., Lehtinen, K. E. J., Laaksonen, A., Kerminen, V.-M., and Worsnop, D. R.: Direct observations of at-mospheric aerosol nucleation, Science, 339, 943–946, 2013. Lelieveld, J.: A missing sink for radicals, Nature, 466, 925–926,
2010.
Lelieveld, J., Butler, T. M., Crowley, J. N., Dillon, T. J., Fischer, H., Ganzeveld, L., Harder, H., Lawrence, M. G., Martinez, M., Taraborrelli, D., and Williams, J.: Atmospheric oxidation capac-ity sustained by a tropical forest, Nature, 452, 737–740, 2008. Li, Y. J., Chen, Q., Guzman, M. I., Chan, C. K., and Martin, S.
T.: Second-generation products contribute substantially to the particle-phase organic material produced by β-caryophyllene ozonolysis, Atmos. Chem. Phys., 11, 121–132, doi:10.5194/acp-11-121-2011, 2011.
Lyubovtseva, Y. S., Sogacheva, L., Dal Maso, M., Bonn, B., Kero-nen, P., and Kulmala, M.: Seasonal variations of trace gases, meteorological parameters, and formation of aerosols in boreal forests, Boreal Environ. Res., 10, 493–510, 2005.
Merikanto, J., Spracklen, D. V., Mann, G. W., Pickering, S. J., and Carslaw, K. S.: Impact of nucleation on global CCN, At-mos. Chem. Phys., 9, 8601–8616, doi:10.5194/acp-9-8601-2009, 2009.
Neeb, P., Horie, O., and Moortgat, G. K.: The nature of the transi-tory product in the gas-phase ozonolysis of ethene, Chem. Phys. Lett., 246, 150–156, 1995.
Nölscher, A. C., Williams, J., Sinha, V., Custer, T., Song, W., John-son, A. M., Axinte, R., Bozem, H., Fischer, H., Pouvesle, N., Phillips, G., Crowley, J. N., Rantala, P., Rinne, J., Kulmala, M., Gonzales, D., Valverde-Canossa, J., Vogel, A., Hoffmann, T., Ouwersloot, H. G., Vilà-Guerau de Arellano, J., and Lelieveld, J.: Summertime total OH reactivity measurements from boreal forest during HUMPPA-COPEC 2010, Atmos. Chem. Phys., 12, 8257–8270, doi:10.5194/acp-12-8257-2012, 2012.
O’Dowd, C. D. and Hoffmann, T.: Coastal new particle formation: A review of the current stage of the art, Environ. Chem., 2, 245– 255, 2005.
Pachauri, R. K. and Reisinger, A. (Eds.) : IPCC 4th assessment re-port: Contribution of Working Groups I, II and III to the Fourth Assessment Report of the Intergovernmental Panel on Climate Change, Cambridge Univ. Press, Cambridge, UK, 2007. Paulsen, D., Dommen, J., Kalberer, M., Prévôt, A. S. H., Richter, R.,
Sax, M., Steinbacher, M., Weingartner, E., and Baltensperger, U.: Secondary Organic Aerosol Formation by Irradiation of 1,3,5-Trimethylbenzene-NOx-H2O in a New Reaction Chamber for Atmospheric Chemistry and Physics, Environ. Sci. Technol., 39, 2668–2678, 2005.
Rannik, Ü.: On the surface layer similarity at a complex forest site, J. Geophys. Res., 103, 8685–8697, 1998.
Ryding, M. J., Jonsson, Å. M., Zatula, A. S., Andersson, P. U., and Uggerud, E.: Reactions of H+ (pyridine)m (H2O)n and H+ (NH3)1 (pyridine)m (H2O)n with NH3: experiments and kinetic modelling, Atmos. Chem. Phys., 12, 2809–2822, doi:10.5194/acp-12-2809-2012, 2012.
Seinfeld, J. H. and Pandis, S. N.: Atmospheric chemistry and physics: From air pollution to climate change, 2nd Edn. Wiley Interscience, New York, 2006.
Slowik, J. G., Wong, J. P. S., and Abbatt, J. P. D.: Real-time, controlled OH-initiated oxidation of biogenic secondary organic aerosol, Atmos. Chem. Phys., 12, 9775–9790, doi:10.5194/acp-12-9775-2012, 2012.
Solomon, S., Qin, D., Manning, M., Chen, Z., Marquis, M., Av-eryt, K. B., Tignor, M., and Miller, H. L. (Eds.): Contribution of Working Group I to the Fourth Assessment Report of the Inter-governmental Panel on Climate Change, Cambridge University Press, Cambridge, UK, 2007.
Spracklen, D. V., Carslaw, K. S., Merikanto, J., Mann, G. W., Red-dington, C. L., Pickering, S., Ogren, J. A., Andrews, E., Bal-tensperger, U., Weingartner, E., Boy, M., Kulmala, M., Laakso, L., Lihavainen, H., Kivekäs, N., Komppula, M., Mihalopoulos, N., Kouvarakis, G., Jennings, S. G., O’Dowd, C., Birmili, W., Wiedensohler, A., Weller, R., Gras, J., Laj, P., Sellegri, K., Bonn, B., Krejci, R., Laaksonen, A., Hamed, A., Minikin, A., Harri-son, R. M., Talbot, R., and Sun, J.: Explaining global surface aerosol number concentrations in terms of primary emissions and particle formation, Atmos. Chem. Phys., 10, 4775–4793, doi:10.5194/acp-10-4775-2010, 2010.
Sun, T. S.: Construction, Online-Untersuchung und Modellierung von Parametern zur Beschreibung atmosphärischer Nukleation durch Simulationskammerstudien (COMPASS), Master thesis, Goethe University, Frankfurt/Main, 2013.