www.soil-journal.net/2/1/2016/ doi:10.5194/soil-2-1-2016
© Author(s) 2016. CC Attribution 3.0 License.
SOIL
Development of a statistical tool for the estimation of
riverbank erosion probability
E. A. Varouchakis, G. V. Giannakis, M. A. Lilli, E. Ioannidou, N. P. Nikolaidis, and G. P. Karatzas
School of Environmental Engineering, Technical University of Crete, Chania, Greece
Correspondence to: E. A. Varouchakis ([email protected])
Received: 2 May 2015 – Published in SOIL Discuss.: 11 June 2015
Revised: 16 December 2015 – Accepted: 21 December 2015 – Published: 15 January 2016
Abstract. Riverbank erosion affects river morphology and local habitat, and results in riparian land loss, prop-erty and infrastructure damage, and ultimately flood defence weakening. An important issue concerning river-bank erosion is the identification of the vulnerable areas in order to predict river changes and assist stream management/restoration. An approach to predict areas vulnerable to erosion is to quantify the erosion proba-bility by identifying the underlying relations between riverbank erosion and geomorphological or hydrological variables that prevent or stimulate erosion. In the present work, a statistical methodology is proposed to predict the probability of the presence or absence of erosion in a river section. A physically based model determines the locations vulnerable to erosion by quantifying the potential eroded area. The derived results are used to de-termine validation locations for the evaluation of the statistical tool performance. The statistical tool is based on a series of independent local variables and employs the logistic regression methodology. It is developed in two forms, logistic regression and locally weighted logistic regression, which both deliver useful and accurate results. The second form, though, provides the most accurate results as it validates the presence or absence of erosion at all validation locations. The proposed tool is easy to use and accurate and can be applied to any region and river.
1 Introduction
Riverbank erosion is a complex phenomenon resulting from various factors which affect the balance of ecosystems. It is also important from the geomorphological aspect as it also induces changes in the river channel course and in the de-velopment of the floodplain (Hooke, 1979; Bridge, 2003). Mass-failure processes constitute a significant source of sedi-ment in disturbed streams, which occur due to a combination of hydraulic and geotechnical processes that undercut bank toes and cause bank collapse (Simon et al., 2009). River-bank erosion is a natural geomorphologic process that affects the fluvial environment in many aspects: physical, ecological and socio-economical. It is the result of a complex interac-tion between the channel hydraulic condiinterac-tions and the phys-ical characteristics of the banks, both of which are highly variable in nature. Bank retreat affects the riverbed struc-ture and morphology as well as the floodplain morphology and the physical habitat. In addition, riparian land losses and
damage to human property and infrastructures lead to direct financial consequences. Moreover, turbidity increase, sedi-ment and debris transport, and flood defense weakening re-veal a complex combination of arising issues due to river-bank erosion. According to Atkinson et al. (2003), significant parameters affecting erosion are vegetation index (stability), the presence or absence of meanders, bank material (classifi-cation) and stream power. Other factors such as bank height, riverbank slope, river cross section width, riverbed slope and water velocity have also been reported to affect the erosion rate (Hooke, 1979; Abam, 1993; Winterbottom and Gilvear, 2000; Rinaldi et al., 2008; Luppi et al., 2009). Therefore, the identification of riverbanks which are vulnerable to erosion is of utmost importance, either for their protection or restora-tion.
the fluvial ecosystems, since it regulates the diversity of habi-tats, species and vegetal units. The process provides riparian vegetation succession and develops dynamic habitats, vital for fluvial plants and animals. For small-scale bank erosion or for local extent, there is no significant influence on the aquatic ecosystem and and contributes to its sustainability. In the opposite case, the ecosystem is significantly affected, while riparian land losses and damages occur, leading to ar-eas vulnerable to flooding (Piégay et al., 1997, 2005; Flor-sheim, 2008).
The bank erosion process is closely related to soil compo-sition of the riverbanks, and the erodibility factor is affected by the composition of sand, silt and clay. A high content of sand and silt leads to easily eroded soils since they are both fine in size and can be carried away by river flow. The most common type of bank structure is a stratified or interbedded bank of cohesive or non-cohesive layers. Riverbanks made up of non-cohesive soil are very erodible due to the low clay content and the weak erosion-resistant strength of the bank soil. Instead, cohesive soils have increased clay or clayey silt content and are more resistant to erosion. Non-cohesive soils erode as individual grains, while cohesive soils erode as ag-gregates. On the other hand, a bedrock bank is usually very stable and will only experience gradual erosion (Raudkivi, 1998; Roslan et al., 2013).
Although riverbank erosion is a common phenomenon, the prediction of the location and the extent of riverbank erosion is difficult. Therefore, a range of approaches and methods have been developed and tested. The most important issue concerning riverbank erosion is the identification of the areas vulnerable to bank erosion in order to predict changes in the river channel form and assist stream management/restoration options. Different methods have been used to predict erodi-bility, such as analyses of historical maps and the use of se-quential aerial photographs based on GIS technology. How-ever, riverbank erosion is usually approached by using a com-bination of bank stability methods and hydrodynamic models to predict the vulnerable areas and estimate the erosion rate (Nardi et al., 2013). Of these two methods, the former has a relatively high degree of inaccuracy, while the latter is too complex to be applied, as it requires a significant number of data variables.
Herein, a statistical tool is proposed using the logistic re-gression (LR) technique for the determination of riverbank erosion probability. This technique was selected due to its ability to link related dependent and independent variables by converting their relationship to a probability of presence or absence of the dependent variable. In addition, it can be extended to account for locally spatially correlated indepen-dent variables. The suggested statistical model, entitled lo-cally weighted logistic regression (LWLR), combines LR and locally weighted regression (LWR) principles to create a local model that calculates the probability of erosion oc-curring based on spatially correlated secondary information (e.g. bank slope, river cross section). Therefore, the accuracy
of the predictions is expected to improve compared to the global regression model LR.
The proposed statistical model identifies the underlying re-lations between riverbank erosion and the geomorphological or hydrological variables that prevent or stimulate erosion. It utilizes the available data to detect areas vulnerable to ero-sion. In addition, the erosion occurrence probability can be calculated in conjunction with the model deviance for each independent variable or model form tested. A similar method was introduced and applied successfully to a river in north-ern Wales (Atkinson et al., 2003), for the estimation of the variables that mostly affect riverbank erosion. The simple lo-gistic regression was applied.
This work also involves the application of the Bank-Stability and Toe-Erosion Model (BSTEM 5.2) in order to predict eroded or non-eroded riverbank areas for the vali-dation of the proposed tool. The BSTEM model is a phys-ically based model, developed by the National Sedimenta-tion Laboratory in Oxford, Mississippi, USA (Simon et al., 2000), and it has been used to simulate the hydraulic and geotechnical processes responsible for mass failure. It repre-sents two distinct processes, namely the failure by shearing of a soil block of variable geometry and the erosion by flow of bank and bank toe material. The BSTEM has been suc-cessfully applied in diverse alluvial environments (e.g. Si-mon et al., 2000, 2002; SiSi-mon and Thomas, 2002; Pollen and Simon, 2005; Pollen-Bankhead and Simon, 2009; Simon et al., 2011). It was used to simulate the effects of enhanced matric suction from evapotranspiration and decreased soil erodibility driven by the presence of plant roots, quantify-ing the effects on streambank factor of safety and comparquantify-ing with the effects of mechanical root reinforcement (Pollen-Bankhead and Simon, 2010). BSTEM was also used to quan-tify bank retreat, which ranged from 7.8 to 20.9 m along 100 m of riverbank at the Barren Fork Creek site (Midgley et al., 2012). In addition, it was also used to quantify the reductions of mass-failure frequency and sediment loading from streambanks in the Lake Tahoe in the USA (Simon et al., 2009).
2 Case study
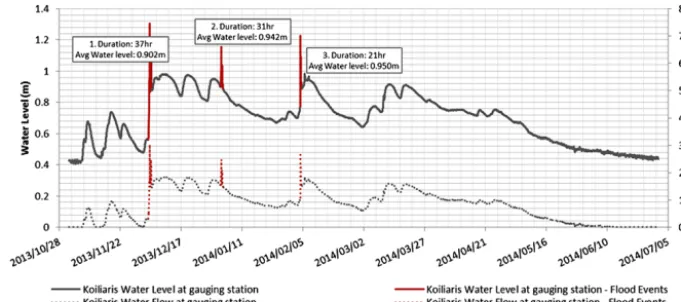
The Koiliaris River basin is situated 25 km east of Cha-nia (350◦260E, 240◦080N) and occupies an area of about 130 km2. Watershed elevation ranges from 0 to 2041 m a.s.l. with slopes ranging from 1 to 2 % at low elevations up to 43 % (high elevations). The total length of its hydrographic network is 36 km (Moraetis et al., 2010). The area has been studied extensively in the last 10 years and especially since 2009 as part of the European network of Critical Zone Ob-servatories (Koiliaris CZO). The Koiliaris River basin, as a typical Mediterranean watershed, is characterized by varying spatial and temporal hydrologic and geochemical processes. Lithology and geomorphology as well as the climatic con-ditions in the area have a major influence on the hydrologic characteristics of the Koiliaris CZO (Moraetis et al., 2014). The river is mainly fed by the Stylos karstic springs with water originating from the White Mountains and travelling through an extensive karstic system, which drains the rain and snowmelt at high elevations. It is also fed temporarily, during the rain period (October to April), by the Kerami-anos tributary stream. The KeramiKerami-anos is the main tempo-rary tributary, which drains a watershed sub-catchment char-acterized by steep slopes, schist geologic formation and de-graded erodible soils. As a result, when high rainfall intensi-ties occur over this area, especially after the dry summer pe-riod, surface runoff is induced, transferring large quantities of sediments to the Koiliaris River (flash floods) (Moraetis et al., 2010). During these events, river flow conditions change dramatically, with a rapid increase in water level and high flow velocities, affecting riverbank erodibility to the extent of causing bank failure. Such events occur two to three times a year during the rainy period, affecting the riparian area and enhancing soil losses through riverbank erosion. The cur-rent study focuses on the downstream section of the Koil-iaris River (Fig. 1). A hydrochemical station (gauging sta-tion) is strategically located at the intersection of the Koil-iaris River with the Keramianos tributary, recording the wa-ter level, which was used to generate the flow hydrograph (Fig. 2).
3 Methodology
The bank erosion vulnerability of the Koiliaris’ riverbanks was first studied during the hydrologic period 2010–2011. The downstream section of the river was divided into eight subsections of variable length, starting from the gauging sta-tion up to pin no. 8 on the study area map (Fig. 1). In each subsection, the geomorphological characteristics of the river-banks and the riverbed were measured at the beginning and at the end of the subsection, during the first field campaign. Channel and bank geometry characteristics, flow parame-ters, bank material, bank vegetation and protection param-eters were identified and used as input to the BSTEM model to calculate the riverbank eroded area (L2).
Figure 1.The downstream part of the Koiliaris River, located in the western part of the island of Crete. The yellow pins represent the measurement locations, the red pins the validation locations and the green pin the gauging station located at the intersection of the Koiliaris River with the Keramianos tributary. A representation of the measured geomorphological values is provided in the upper left corner.
Therefore, reach slope varied between 0.0042 and 0.11 m m−1 and the bank material was set, after field mea-surements analysis, to “fine rounded sand” with an aver-age medium grain size of 0.3 (±0.06) mm. “Geyer willow” was selected from the predefined list to describe the bank vegetation with the assumptions of the plants age of about 100 years and 100 % contribution to assemblage. Addition-ally, for the locations where the bank was protected, the “boulders” choice was used to describe the bank material. Bank slope and river cross section measurements were sup-plemented by a second field campaign. Regarding the flow parameters, river water elevation was set to 1.27 m for a 48 h duration event, based on field data. The BSTEM model was then applied to determine the vulnerability of bank erosion at the under study river subsections. The model results, for such long distances (min=20 m and max=200 m), were in-terpreted as potential erosion vulnerability of riverbank, con-sidering the extent of the estimated eroded area.
At the beginning of hydrological year 2013–2014, a sec-ond field campaign was designed to identify this time spe-cific locations vulnerable to erosion. Twelve riverbank loca-tions were selected along the aforementioned eight subsec-tions and scaled sticks were installed. Two of those locasubsec-tions were selected at restored parts of the river section to monitor potentially stable riverbank points. Six months later, at the end of the wet period and after three flood events (Fig. 2 – Red peaks), the erosion sticks were visually inspected, dur-ing a field trip, to identify the presence or absence of erosion. Therefore, the eroded area was roughly estimated.
effi-Figure 2.Typical hydrograph of the Koiliaris River at the gauging station (November 2013–June 2014).
ciency. Thus, the endpoints of each subsection from the first campaign were used because an overall estimate of the river-bank vulnerability was available from the BSTEM results.
However, in order to verify the BSTEM prediction effi-ciency, it was decided that the model would be tested by us-ing the 12 locations of the second campaign. Based on the model’s efficiency and the quality of estimation, the reliabil-ity of BSTEM results was evaluated at the eight subsections of the aforementioned river section. The second BSTEM model application estimated the cumulative riverbank ero-sion effect for the three flash flood events (Fig. 2) at the 12 locations. The other parameters were similar for both model applications since the same river section was employed.
The BSTEM model results (at the 12 locations) together with field inspection were used to set up the statistical model by interpreting the erosion existence in terms of binary data (1=“presence of erosion” and 0=“no erosion”). The BSTEM model has the capacity to quantitatively calculate the eroded area (L2). The interpretation of the significance of the estimated eroded area was determined through a statisti-cal process that involves the 25th and 75th percentiles of the estimated values. Therefore, the eroded area can be classified into levels of significance. Below the 25th percentile the ero-sion is categorized as not significant (no eroero-sion) and above the 75th as significant. The in-between values are signified as erosion. The latter two fall in the “presence of erosion” category.
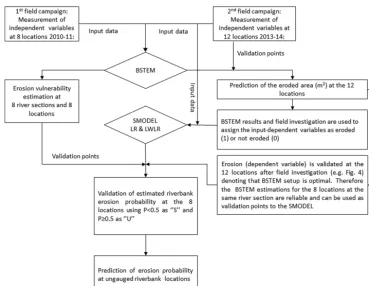
Next, the probability of erosion at the riverbanks of the Koiliaris River was estimated considering a series of easy-to-determine independent geomorphological variables (bank slope, river cross section) through LR and LWLR method-ologies, first at the validation points and then at ungauged riverbank locations. The methodological steps of the pro-posed tool and of the overall process are briefly described by a flowchart presented in Fig. 3.
3.1 Logistic regression
Riverbank erosion can be simulated by a regression model using independent variables that are considered to affect the erosion process. The impact of such variables may vary with geographical location, and therefore a spatially non-stationary regression model is preferred instead of a station-ary equivalent. Locally weighted regression (LWR) is pro-posed as a suitable choice. This method can be extended to predict the binary presence or absence of erosion based on a series of independent local variables by using the logistic regression (LR) model. It is referred to as locally weighted logistic regression (LWLR). The two independent variables considered herein were river cross section width and bank slope.
In statistics, LR is a type of regression analysis used for predicting the outcome of a categorical dependent variable (e.g. binary response) based on one or more predictor vari-ables (continuous or categorical). The method can be used along with LWR to assign weights to local independent vari-ables. LWR allows model parameters to vary over space in order to reflect spatial heterogeneity (Atkinson et al., 2003; Lall et al., 2006). The probabilities of the possible outcomes are modelled as a function of independent variables using a logistic function. LR measures the relationship between a categorical dependent variable and, usually, one or several continuous independent variables by converting the depen-dent variable to probability scores. Then, a LR is formed, which predicts success or failure of a given binary variable (e.g. 1=“presence of erosion” and 0=“no erosion”) for any value of the independent variables.
The LR model is based on the logistic function, a common sigmoid function. The mathematical form is represented by the following equation:
p(x)= 1
Figure 3.Process flowchart that presents the combined application of the BSTEM and of the proposed statistical model (SMODEL) based on LR principles. “S” and “U” correspond to stable and unstable riverbanks, respectively.
x=β0+
K
X
k=1
βkxk, k=1, . . ., K, (2)
where p(x) is the probability of the dependent variable, 0≤p(x)≤1, associated with a given location;Kis the num-ber of the respective independent variables;β0,βk,k=1, . . .
K are the logistic regression coefficients estimated from n sample observations; and xk are the independent variables (Menard, 2001; Atkinson et al., 2003; Ozdemir, 2011). The regression coefficients are estimated by using maximum like-lihood estimation.
The goal of LR is to derive estimates for the K+1 un-known parameters,β0,β1, . . . ,βK, by maximizing the like-lihood function given in Eq. (3):
L(β/y1, . . ., yn)= n
Y
i=1
(p(xi))yi(1−p(xi))1−yi, (3)
wheren is the sample size,xi represents the values of the independent variables for theith sample (Eq. 2),p(xi) is de-termined by Eq. (1) andyiis the value of the dependent vari-able for theith sample. As the equations are non-linear, the solution was numerically estimated using Newton’s method (Hosmer Jr. and Lemeshow, 2004).
LWR is an extension to the concept of general regres-sion. The difference between LWR and multiple linear re-gression is that, in LWR, the independent variables’ effect on the dependent one is weighted based on a weighted function in terms of their geographical location. Basically, LWR is a form of spatial data analysis that allows for the evaluation of a dependent variable, based on one or more local indepen-dent variables (Cleveland and Devlin, 1988; Brunsdon et al., 1996; Fotheringham et al., 2002; Atkinson et al., 2003; Lall et al., 2006). LWR is used to improve the results obtained with simple LR, allowing for the coefficientsβk to vary for each estimation point. In this work, the exponential (Eq. 4) and the tri-cubic (Eq. 5) weighting functions are used to as-sign weights to the observation points. The first was applied in a similar work (Atkinson et al., 2003), while the latter is a common, efficient weighting function that is used with LWR.
w(d)=exp (−d/a), (4)
w(d)= h
1− |d/ h|3i3,|d/ h| ≤1. (5)
3.2 Calculation of model deviance
The erosion occurrence probability can be calculated in con-junction with the model deviance. The reliability of both LR and LWLR is determined using the G statistic method. It is a simple and effective statistical approach to evaluate the model efficiency and the reliability of each of the indepen-dent variables tested. The model deviance is given by
D= −2 n
X
i=1
yiln p(x
i) yi
+(1−yi) ln
1−p(x
i)
1−yi
, (6)
where y is a binary variable that indicates the result of an experiment. The conditional probability of the effect to be present is expressed as P =(y=1|x)=p(x). Variable x=(x1x2, . . ., xK) denotes a series of independent variables. Probabilityp(x) is calculated as in Eq. (1),
p(xi)=
exp (β0+βkxk) 1+exp (β0+βkxk)
. (7)
TheGstatistic is given by
G=Dnull−Dk, (8)
where the termDnull denotes the deviance when the model is applied without independent variables, i.e. when p(x)= [1+exp (β0)]−1. Term Dk refers to the deviance for the model withkindependent variables. The difference between these two terms is often cited as a sign of goodness of fit. The greater this difference, the more important is the influence of the estimation variables used. The optimal result forDis zero (Hosmer Jr. and Lemeshow, 2004). The process of the proposed statistical model described above was implemented with original code developed in the MATLAB programming environment.
4 Results and discussion
The BSTEM model was validated for the predicted erosion (m2) after a field investigation that was performed at the end of the wet period of the hydrologic year of 2013–2014. The eroded area at each location was successfully predicted based on the field observations at the affected area. How-ever, quantified measurements at those points were not per-formed but rather only field inspection to validate that the BSTEM results are consistent with reality. During the inspec-tion, photographs were taken at some locations where the 50 cm scaled stick was placed to highlight the eroded area. However, only at the point with the most intense erosion, a close-up photo was taken and analysed to quantify the ero-sion.
The evaluation of the BSTEM model results involved the calculation of the percentiles used to categorize the signif-icance of the BSTEM calculated eroded area. The BSTEM
Figure 4.Photo highlighting the riverbank location (KI) with the most intense observed erosion accompanied by the appropriate scaled tools to provide a rough estimate of the eroded area.
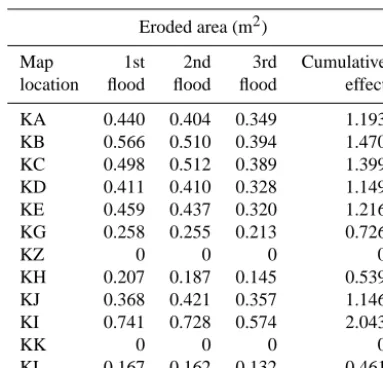
model results are in very good agreement with the behaviour of the banks after the flood events. Of the 12 measurement points, 4 were identified with no or low erosion, as the af-fected area was below or very close to the 25th percentile and equal to 0.52 m2(Table 1). In addition, the erosion sticks’ in-spection showed that the observed affected area at the four locations was limited considering that the bank form had not changed. The remaining eight points were identified as eroded and significantly eroded based on the model results for the affected area, while the bank form had changed at those locations. The affected area at the three significantly eroded locations ranged from 1.399 to 2.043 m2, close to and above the 75th percentile, which is equal to 1.38 m2. Loca-tion KI (Fig. 1) presented the most significant erosion effect. The predicted eroded area was equal to 2.043 m2and the af-fected area measured at the field (and represented in the mod-ified photo, Fig. 4) was roughly 2.08 m2. The situation is the same for the other locations. The statistical model input con-siders the 12 measurement locations as eroded or not eroded based on the BSTEM results and the observed bank forma-tion (Table 2).
The aforementioned results mean that the BSTEM out-come for the eight subsections of the first campaign can be also characterized as reliable, as they are located in between the 12 points that were successfully validated by the field inspection. The model outcome provided seven subsections with potential to erosion vulnerability and one not vulnerable to erosion, based on the estimated affected area in compari-son to the total area of the bank at the respective river sub-section. Therefore, they could be used as validation locations for the assessment of the statistical model performance.
Table 1. Amount of bank erosion at the measurement locations (Fig. 1). Modelling results obtained by BSTEM.
Eroded area (m2)
Map 1st 2nd 3rd Cumulative location flood flood flood effect
KA 0.440 0.404 0.349 1.193 KB 0.566 0.510 0.394 1.470 KC 0.498 0.512 0.389 1.399 KD 0.411 0.410 0.328 1.149 KE 0.459 0.437 0.320 1.216 KG 0.258 0.255 0.213 0.726
KZ 0 0 0 0
KH 0.207 0.187 0.145 0.539 KJ 0.368 0.421 0.357 1.146 KI 0.741 0.728 0.574 2.043
KK 0 0 0 0
KL 0.167 0.162 0.132 0.461
Table 2.Presence (1) or absence (0) of erosion at measurement lo-cations using a binary indication for the statistical model (LR and LWLR) setup based on inspection and BSTEM results. The third and fourth columns present the measured independent geomorpho-logical variables.
Map Presence/ Bank Cross location absence slope section of erosion (degrees) width (m)
KA 1 60 9.00
KB 1 75 9.25
KC 1 65 8.75
KD 1 55 9.00
KE 1 85 10.76
KG 1 60 11.55
KZ 0 75 10.00
KH 0 65 13.5
KJ 1 60 13.35
KI 1 75 7.60
KK 0 70 13.00
KL 0 50 9.00
points. The first BSTEM application has provided a vulner-ability assessment of the riverbank sections that these eight locations assign. The riverbank areas vulnerable to erosion, and therefore the associated locations are characterized as unstable (“U”) and the non-vulnerable as stable (“S”). Cor-responding to the LR and LWLR that deliver probabilities of erosion occurring, P ≥0.5 is interpreted as presence of erosion and is denoted as unstable and absence of erosion P <0.5 as stable. Therefore, the different statistical model forms are validated based on the erosion vulnerability of the eight locations of the first field campaign (Tables 3 and 4).
The results derived from the application of the LR model, with uniform parameters for all estimation points, are
pre-Table 3.Result of LR application at the eight validation locations (Fig. 1). The independent variables used and the BSTEM estimates are also presented. In the fourth column, S denotes stable and U unstable bank locations.
Validation Bank Cross BSTEM Erosion points slope section erosion (P) LR
(degrees) width (m) estimates
1 84 9.25 U 0.84
2 58 9.05 U 0.64
3 81 9.35 U 0.82
4 33 9.00 S 0.38
5 82.5 8.75 U 0.85
6 44 9.00 U 0.49
7 27 9.26 U 0.30
8 57 9.25 U 0.62
sented in Table 3. The values of the independent variables and the BSTEM erosion estimates at the validation points are also presented in the same table. The model deviance was calculated equal to 6.14 and theGstatistic was equal to 7.23. Results for the erosion probability at different ungauged lo-cations along the Koiliaris’ riverbanks obtained with the LR model are presented in Fig. 5a. The values for the indepen-dent variables were randomly selected from locations among the measurement points based on a 3-D digital model of the Koiliaris River, which was developed based on a 5 m digital elevation model (DEM).
On the other hand, results for the erosion probability at the validation points derived by applying LWLR with the expo-nential and the tri-cubic weighting functions are presented in Table 4. The graphical representation of the results for the erosion probability at the ungauged locations is provided in Fig. 5b and c for the exponential and tri-cubic functions, re-spectively. In the case of the exponential weighting function, the model deviance is equal to 6.27 and the G statistic is equal to 5.10, while in the case of the tri-cubic function, the model deviance is equal to 5.12 and theGstatistic is equal to 6.25.
val-Table 4.Result of LWLR application at the eight validation locations (Fig. 1). The LR estimates, the independent variables used and the BSTEM estimates are also presented. The diverged values are indicated in bold. In the fourth column, S denotes stable and U unstable bank locations.
Validation Bank Cross BSTEM Erosion Erosion Erosion point slope section erosion (P) LR (P) LWLR (P) LWLR (degrees) width (m) estimates (exp. model) (tri-cubic model)
1 84 9.25 U 0.84 0.85 0.86
2 58 9.05 U 0.64 0.58 0.74
3 81 9.35 U 0.82 0.75 0.87
4 33 9.00 S 0.38 0.27 0.25
5 82.5 8.75 U 0.85 0.81 0.82
6 44 9.00 U 0.49 0.54 0.53
7 27 9.26 U 0.30 0.21 0.52
8 57 9.25 U 0.62 0.64 0.73
Figure 5.Erosion probability predictions using (a) LR, (b) LWLR with the exponential weighting function and (c) LWLR with the tri-cubic weighting function versus variable independent values at random ungauged Koiliaris riverbank locations. The black dots indicate the eight validation points.
ues were derived from the 3-D river structure model as has previously been explained.
Both LWLR models involve a non-linear parameter in the weighting function that determines the correlation distance of the spatially correlated measurement points. The optimal distance in each case was calculated using a leave-one-out cross validation analysis, involving the measurement loca-tions. As a result, parameteraof the exponential weighting function was set to 600 m, and parameter hof the tri-cubic function was set to 400 m.
agree-ment with the BSTEM estimates at seven out of the eight validation locations, and the approach fails at only one val-idation location. The application of the LWLR model with the tri-cubic function leads to significant improvement in the estimates and to the accurate prediction of the erosion prob-ability at all eight validation locations. The significant result for this model was the validation of a clearly unstable point (pin no. 7) which has independent variables that should pro-vide a stable indication (as delivered by LR). Another point with similar characteristics (pin no. 4, Fig. 1) was correctly identified as stable. Therefore, such performance is possible only when local spatial weighting functions are used.
The only validation point indicated as stable (pin no. 4, Fig. 1) belongs to the fourth river section (between pins no. 3 and 4, Fig. 1), which as a whole was determined by BSTEM to be stable. However, two out of the three local measure-ments in the same section (pins KB and KC in Fig. 1) showed signs of erosion after the inspection. Generally though, apart from limited locations, the banks of that section did not show erosion signs due to the presence of dense seasonal riparian vegetation. The erosion probability estimation at this point is affected significantly, at local scale, by the spatially corre-lated measurement points with low vulnerability to erosion. Similarly, validation points 6 and 7 are also affected by the close presence of measurement locations with low vulner-ability to erosion. This explains the difficulty in predicting erosion at these points. The model results may confirm the presence or absence of erosion at the validation points, but they are quite different from the targeted values of zero for no erosion and one for erosion presence. This is expected to improve when a larger data set with greater variability in the independent variables’ effect on erosion becomes available.
The graphical representation of the LWLR model results at the discretized river section (Fig. 5b and c) shows a signif-icant difference in performance for the two weighting func-tions. The tri-cubic function (Fig. 5c) delivers more reliable results as it is clearly considers the variability in the inde-pendent variables inside the correlation distance. This can be observed through the colour variability in the graph of Fig. 5c, which represents the variability in the erosion occur-rence probability. On the other hand, the exponential func-tion (Fig. 5b) shows a smooth change in probability for the different pairs of independent variable values. This can be explained in terms of the function shape behaviour and the correlation distance. The tri-cubic function is herein applied in a shorter correlation distance according to the cross vali-dation results, which can capture the local dependence of the explanatory variables that, at longer distances, are smoothed due to the presence of more data.
The LWLR method with the tri-cubic function yields the highest value for theGstatistic for the selected independent variables. Therefore, it can be viewed as the optimum ap-proach to calculate the erosion presence probability at local scale. TheGstatistic can be also used to assess the impact on and importance of each independent variable for the
esti-mates. Each variable was separately applied in both LR and LWLR. TheGstatistic obtained its highest values when the cross section width was applied. The results of the statistical term improved by 12 and 20 % for LR and LWLR, respec-tively, compared to the bank slope application.
The LR-based models results suggest that riverbank ero-sion probability generally increases as the bank slope in-creases and the river cross section dein-creases. This is due to an increase in the flow velocity that removes the non-cohesive soil components from the banks. Based on field measurements analysis, the bank material at the Koiliaris River was classified as “fine rounded sand”. The fine rounded material is more easily removed due to its low resistance and increased flow friction. This characteristic is associated with the LR-based models’ results, as they provide mainly favourable probabilities of riverbank erosion at the validation points. However, in order to connect the soil properties’ ef-fect with the probability of erosion that results from geomor-phological variables in detail, the LR-based models should also account for soil properties, such as particle size distribu-tion and bulk density, which also consider mechanical prop-erties of the riverbanks. This is a task that the authors plan to address in research in the near future.
The proposed statistical model is a useful, fast, effi-cient and fairly easy to apply tool that requires information from easy-to-determine geomorphological and/or hydrologi-cal variables. This tool provides a quantified measure of the erosion probability along the riverbanks, and could be used to assist in managing erosion and flooding events. On the other hand, the BSTEM model can be successfully applied to de-termine the potential riverbank eroded area (L2). Both are useful, depending on data and software availability, in pro-viding information regarding the vulnerability of riverbanks to erosion.
5 Conclusions
The LR method performs satisfactorily in the plain form where uniform parameters are considered for all estimation points. A difference from the BSTEM results is observed only at two of the eight validation points. The LWLR method with the exponential weighting function gives results similar to those of LR. The LWLR method with the tri-cubic func-tion provides significantly improved estimates which coin-cide with the BSTEM results at all validation points. The graphical presentation of the results in the discretized river section shows that the erosion probability increases with bank slope and decreases with cross section width. This is also confirmed by the positive sign of the bank slope cients and the negative sign of the cross section width coeffi-cients in all LR applications. The deviance and theGstatistic results show that the cross section width parameter is more important than bank slope for the estimation of erosion prob-ability at the banks of the Koiliaris River.
This work presents the framework of a methodology that can be applied in order to estimate the probability of erosion at specific riverbank locations considering explanatory and easy to determine secondary variables. Channel geomorpho-logical characteristics, such as cross section and bank slope, are relatively easy to determine at unmeasured locations by using a digital elevation model. On the other hand, hydrolog-ical variables or bank material requires extensive field mea-surements in order for characteristic variables to be consid-ered as secondary information. Such measurements did not take place during the field campaigns as it was not in the context of this work. The developed statistical tool provides an alternative proposition for the estimation of riverbank lo-cations vulnerable to erosion, which requires limited infor-mation on explanatory variables yet can provide vulnerable location estimates with increased reliability. It is therefore considered a very promising approach for the estimation of riverbank erosion probability. The tool is proposed as a sup-plementary solution to the riverbank erosion identification is-sue.
Author contributions. E. A. Varouchakis developed the statisti-cal model and the model code and performed the simulations. Along with G. V. Giannakis, M. A. Lilli and N. P. Nikolaidis designed and carried out the field campaigns, and with the aid of G. P. Karatzas they analysed the collected data and the model results. E. Ioannidou performed part of the model simulations. M. A. Lilli and N. P. Niko-laidis applied the BSTEM model. Finally, E. A. Varouchakis pre-pared the manuscript with the contribution of all co-authors.
Acknowledgements. This work is part of a THALES project (CYBERSENSORS – High Frequency Monitoring System for In-tegrated Water Resources Management of Rivers). The project was co-financed by the European Union (European Social Fund – ESF) and Greek national funds through the Operational Program “Edu-cation and Lifelong Learning” of the National Strategic Reference
Framework (NSRF) – Research Funding Program: THALES. In-vesting in knowledge society through the European Social Fund.
In addition, the authors would like to thank the topical editor and the anonymous reviewers for their contribution to improve the manuscript.
Edited by: A. Millares
References
Abam, T. K. S.: Factors affecting distribution of instability of river banks in the Niger delta, Eng. Geol., 35, 123–133, 1993. Atkinson, P. M., German, S. E., Sear, D. A., and Clark, M. J.:
Ex-ploring the relations between riverbank erosion and geomorpho-logical controls using geographically weighted logistic regres-sion, Geogr. Anal., 35, 58–82, 2003.
Bridge, J. S.: Rivers and floodplains: forms, processes, and sedi-mentary record, Blackwell, Malden, Mass., USA, 2003. Brunsdon, C., Fotheringham, A. S., and Charlton, M. E.:
Geograph-ically weighted regression: a method for exploring spatial non-stationarity, Geogr. Anal., 28, 281–298, 1996.
Cleveland, W. S. and Devlin, S. J.: Locally weighted regression: an approach to regression analysis by local fitting, J. Am. Stat. Assoc., 83, 596–610, 1988.
Florsheim, J. L., Mount, J. F., and Chin A.: Bank Erosion as a De-sirable Attribute of Rivers, BioScience, 58, 519–529, 2008. Fotheringham, A. S., Brunsdon C., and Charlton, M.:
Geographi-cally weighted regression: the analysis of spatially varying rela-tionships, Wiley, Chichester, England, 2002.
Hooke, J. M.: An analysis of the processes of river bank erosion, J. Hydrol., 42, 39–62, 1979.
Hosmer Jr., D. W. and Lemeshow, S.: Applied logistic regression, John Wiley & Sons, Canada, 2004.
Lall, U., Moon, Y. I., Kwon, H. H., and Bosworth, K.: Locally weighted polynomial regression: Parameter choice and applica-tion to forecasts of the Great Salt Lake, Water Resour. Res., 42, W05422, doi:10.1029/2004WR003782, 2006.
Luppi, L., Rinaldi, M., Teruggi, L. B., Darby, S. E., and Nardi, L.: Monitoring and numerical modelling of riverbank erosion pro-cesses: A case study along the Cecina River (central Italy), Earth Surf. Proc. Land., 34, 530–546, 2009.
Menard, S.: Applied logistic regression analysis (Vol. 106), Sage Publications Inc., Thousand Oaks, California, USA, 2001. Midgley, T. L., Fox, G. A., and Heeren, D. M.: Evaluation of the
bank stability and toe erosion model (BSTEM) for predicting lateral retreat on composite streambanks, Geomorphology, 145– 146, 107–114, 2012.
Moraetis, D., Efstathiou, D., Stamati, F. E., Tzoraki, O., Nikolaidis, N. P., Schnoor, J. L., and Vozinakis, K.: High-frequency moni-toring for the identification of hydrological and bio-geochemical processes in a Mediterranean river basin, J. Hydrol., 389, 127– 136, 2010.
Nardi, L., Campo, L., and Rinaldi, M.: Quantification of riverbank erosion and application in risk analysis, Nat. Hazards, 69, 869– 887, 2013.
Ozdemir, A.: Using a binary logistic regression method and GIS for evaluating and mapping the groundwater spring potential in the Sultan Mountains (Aksehir, Turkey), J. Hydrol., 405, 123–136, 2011.
Piégay, H., Cuaz, M., Javelle, E., and Mandier, P.: Bank erosion management based on geomorphological, ecological and eco-nomic criteria on the Galaure River, France, Regul. River, 13, 433–448, 1997.
Piégay, H., Darby, S. E., Mosselman, E., and Surian, N.: A review of techniques available for delimiting the erodible river corri-dor: a sustainable approach to managing bank erosion, River Res. Appl., 21, 773–789, 2005.
Pollen, N. L. and Simon, A.: Estimating the mechanical ef-fects of riparian vegetation on stream bank stability us-ing a fiber bundle model, Water Resour. Res., 41, W07025, doi:10.1029/2004WR003801, 2005.
Pollen-Bankhead, N. and Simon, A.: Enhanced application of root-reinforcement algorithms for bank-stability modelling, Earth Surf. Proc. Land., 34, 471–480, 2009.
Pollen-Bankhead, N. and Simon, A.: Hydrologic and hydraulic ef-fects of riparian root networks on stream bank stability: is me-chanical root-reinforcement the whole story?, Geomorphology, 116, 353–362, 2010.
Raudkivi, A. J.: Loose boundary hydraulics, CRC Press, the Nether-lands, 1998.
Rinaldi, M., Mengoni, B., Luppi, L., Darby, S. E., and Mos-selman, E.: Numerical simulation of hydrodynamics and bank erosion in a river bend, Water Resour. Res., 44, W09428, doi:10.1029/2008WR007008, 2008.
Roslan, Z. A., Naimah, Y., and Roseli, Z. A.: River bank erosion risk potential with regards to soil erodibility, in: River Basin Manage-ment VII, edited by: Brebbia, C. A., Wessex Institute of Technol-ogy Press, UK, 289–297, 2013.
Simon, A. and Thomas R. E.: Processes and forms of an unstable alluvial system with resistant, cohesive streambeds, Earth Surf. Proc. Land., 27, 699–718, 2002.
Simon, A., Curini, A., Darby, S. E., and Langendoen, E. J.: Bank and near-bank processes in an incised channel, Geomorphology, 35, 183–217, 2000.
Simon, A., Thomas, R. E., Curini, A., and Shields, F. D.: Case Study: Channel stability of the Missouri River, Eastern Montana, J. Hydraul. Eng. ASCE, 128, 880–890, 2002.
Simon, A., Pollen-Bankhead, N., Mahacek, V., and Langendoen, E.: Quantifying reductions of mass-failure frequency and sedi-ment loadings from streambanks using toe protection and other means: Lake Tahoe, United States, J. Am. Water Resour. Assoc., 45, 170–186, 2009.
Simon, A., Pollen-Bankhead, N., and Thomas, R. E.: Development and application of a deterministic bank stability and toe erosion model for stream restoration, Stream Restoration in Dynamic Fluvial Systems: Scientific Approaches, Analyses, and Tools, American Geophysical Union, Geophysical Monograph Series, 194, 453–474, 2011.
Vozinaki, A. E. K., Karatzas, G. P., Sibetheros, I. A., and Varouchakis, E. A.: An agricultural flash flood loss esti-mation methodology: the case study of the Koiliaris basin (Greece), February 2003 flood, Nat. Hazards, 79, 899–920, doi:10.1007/s11069-015-1882-8, 2015.