Pediatric
Prehospital
Care
in Urban
and
Rural
Areas
James
S. Seidel,
MD, PhD*;
Deborah
Parkman
Henderson,
RN, MA*;
Patrick
Ward,
RN**;
Barbara
Wray
Wayland,
RN**;
and
Beverly
Ness,
RN**
From the Departments of *pediatrics and Emergency Medicine, Harbor-UCLA Medical
Center, UCLA School of Medicine, Torrance, California and the **Callfornia EMSC Project
ABSTRACT. There are limited data concerning pediatric prehospital care, although pediatric prehospital calls con-stitute 10% of emergency medical services activity. Data from 10 493 prehospital care reports in 11 counties of California (four emergency medical services systems in
rural and urban areas) were collected and analyzed. Com-panison of urban and rural data found few significant differences in parameters analyzed. Use of the emergency
medical services system by pediatric patients increased
with age, but 12.5% of all calls were for children younger
than 2 years. Calls for medical problems were most com-mon for patients younger than 5 years of age; trauma was
a more common complaint in rural areas (64%, P =
.0001). Frequency of vital sign assessment differed by region, as did hospital contact (P < .0001). Complete assessment of young pediatric patients, with a full set of vital signs and neurologic assessment, was rarely per-formed. Advanced life support providers were often on the scene, but advanced life support treatments and pro-cedures were infrequently used. This study suggests the
need for additional data on which to base emergency
medical services system design and some directions for
education of prehospital care providers. Pediatrics
1991;88:681-690; pediatric prehospital care, pediatric
emergency care, paramedic training, emergency medical technician training, emergency medical services, urban
areas, rural areas.
ABBREVIATIONS. EMS, emergency medical services; PCR, pre-hospital care report; EMT, emergency medical technician; BLS, basic life support; ALS, advanced life support; ATV, all-terrain vehicle; IV, intravenous.
Received for publication Jul 30, 1990; accepted Oct 11, 1990. Reprint requests to (J.S.S.) Dept of Pediatrics and Emergency Medicine, Harbor UCLA Medical Center, D9, 1000 W Carson, Torrance, CA 90509.
PEDIATRICS (ISSN 0031 4005). Copyright (C 1991 by the American Academy of Pediatrics.
Pediatric prehospital calls constitute 10% of
emergency medical services (EMS) activity in most
areas. There are, however, only a few published reports describing the population of pediatric pa-tients cared for in the prehospital setting.”2
To integrate EMS for children into existing EMS
systems it is necessary to have some knowledge
about the population using the services. This study
was undertaken to provide descriptive information
about the pediatric population using prehospital
care services. It was particularly important to
ob-tam more information about EMS in rural and
remote areas because of the lack of specific
infor-mation about services in these types of
communi-ties.
MATERIALS AND METHODS
Data were abstracted from prehospital care
re-port (PCR) forms from four EMS agencies: Los
Angeles County EMS Agency; Northern California
EMS (NorCal EMS) Agency, an agency covering
an eight-county region in northern California;
EMSA San Luis Obispo; and Santa Cruz County
EMS Agency. A standardized form was used for
data collection. The data form included all data
elements collected by the four EMS agencies in the
study regions, although no one agency collected all data elements on the form.
Pediatric patients were defined as 18 years of age
or younger. All EMS pediatric runs in northern
California, Santa Cruz, and San Luis Obispo for the period ofJanuary 1 through December 31, 1984,
were reviewed. A 3-month period, September 1
through November 30, 1984, was reviewed for Los
Angeles County, to correspond with the time period
of an existing extensive pediatric trauma data set.
pro-gram and outloaded to the UCLA biomedical
corn-puter facility for statistical analysis. Reliability of
computer data entry (98%) was tested by repeated analysis of a sample of data sets from the original report sheets.
Data collected included service times, year,
month, day, time of day of call, city, county, type
of responder agency, type of care provider, type of
transport, subject’s age, sex, chief complaint(s),
mechanism(s) of injury, base hospital contact,
physical assessment, field treatment, and
disposi-tion of patient. Rural communities were identified
by analysis of zip codes on the PCRs so that data
from rural and urban communities could be
com-pared. For this study, communities with a
popula-tion of 2500 or fewer were considered to be rural.3
Data were analyzed using Student’s t tests,
analy-sis of variance, and Mann-Whitney tests.
DESCRIPTION
OF THE
STUDY
AREA
The Los Angeles County EMS system covers one
of the largest counties in the United States, 4083
square miles in area. It is the largest EMS system
in the world. The Los Angeles County Department
of Health Services is the designated EMS agency
with responsibility for planning, monitoring, and
evaluating this system. There are 37 provider
agen-cies, 29 public and 8 private. Approximately 1357
paramedics, 4380 emergency medical technicians-I
(EMT-Is), and 4000 EMT-As are certified and
ac-tive in the system. In addition, there are more than
700 mobile intensive care nurses who direct the
paramedics via radio from the county’s 34 base
hospitals. All mobile intensive care units are staffed
by two paramedics and are dispatched through the
9-1-1 system; most ofthese county mobile intensive
care units do not transport patients-transport is
provided by private ambulance. A basic life support (BLS) unit with EMT-Is, usually fire fighters, is
most often the first unit on the scene, although a
paramedic unit may be dispatched at the same time as the first responder. An ambulance is called if transport is required but may also be dispatched simultaneously with the first responder or
par-amedic unit.
NorCal EMS is a public, nonprofit agency
di-recting public and private EMS providers in an
eight-county region in the northeastern portion of
the state. The area encompasses 29 576 square
miles and has a population of 435 300 persons. Prehospital responding personnel in this region are public, private, and volunteer. Population density varies in the region from 2.3 to 96.4 persons per square mile. Prehospital responders include
EMT-Is, EMT-IEMT-Is, paramedics, and nurses. There are no
official base hospitals in this area; many of the hospitals direct field care via radio.
San Luis Obispo County is located along the
coast between Los Angeles and San Francisco. It
has seven incorporated cities with between 10 000 and 40 000 persons. This county is primarily agri-cultural. EMSA San Luis Obispo is a nonprofit public corporation under contract to the county and is responsible for training of personnel, devel-oping policies and procedures, and monitoring the system. The county is serviced by EMT-Is and
EMT-IIs only. First responders may or may not be
certified as EMTs and include volunteer or paid
fire employees, law enforcement personnel, or
for-est rangers. The majority of advanced life support
(ALS) providers are EMT-IIs working for private
ambulance companies. There are two base hospitals
directing providers in the field.
Santa Cruz County is the smallest county in
California; it is bordered by the Pacific Ocean on
one side and mountains on the other. Although
only a short distance from major metropolitan areas in Santa Clara County as the crow flies, travel may
be lengthy and treacherous because of the winding
roads and bad weather. Two thirds of the county is forestland, mostly in the north, with rural and
remote communities. There is farmland in the
south with larger concentrations ofpopulation. The
total population is about 200 000 persons, which
may swell by 100 000 with weeekend tourism. The
EMS Agency is part of the County Health
Depart-ment. The county is serviced by public and private
provider agencies, some with EMT-Is, others with
EMT-IIs and/or EMT-paramedics. Two base hos-pitals in the county are staffed by mobile intensive
care nurses.
RESULTS
A total of 10 493 pediatric prehospital care runs were analyzed; of these, activity in Santa Cruz
comprised 481 runs; San Luis Obispo, 590; northern
California, 2426; and Los Angeles County, 6996. There were 9257 urban runs (88.2%) and 1191 rural
runs (11.4%). Data were not available on 45 PCRs
to determine the type of area.
Number
of Pediatric
Calls per Provider
An analysis of the pediatric runs per year in the
non-Los Angeles areas shows a wide variation in
the number of pediatric calls by individual
pro-viders. The range for number of pediatric calls was
from 0 to 305, with an average in the predominantly
rural providers of 16/year (NorCal), 23/year (Santa
Cruz), and 20/year (San Luis Obispo). Among
year (NorCal), 111/year (Santa Cruz), and 168/ year (San Luis Obispo). Two rural providers made
no pediatric runs and 13 made 1 run per year.
Responding
Agencies
The agencies responding to the calls depended
on the configuration of the EMS system (Table 1).
The types of first and second responders in this
study included fire fighters, private ambulance
per-sonnel, law enforcement personnal, forest rangers, volunteer fire fighters, lifeguards, and a small per-centage of other public EMS responders (Table 2).
Transportation
In all study areas, patients were most often
trans-ported by ambulance (73.7% of all runs). Transpor-tation of the patient to the receiving facility was by private auto in 14.3% of runs, fire department in 9.2%, and law enforcement personnel in 0.9% of
calls. Air transport was used primarily in the rural
areas of northern California, where fixed-wing air-craft was used in 1.8% of calls and helicopters in
1% of calls. In urban Los Angeles County, there
were only 42 helicopter field transports of pediatric
patients during the 3-month study period (0.6%).
Base Hospital
Contact
Base hospital contact was made 39.5% of the time in all regions combined. The NorCal region
had the highest percentage of calls with base
hos-pital contact: 88.9%. In San Luis Obispo County,
base contact was made for only 14.7% of calls,
Santa Cruz 43.9%, and Los Angeles 27.8%. Base
contact was less likely to be made in urban areas,
except in Santa Cruz County. Contact was made
more often for older pediatric patients and the decision to make contact did not correlate with the severity of illness or injury.4 The differences in base hospital contact between the regions was statisti-cally significant (P < .0001 for all).
Month,
Day, and Time of Calls
The busiest months for pediatric prehospital runs
in non-Los Angeles regions were May, June, July,
August, and September. In analyses using 2 tests
with Bonferroni’s adjustment for multiple
compar-isons, the number of runs was significantly greater than expected in the three non-Los Angeles regions
in August. Both San Luis Obispo and northern
California showed a significantly greater number of runs in June and a significantly lower number of runs in April and October.
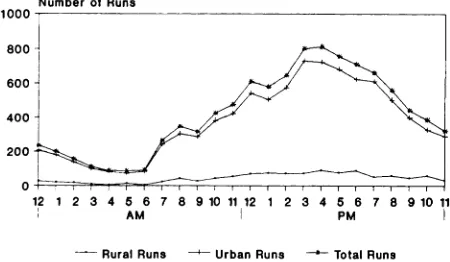
Number of prehospital care calls varied
signifi-cantly by day of week (Fig 1). Weekend vs weekday
runs were also compared; weekends were defined as
Friday, 4:00 PM, through Monday, 8:00 AM. In rural
areas, 52.9% of prehospital runs occurred on week-ends, 46% in urban areas. The distribution of runs
by mechanism of injury and chief complaint was
not significantly different on weekends and week-days, except for auto vs bicycle injuries (P =
.003),
skiing injuries (P < .0001), and all-terrain vehicle
(ATV) injuries (P = .006), which occurred primarily
on weekends. Only 961 (9.5%) ofthe total runs were
between 12:00 AM and 6:00 AM (Fig 2); more than
TABLE 1. Percent of First (and Second) Responding Agencies by Region*
Agency LA NorCal SLO Santa Cruz All Non-LA
Fire 99.4 (90.3) 32.3 (8.6) 4.8 (14.6) 50.9 (0.4) 30.1 (6.8) Law enforcement 0.4 (0.1) 3.4 (1.9) 0.3 (2.1) 3.0 (0.0) 1.2 (1.4)
Private ambulance 0.2 (9.6) 59.0 (85.9) 92.3 (83.3) 42.3 (99.6) 20.8 (89.3)
Lifeguard 0.0 (0.0) 0.0 (0.0) 0.0 (0.0) 2.4 (0.0) 0.3 (0.0)
Forestry 0.0 (0.0) 2.5 (0.1) 0.2 (0.0) 0.2 (0.0) 1.8 (0.1)
Volunteer fire 0.0 (0.0) 0.9 (0.1) 2.2 (0.1) 0.0 (0.0) 1.0 (0.1)
Other emergency medical 0.0 (0.0) 1.4 (3.3) 0.0 (0.0) 1.3 (0.0) 1.4 (2.3) services
Abbreviations: LA, Los Angeles; NorCal, Northern California; SLO, San Luis Obispo.
TABLE 2. Percent of First (and Second) Responding Personnel by Region*
Personnel LA NorCal SLO Santa Cruz All Non-LA
EMT-I 70.9 (10.2) 28.5 (18.8) 2.5 (9.1) 50.3 (0.4) EMT-II 0.0 (0.1) 22.5 (20.6) 97.3 (90.9) 0.0 (0.0) Paramedic 29.1 (89.6) 23.2 (35.8) 0.0 (0.0) 48.6 (99.6) Nurse 0.0 (0.0) 25.3 (24.5) 0.0 (0.0) 0.7 (0.0) Physician 0.0 (0.0) 0.4 (0.3) 0.2 (0.0) 0.4 (0.0)
26.9 (13.3) 33.2 (17.9) 22.7 (52.0) 16.8 (16.6) 0.4 (0.2)
* Abbreviations: LA, Los Angeles; NorCal, Northern California; SLO,
EMT, emergency medical technician.
Number of Runs
12 1 2 3 4 5 6 7 8 9101112 1 2 3 4 5 6 7 8 91011
AM PM
Number of Runs
1600
jJi
1400 1200 H 1000-1800J6OO4OO
I
2OO1
Mon Tue Wed Thu Fri Sat Sun
Rural 117 164 132 141 218 232 170
Urban 1160 1251 1239 1285 1475 1439 1164
Rurai Urban
Fig 1. Pediatric runs by day of week in urban and rural areas.
- Rural Runs -i---- Urban Runs
‘
Total RunsFig 2. Pediatric emergency medical services runs by hour of the day.
half of these (56%) were for patients between 14
and 18 years of age.
Age and Gender
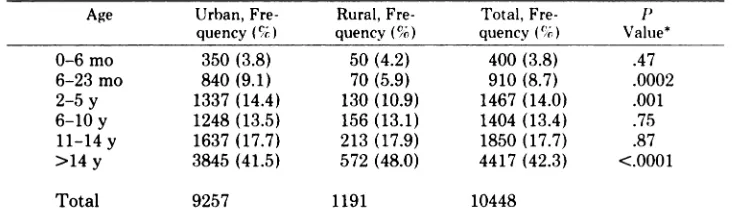
The age distribution of EMS calls, shown in
Table 3, differs significantly from the age distribu-tion of the general population.3 Fifty-eight percent of the calls were for males, 42% for females; there was no significant difference in this data point between urban and rural areas.
Complaint and Mechanism
Prehospital care calls were made for both medical problems and traumatic injuries (Fig 3). In rural and urban areas combined, calls were made for
traumatic injuries 57% of the time, medical
prob-lems 43%. In rural areas, calls were more often made for traumatic injuries (64%, P = .0001). The
most common types of prehospital runs recorded in all regions combined are shown in Table 4 (note
that many PCRs contained more than one chief
complaint), and the most common mechanisms of
injury are shown in Table 5. Vehicular injuries constituted 36% of all runs in rural and urban areas
combined. It is interesting to note that although
the relative number of assaults, gunshot wounds,
and stabbings was higher in urban areas, the per-centage of total runs in urban and rural areas was similar for violent acts (1% to 2%).
Vehicular injuries were most common reason for calls involving patients aged 2 through 18 years in urban areas and those aged 6 through 18 in rural areas. For children younger than 2 years of age, the majority of calls in both urban and rural areas were for medical problems.
Assessment
Patient assessment information included on
PCRs in all study regions consisted of vital signs, breath sounds, level of consciousness, skin signs, pupillary reaction, and (except in San Luis Obispo) Glasgow Coma Scale. Assessment of vital sign pa-rameters varied by type of vital sign, by region, and by age of child. Blood pressure was measured least often, 59% of the time; respiratory rate was
meas-ured 69% of the time; and heart rate was recorded
most frequenty, 76% of the time in the entire study group. Respiratory status was assessed in 61.6% of
all patients; descriptive terminology entered on the
forms by prehospital providers was not standard by region; it included such assessments as “wheezing,” “rales,” “stridor,” “decreased sounds,” “unequal sounds,” “retractions,” “apnea,” “congestion,” “noisy,” “rapid,” “labored.”
Skin color, which was assessed 85.5% of the time in all regions combined, was normal in 86.7% of cases. Skin temperature, assessed in 85.5% of runs, was normal in 89.5% of PCRs in which it was entered. Skin moisture was assessed with even less frequency-82.6% of the time; 86.6% of these as-sessments were normal. Capillary refill was rarely assessed: it was recorded for only 8% of the total pediatric runs in all regions (except for San Luis
Obispo, which did not include this as part of the
assessment). Most patients (95.7%) were found to
have normal capillary refill when this parameter
was assessed.
Pupillary response was recorded for 69.7% of
pediatric patients. Most of these (90.2%) were as-sessed as equal, round, and reactive to light and accommodation. Level of consciousness was as-sessed for 83.5% of pediatric patients-of these, 90% were alert, 5.8% responded only to verbal stimuli, 2.2% responded only to pain, and 2.7%
were unresponsive. Glasgow Coma Scale was
in-cluded on the PCR in all regions except San Luis
Number of Runs 4000
3000
2000
1000’
Fig 3. Type of prehospital call by age.
TABLE 3. Age Distribution of Emergency Medical Services Calls in Urban and Rural Areas
Age Urban,
Fre-quency ()
Rural, Fre-quency (%)
Total, Fre-quency ()
P
Value*
0-6 mo 350 (3.8) 50 (4.2) 400 (3.8) .47
6-23 mo 840 (9.1) 70 (5.9) 910 (8.7) .0002
2-5 y 1337 (14.4) 130 (10.9) 1467 (14.0) .001
6-10 y 1248 (13.5) 156 (13.1) 1404 (13.4) .75
11-14 y 1637 (17.7) 213 (17.9) 1850 (17.7) .87
>14 y 3845 (41.5) 572 (48.0) 4417 (42.3) <.0001
Total 9257 1191 10448
* Fisher’s Exact Test. Comparisons within an age group are relative to all other age groups
combined.
0L
0-8 moe 6-24 moe::::::::::
2-5 yrs 6-10 yr. 11-14 yre #{149}14 yr.
r
MedicalVehicular Assault ingestion
L#{149}1 Fail Bicycle Contact Sport
Drugs and Procedures
Oxygen was recorded as given in 2110 runs (23.4%) in all regions combined: 1831 times in urban areas, 279 in rural areas. Oxygen was not
used in 74.9% of cases with head trauma as a
complaint, and it was not used in 63.4% of cases
when respiratory distress was a complaint (Table
6). Nasal cannulas were used most often for oxygen
administration: 549 runs (418 urban, 131 rural),
followed by use of oxygen mask in 320 runs (249 urban, 71 rural).
Use of bag/mask device was recorded only 36 times. Use of endotracheal intubation was recorded for a total of 29 patients in all regions combined-26 in urban, 3 in rural areas. All but 3 of these intubations were performed in non-Los Angeles
counties because endotracheal intubation of
pa-tients younger than 14 years of age is not within the scope of practice for prehospital providers in Los Angeles County. Endotracheal intubation was
used most frequently for patients with complaints
of head trauma (10 patients), respiratory distress (5 patients), and full arrest (4 patients). Although
few patients were intubated, all ages were included:
8 patients were 0 to 6 months of age, 6 patients
were 6 to 24 months, 1 patient was in the 2- through
5-year age range, 4 patients were 6 through 10 years,
6 patients were 11 through 14 years, and 4 patients were older than 14 years.
More procedures were performed for trauma than
for medical problems. Short and long boards or other immobilization procedures were used a total of 3923 times in all areas (Table 7), although this procedure was used in only 40% of cases when the complaint was head trauma. Only 42 traction splints were applied (0.4% of all runs).
A total of 1205 intravenous (IV) lines were started on pediatric patients in all four regions. The number and percentage of IV lines ordered and started by age group increased with age of patient; well over half of the IV lines started in all regions
(740)
were for children older than 14 years.Lac-tated Ringer’s was the solution most often used
(418
times), closely followed by 5% dextrose (393 times). Normal saline solution was used less often (192 times), and 5% dextrose-lactated Ringer’s was used 42 times. Although most patients had multiple complaints, IV lines were started most often when there was complaint of an injury rather than amedical problem. Intravenous lines were started
most often when patient complaints were lacera-tions/avulsions (1607), abrasions/contusions
(1342), head trauma (1740), and single or multiple fractures (806). Intravenous lines were also started
when one of the patient’s complaints was seizures
(688 times), asthma and respiratory distress (650), ingestions/poisonings (627), altered mental status/ weakness/syncope (517), abdominal pain (357), and nausea, vomiting, diarrhea (275). Data were ana-lyzed to determine IV use and IV success rates by
age (Table 8).
Drugs were ordered only 577 times: 501 times in
urban and 76 times in rural areas (Table 9). Drugs
given fewer than five times in all runs included
TABLE 4. Chief Complaints for Urban and Rural Pediatric Prehospital Calls
Complaint Urban, No.
(%) Rural, No. (%) Both, No. (%) P Value* Head trauma Laceration/avulsion Abrasion/contusion Pain (knee) Seizures Pain (neck/back) Fractures Ingestion Respiratory distress Abdominal pain Full arrest
Sudden infant death syndrome
1810 (19.6) 1585 (17.1) 1334 (14.4) 1112 (12.0) 826 (8.9) 788 (8.5) 758 (8.2) 669 (7.2) 492 (5.3) 421 (4.6) 57 (0.6) 12 (0.1) 194 (16.3) 182 (15.3) 177 (14.9) 125 (10.5) 65 (5.5) 171 (14.4) 90 (7.6) 86 (7.2) 67 (5.6) 59 (5.0) 4 (0.3) 1 (0.1) 2004 (19.2) 1767 (16.1) 1511 (14.5) 1237 (11.8) 891 (8.5) 959 (9.2) 848 (8.1) 755 (7.2) 559 (5.4) 480 (4.6) 61 (0.6) 13 (0.1) .007 .12 .66 .14 <.0001 <.0001 .50 .99 .63 .51 .31 .99
* Fisher’s Exact Test.
TABLE 5. Types of Prehospital Calls in Urban and Rural Areas
Mechanism Urban Rural Total
Medical (nontrauma) 2600 108 2708 Vehicle (unspecified) 1214 61 1275
Fall 1122 95 1217
Ingestion 655 88 743
Auto vs auto 514 138 652
Auto vs pedestrian 345 19 364
Contact sports 299 59 358
Bicycle vs auto 250 24 274
Assault-blunt 253 15 268
Motorcycle 154 31 185
Bicycle (non-auto) 114 27 141
Gunshot 90 15 105
Burn 92 6 98
Drowning 51 7 58
Stabbing 48 5 53
TABLE 6. Use of Oxygen in Head ratory Distress Cases by Age
Trauma and
Respi-Age Head Trauma, Respiratory % Distress, 9
0-6 mo 18.18 23.07
7-24 mo 7.06 35.25
2-Sy 12.11 37.61
6-10y
19.48 61.5411-14 y 27.79 31.71
lS-l8y 27.08 43.56
rarely, for asthma; no differences between urban or rural areas were noted. Drugs were most often given to patients older than 14 years of age in both urban
and rural areas and were given only 19 times to
patients younger than 2 years of age in all regions
combined.
Times
of Runs
The range and standard deviation of these times
varied greatly, with ranges for call to scene of 1 to 130 minutes and 1 to 100 minutes in urban and
TABLE 7. Emergency Medical Services Treat ment by Setting
Treatment Urban Rural Total
Spinal immobilization 3445 478 3923
Dressings 977 124 1101
Splint 690 120 810
Monitor 591 42 633
Blood samples 247 19 263
Pressure to injury 137 46 183
Antishock garment 126 42 168
Cooling measures 120 32 152
Suction 63 21 84
Ice packs 62 19 81
Cardiopulmonary resuscitation 70 11 81
Defibrillation 2 2 4
Cardioversion 1 0 1
TABLE 8. Intravenous Lines: Ordering and Success Rates
Age No. of No. of Lines Success Fisher’s
Lines Or- Started Rate, P Value dered (% of
Total No.
in Age
Group)
0-24 mo 65 (5) 62 95.9 .99
2-Sy 84(6) 77 91.7 .19
6-10y 118(8) 106 89.8 .01
11-14 y 232 (13) 220 94.8 .07
>l4y 769(17) 740 96.2 .01
rural areas, respectively. Field times varied from 1
to 203 minutes and 1 to 103 minutes, with standard
deviations of 10.69 and 14.25 for urban and rural
areas (Table 10). The most significant differences between urban and rural run times were in call to scene, transport to the hospital, and total run times
TABLE 9. Frequency of Drug Administration in Urban and Rural Areas
Drug Urban,
No. (9)
Rural,
No. (%)
Total,
No. (%)
Naloxone hydrochlo- 139 (28) 16 (21) 155 (27) ride
Dextrose 50% 130 (26) 13 (17) 143 (25)
Ipecac 72 (14) 17 (22) 89 (15)
Diazepam 55 (11) 1 (1) 56 (10)
Epinephnine (1:1000) 51 (10) 2 (3) 53 (9) Epinephnine(1:10000) 14(3) 4(5) 18(3)
Morphine 7 (1) 6 (8) 13 (2)
Other 33 (7) 17 (22) 50 (9)
Totals 501 76 577
TABLE 10. Mean Times (in Minutes) of Pediatric Emergency Medical Services Runs in Urban and Rural Areas
Urban Rural All
Call to scene 4.96 9.34 5.39 Field time 14.37 16.32 14.58 Transport to hospital 9.76 19.95 12.82 Total run 31.94 44.02 34.12
extrication of the patient was required in only 6 of these long runs.
Form Completion
Entry completion on the PCRs ranged from 90%
in Santa Cruz to 53% in San Luis Obispo. Nineteen
parameters on the form were examined to
deter-mine the rate of data entry; in only 8 of these 19 parameters did prehospital care providers in all four study areas make entries more than 80% of the time. These data indicate only that there was often no entry on the form for the parameters analyzed; it is impossible to determine from this retrospective analysis whether the parameter was not assessed
or not recorded.
DISCUSSION
This descriptive study analyzed data from 10 493 pediatric prehospital care calls in 1 1 counties in California. It was surprising to note that this study
demonstrates relatively few significant differences
in prehospital care in urban and rural areas. Our
results confirm some of the published data from
Fresno County,2 such as time of day, day of week,
and month of the call; gender distribution; percent-age of trauma vs medical calls; and frequency of use of ALS skills. Other portions of this data set differ significantly, such as frequency of base hospital contact (which varied considerably by region from 14.7% to 88.9%), age distribution (which did not
show a bimodal curve), and IV insertion success
rates (which did not significantly vary between age groups [90% to 96% success rate]). This very large
data set also allowed us to analyze the use of various
assessment parameters and to compare provision of care in both urban and rural areas.
Two limitations were encountered in the process
of data collection. (1) The large number of patients
seen in the Los Angeles EMS system precluded
analysis of EMS data for an entire year, so data
were collected for a 3-month period to correspond
with an already available data set for trauma
pa-tients. A sample of pediatric EMS calls from 1986
showed similar results, however, suggesting that the
data are consistent and representative. (2) A major
problem with a retrospective study such as this,
which relies on data entry of a large number of providers, is ensuring the validity of the inconsist-ently recorded data on the forms. When data are missing from a form, it may mean that they were not collected, but it is also possible that they were
collected but not recorded. The wide variation in
data entry in all regions could be explained by several factors including the type of form used (fill-in or checklist), training of the providers, presence of on-line or off-line medical control, and the qual-ity assurance program of the EMS agency. In Los Angeles County and in other areas of the state, EMS providers often complete the PCRs when they are en route to, or after arrival at, the receiving
facility. This retrospective charting may lead to
error or omissions in documentation.
This study demonstrated many simiarities in the
provision of prehospital care to pediatric patients
in urban and rural areas; there were no significant differences between rural and urban areas in the month, day, time of day of the call; patient gender;
chief complaints; use of procedures; or drugs or IV
lines ordered or started.
The system was used for trauma in rural areas more than in urban areas (64%, P = .0001). These
data are similar to data collected in Fresno County
but differ from those collected for an earlier report
in Los Angeles.”2 The earlier study from Los An-geles was limited to patients 14 years of age and
younger, however, which may explain this
discrep-ancy. There were also fewer calls for children
younger than five years of age in the rural areas
and a higher frequency of violent acts such as
gunshot wounds, stabbings, and assaults in urban
areas.
The majority of calls were made in the late spring
and early fall, on weekends and between noon and 8:00 PM, when children are not in school. Calls made after midnight were primarily for adolescent trauma patients from motor vehicle accidents or
and medical problems used the system in the early
morning hours when there is no ready access to primary care providers. These patterns of EMS usage were similar in urban and rural areas.
Mechanisms of injury listed on the PCRs did not vary significantly except for ATV and recreational injuries. It is not surprising that almost all of the ATV injuries occurred in rural areas inasmuch as
ATVs tend to be used in less populated areas. Use
of ATVs, as well as other recreational activities
such as hunting, boating, and skiing, may place an added burden for services on rural EMS systems.
The low number of drownings (34) may represent
underreporting-these incidents may have been
re-corded under another heading, such as respiratory
distress, without a recorded mechanism of injury.
The frequency of use of the EMS system by
pediatric patients generally increased with age, al-though 12.5% of the calls were for children younger
than 2 years old. Medical problems were the most
common reason for calls for patients 5 years old
and younger, with respiratory distress and seizures
being the most common reasons for these calls. The
majority of cardiopulmonary arrests were in
chil-dren younger than 1 year of age, an age group for
which EMS providers may have the least
experi-ence and comfort in providing care.4
Assessment of the pediatric patients is problem-atic. Vital signs are measured less frequently in infants and young children than in older children.
Another published report demonstrated that vital
signs are measured more often in adults than in
children.4 This may be due to the providers’ lack of
training, experience, and confidence in assessing these age groups.4 Our data demonstrate that heart
rate was the most frequently measured vital sign
and blood pressure the least. Other than vital signs, assessment parameters most commonly used in-cluded pupillary size (70%) and level of conscious-ness (84%). Assessment ofcapillary refill was rarely
performed. Assessment of Glasgow Coma Scale,
although listed on PCRs, was also rare except in
Santa Cruz (93.6%), which has an active quality
assurance program. The use of assessment param-eters did not correlate with severity of injury or illness.
The type of responding unit varied with the
sys-tern and location. Urban areas generally have more
ALS providers, but it is interesting to note that
even in areas where ALS units responded to the
call, ALS procedures (drugs, IV access, defibrilla-tion, or intubation) were rarely used (1021 cases or 11% of the calls in urban areas and 142 [12%] in rural areas). The most frequently used procedures
were spinal immobilization and the provision of
oxygen by mask, both of which can be performed
by
a BLS provider. Intravenous lines were startedin 12.7% of the calls, and when ordered, they were successfully started in a majority of cases in all age groups. There was no correlation between the seri-ousness of the complaint and the ordering of an IV line. The low rate of endotracheal intubation can
be explained by the relatively few agencies training
ALS providers to intubate pediatric patients. There
is little evidence that this procedure improves out-comes, but studies in the literature have very small sample sizes, are not well controlled, and are there-fore not conclusive.5’6
It is not surprising that all components of the
total run time were longer in rural communities. No specific mechanism of injury or type of trauma or illness was prevalent in these long run times.
The relatively few long run times may reflect the
fact that in communities with long EMS response
times, families often transport ill and injured
chil-dren to the hospital without activating the EMS
system. Some communities in our study area do not have ready access to EMS services through a 9-1-1 system.
In some areas base hospital contact was rarely
made, so there was limited on-line medical control.
The seriousness of the complaint did not correlate
with base hospital contact.4 In San Luis Obispo
County, the low rate of contact (14.7%) can be
explained by the regulation in that county that base
hospital contact is required only if ALS procedures
are used.
CONCLUSION
This study has several implications for EMS
training in pediatric emergency care and for EMS
system design. Although the efficacy of various configurations for EMS response has not yet been compared with patient outcomes and needs to be
explored in the future, this study suggests that ALS
skills, although available in many areas, are used relatively infrequently for pediatric prehospital care
calls, particularly in urban areas. The use of these
ALS skills also did not necessarily correspond to the seriousness of the complaint.
The configuration of an EMS system and the
training of prehospital care providers should be based on the needs and resources of a particular community. Prehospital care providers properly
trained in BLS and some ALS skills, such as
ad-vanced airway management (bag-valve-mask yen-tilation and/or endotracheal intubation), vascular access, and the use of resuscitation drugs, may provide the essential services necessary to care for critically ill and injured children. It has not yet
pro-viders with a more extensive scope of practice is
related to improved outcomes. An alternative
sys-tern might be a two-tiered response in which the
level of care is determined by the dispatcher and/
or the first responding BLS unit (EMT-I).
Ad-vanced life support providers would respond only
to those calls requiring more sophisticated field interventions. In this type of configuration,
dis-patchers must also be carefully trained in pediatric
assessment so that the initial critical triage deci-sions are correctly made. Further study and analy-sis of data from adult and pediatric prehospital care may better define the resources necessary in EMS systems.
Our findings highlight the need for special
atten-tion to the inclusion of pediatric medical problems,
including respiratory distress and seizures, as topics
in training prehospital providers, as well as specific
training concerning emergency care ofyounger
chil-dren. The parameters and vital signs most
impor-tant in field assessment of pediatric patients and in
evaluating severity of illness or injury have yet to
be determined. Inasmuch as more sophisticated
assessment parameters were rarely used, perhaps
the methods of neurologic assessment used by
pre-hospital providers should be simplified and the
AVPU (assessment based soley on level of con-sciousness) system used.7 In California and
else-where, the EMT/paramedic training curriculum is
primarily diagnosis based.8 Training based on
pa-tient assessment may be of more use to prehospital providers in determining the severity of illness or
injury.
An EMS system must have data in order to
monitor and improve the quality of care and provide appropriate education for providers. Quality
assur-ance reviews, such as those performed in Santa
Cruz County (which has a 90% form completion rate), may have an important impact on data
col-lection. Santa Cruz has relatively few EMS
pro-viders and the EMS agency has a strong working
relationship with the providers, which makes this
type of program viable; in larger, decentralized sys-tems such as Los Angeles, where base hospitals have more responsibility for monitoring, form corn-pletion was less thorough. Until recently, there were
no computerized data available in Los Angeles
County, making countywide review activities
al-most impossible. Inconsistent and/or inaccurate
record keeping may have legal implications for the
system.9 The design of an EMS system should be
based on solid descriptive data.1#{176}This information,
along with the fiscal and community resources,
plays an important role in the determination of the
EMS services to be provided to a specific
popula-tion.”
The data reported present directions for further
study and research: (1) What training is necessary for BLS and ALS prehospital providers for provi-sion of critical support to infants and children in
the field?’2 (2) How can pediatric ALS skills be
maintained in areas where providers may see fewer
than five pediatric patients per year? (3) How
ac-curate are prehospital care providers’ assessments
in the field? (4) Would an assessment-based
edu-cational process be an improvement over the
diag-nosis-based curriculum currently used by many
agencies? (5) Should there be more on-line and
off-line medical control of providers, and how can this
be ensured? (6) How do the pediatric data reported
in this paper compare with adult data? (7) What is
the most accurate type of data collection
instru-ment for prehospital providers, and are there other
methods of obtaining accurate data in the
prehos-pital setting?
This study provides a beginning analysis of pe-diatric prehospital care in urban and rural areas; a prospective analysis will be necessary to correlate
prehospital care to outcomes in the pediatric age
group.
ACKNOWLEDGMENTS
This work was funded in part by a grant from the US
Department of Health and Human Services, Health
Re-sources and Services Administration, Bureau of Maternal and Child Health and Resources Development, through the California State Department of Health, Maternal and Child Health Branch (grant MCH-064001-01-3, State of California contract 87-91857).
We thank the following individuals for their assistance with this study: Truman Chaffin, Virginia Price Has-tings, and Peggy Stoker, RN, MA (EMS Division, Los Angeles County Department of Health Services); Marie Noel, RN (EMSA San Luis Obispo County); Don Hiatt, RN (Santa Cruz County Health Services Agency EMS);
Jack Becker (NorCal EMS Agency); Jacqueline Ward,
RN, Ed Melia, MD, and Marvin Crabb (Maternal and
Child Health Branch of the California State Department
of Health). We also thank Marianne Gausche, MD, and
Tnicia Walker for their help with organizing the data;
Peter Christenson, PhD, for his patience and persistence
in data analysis; and our student workers, Blanca Al-meida, Gene Brunak, and Nand Hart-Nibbnig, for their cheerful and loyal help.
REFERENCES
1. Seidel JS, Hornbein M, Yoshiyama K, et al. Emergency medical services and the pediatric patient: are the needs being met? Pediatrics. 1984;73:769-772
2. Tsai A, Kailsen G. Epidemiology of pediatric prehospital
care. Ann Emerg Med. 1987;16:284-292
Population Characteristics. Washington, DC: US Bureau of
the Census; 1982;1: Chap B
4. Gausche M, Henderson DH, Seidel JS. Vital signs as a part of prehospital assessment of the pediatric patient: a survey
of paramedics. Ann Emerg Med. 1989;19:173-178
5. Nakayama DK, Gardner MJ, Row MI. Emergency
endotra-cheal intubation in pediatric trauma. Ann Surg. 1990; 211:218-223
6. Aijian P, Tsai A, Knopp R, Kallsen G. Endotracheal
intu-bation of pediatric patients by paramedics. Ann Emerg Med.
1989;18:489-494
7. American Academy of Pediatrics and American College of Emergency Physicians. Textbook of Pediatric Advanced Life Support. Chicago, IL: American Heart Association; 1989;7
8. California Code of Regulations, Title 22, Social Services, Division 9, Prehospital Emergency Medical Services, chap
4, Emergency Medical Technicians-P, 1989
9. Selbst SM. Medical/legal issues in prehospital pediatric
emergency care. Pediatric Emerg Care. 1988;4:276-278 10. Seidel JS. Emergency medical services and the pediatric
patient: are the needs being met? II: Training and equipping emergency medical services providers for pediatric
emergen-cies. Pediatrics. 1986;78:808-812
11. Haller A, ed. Emergency Medical Services for Children: Re-port of the 97th Ross Conference on Pediatric Research. Columbus, OH: Ross Laboratories; 1989
12. Kane G, Engelhardt R, Celentano J, et al. Empirical
devel-opment and evaluation of prehospital trauma triage instru-ments. J Trauma. 1985;25:482-489
THE RAT’S NO GOOD
The weaknesses in asbestos and radon risk models are mirrored in studies of
other poisons, which are generally tested on laboratory rats. Here’s what
[Ronald] Hart [director of the National Center for Toxicological Research in Jefferson, Ark.] says about rat experiments: “Our risk models are based on at
least 50 assumptions, none of which have been scientifically demonstrated. For
example, we assume that there is no difference between continuous (as in
animal tests) or intermittent (as in human experience) dosages. But that ignores
our growing knowledge of the way in which DNA repairs the human system.”
. ..“We feed rodents ‘all-you-can-eat buffets’ every day, yet we know that
caloric intake is the single greatest contributing cause of cancer,” he says. “In
fact, we found you can modify the cancer-causing impact of one of the most potent carcinogens from 90% down to less than 3%, just by cutting caloric intake 20%.”
Brookes WT. The wasteful pursuit of zero risk. Forbes. April 30, 1990:161-172.
1991;88;681
Pediatrics
Beverly Ness
James S. Seidel, Deborah Parkman Henderson, Patrick Ward, Barbara Wray Wayland and
Pediatric Prehospital Care in Urban and Rural Areas
Services
Updated Information &
http://pediatrics.aappublications.org/content/88/4/681
including high resolution figures, can be found at:
Permissions & Licensing
http://www.aappublications.org/site/misc/Permissions.xhtml
entirety can be found online at:
Information about reproducing this article in parts (figures, tables) or in its
Reprints
http://www.aappublications.org/site/misc/reprints.xhtml
1991;88;681
Pediatrics
Beverly Ness
James S. Seidel, Deborah Parkman Henderson, Patrick Ward, Barbara Wray Wayland and
Pediatric Prehospital Care in Urban and Rural Areas
http://pediatrics.aappublications.org/content/88/4/681
the World Wide Web at:
The online version of this article, along with updated information and services, is located on
American Academy of Pediatrics. All rights reserved. Print ISSN: 1073-0397.