PERSPECTIVES OF ONLINE EDUCATION IN THE CZECH REPUBLIC Jiří Pospíšil, Helena Pospíšilová, Milena Öbrink Hobzová, Petra Sobková Sts. Cyril and Methodius Faculty of Theology, Palacký University in Olomouc
Univerzitní 22, 771 11 Olomouc, Czech Republic
Abstract
The paper deals with the future of online education in the Czech Republic. It maps whether people in different social and personal situations are interested in the online form of education, and whether there are some correlations between computer skills, age, education, population of resides on the one side and the attitudes to online learning on the other side.
Key words: education, online, courses, perspectives, conditions, specific population groups
1. WHAT IS ONLINE EDUCATION?
Online education is with no doubt the very actual theme of nowadays theoretical discussion in pedagogy as well as the actual practical phenomena which couldn’t be ignored by any modern society. Before we start to discuss practical questions, we have to state what we exactly mean by the term online education and what are the differences among online education, distance learning and e-learning.
There exist many definitions of distance learning but, for our case, we can follow the simple definition which describes the effort of providing access to learning for those who are geographically distant (Poulin, 2003; Moore, Dickson-Deane and Galyen, 2011). The concept of distance learning is almost two hundred years old (Specter, Merrill, Merrienboer and Dristoll, 2008) and originally it was based on post correspondence. According to the definition the distance learning is a specific form of learning and it doesn’t depends on the kind of method of delivering learning materials. Obviously when the computers and especially personal computers were developed, the methods of delivering information have been definitively changed. But, as Moore (1990) highlights, both the printed and electronic ways of delivering are often used. We believe that in the era of fast internet connection and high quality mobile electronic readers (tablets or e-book readers) the age of papers is almost at the end.
On the opposite to the concept of distance learning the concept of e-learning is not so clear. First of all we argue that e-learning in its own substance is not a form of education but it is the method of education, more specifically method of delivering information and communication. The e-learning from this point of view is nothing more than the usage of available technology (Poulin, 2003) in educational process in both common and distance form of learning. E-learning materials are in this time used at the universities as well as at secondary and high schools (it doesn’t matter whether the originator of material is from the school where the resources are used). The electronic delivery of information should very vary from interactive CD, TV to the modern web based technologies and complex LCMS systems. (Allen, 2003)
According to previous definitions distance learning and e-learning, online education is the special case of e-learning and should fulfill the idea of distance learning. Since the turn of the millennium online teaching and learning presents in many ways the future of education (Sutton, Basiel, 2014) The fact whether the online distributed material is or is not the distance education depends especially on the intention of the author. It can be used only for delivering information with some form of interaction but it can also be the very complex course such as some MOOC courses from the world top universities are. In our case we assume that the educational institutions should be interested in creation of complex courses for many reasons and for different purposes. In this article we mention only those of them which are, by our opinion, the most important:
• First of all reasons is the possibility to increase number of students and/or enhance the conditions of education for contemporary students. We shouldn’t forget that the education is now market-oriented (Lea, 2007). Following this reason for online education has one important risk: the school which implements online education has necessarily to increase the costs of the education with increasing the numbers of students otherwise the quality of education will fall (Inglis, 2008).
• The created online materials could be used for pupils or students who are not able to go properly in school. The numbers of students with individual study plan is growing up rapidly in Czech society and these students need to ‘collate evidence of their achievement in a way that is highly personal’ (Beetham, Sharpe, 2009, p. 33).
• The importance of lifelong learning and improvement of qualification is also growing up in entire Europe. Online education offer one of serious ways to fulfill the idea of learning society. (Jarvis, 2010)
• The online education sites could be not only the tools for learning but also the sites of practice (Goodfellow, 2007).
• The creation of online version of study materials is the opportunity to redefine the educational objectives and rethink the design of the course. (Beetham, Sharpe, 2009)
• High quality open online educational materials (especially MOOCs) are one of actual PR tools for the schools (Clark, 2008a; Haber, 2014)
Preparing quality materials for the distance learning delivered by internet is one of the important research theme and topic of the expert debate for almost last two decades. (Sutton, Basiel, 2014) The discussion continues till nowadays and with growing of the connection speed and technological possibilities of the computers, tablets or even the smartphones will surely continue ad infinitum.
After all reasons mentioned above and with the respect to the expert debates we are convicted we have to ask more difficult and actual question. Is the Czech society already prepared for delivering education digitally? Are the people able to use the technology across the whole population? Do people ever want to learn online? Are they able to build learning community? (Are they able to communicate effectively over the internet?) To answer these questions we realized the research which important part is published in this paper.
2. METHODOLOGY OF THE RESEARCH ON THE ONLINE EDUCATION CONDITIONS The research of the online education was designed as wide quantitative investigation. The research problem mentioned above has been critically revised and the fundamental variables measured in questionnaire have been divided in some key groups of measured variables. Descriptive statistics and analysis of these variables is written below in this section. The research sample includes 3860 persons from the whole Czech Republic but mostly from the regions of Moravia and East Bohemia. This number may vary in each question because some people didn’t answer every question. The data were collected from the May 2014 till August 2014. The questionnaire was divided in three sections. In the first section we asked about personal profile of the respondent (sex, age, population of respondent’s residence, school or employment, professional orientation, family situation, education, economical situation of the family). Second area of our interest was focused on the experiences and skills in the IT (PC, tablet or smartphone usage, using of internet, email communication, social networks and so on). Finally the third section of the questionnaire was focused on the online courses designed for and delivered over the internet (internet as a source of education, willingness and readiness for internet courses and field of study. The data was collected as the simple random selection from the population. The fundamental characteristics and description statistics of the selection are published in the section 3.
The whole research is based on theoretical assumption that there exist the relationships between key characteristic of population (such as sex, age, population of resides, social situation, family
background including the family economy, education, professional orientation) and the e-learning skills (Clarke, 2008) or the attitudes to online courses in different areas. All these relationships were formulated as hypothesis and falsificated. The results are published in the section 4. The most both problematic and important concept for our research is what does it exactly mean e-learning skills. In the context of online learning it is often understand as the information literacy or ICT literacy (Goodfellow, Lea, 2007). We agree with Clark (2008) that the e-learning skills is the group of special computer skills which should be achieved to be e-learning skilled. The problem is how to measure these skills. If we assume that this skills are the complex ICT literacy we probably never could measure exactly this complex literacy without the very complex measure instruments as f. e. ECDL tests. But more important question is: it is really necessary to achieve complex ICT literacy to have e-learning skills? We argue no because more important for e-e-learning (or generally online e-learning) is to be proficient in the area of ICT, to be used to use this instruments thou not always the best ways. That is because we introduce the ICT proficiency index (Ip):
𝐼𝑝= 1−�∑ 𝑄𝑖
7
𝑖=1 � −7
24
where Qi is the answer of one of seven questions which are a part of our questionnaire. The questions (Qi) are designed to ask two dimensions of ICT proficiency: the frequency of using ICT and the wideness of used ICT tools (PC, smartphones, tablets and so on).
The frequency of use is measured by questions:
• Are you used to use the PC? (Q1)
• Are you using the computer for interner searching and web pages reading? (Q2)
• Are you using email? (Q3)
• Do you have active account on some social network (like facebook, twitter and so on) (Q4)
The wideness of used ICT is measured by questions:
• Are you using smartphone? (Q5)
• Are you using tablet? (Q6)
• Are you using the internet to search information for your personal or professional education or development? (Q7)
Maximum score in these questions is 31 and it mean that the respondent is not proficient at all. On the other hand the lowest score is 7 and it means the very high proficiency using ICT. The index Ip is the number between 0 – 1 and signalize the degree of ICT proficiency on the normalized and standardized scale. The measured Ip for our selection has the mean 0,549 and the standard deviation (sd) 0,275. For the common use in the research we divided the whole measured people to the four groups: high proficiency in ICT (Ip ≥ Ipavg + sd), good proficiency in ICT (Ip ≥ Ipavg ˄ Ip < Ipavg + sd), low
proficiency in ICT (Ip ≥ Ipmean – sd ˄ Ip < Ipavg) and no proficiency in ICT (Ip < Ipavg – sd). By this
division the new variable – Ip group – was invented and also used in the hypotheses testing. The Ip group variable represents in all hypothesis the construct of e-learning skills, so if we founded the relationship between the Ip groups and f. e. age of respondents, it means the same as there is the relationship between the level of e-learning skills and the age of respondents.
All hypotheses were tested on the significance level p=0,05 and p=0,01 using the χ2 test for the independence of variables in the contingence table (Sheskin, 2007).
For the correlation analysis and statistical evaluation of research hypothesis was the non parametric χ2 test of independence form contingence table used. For each cell of contingence tables the adjusted residuals were calculated, too. (Azen, 2011)
3. DESCRIPTIVE STATISTICS – SELECTION OF RESPONDENTS, IT SKILLS AND ATTITUDES TO THE ONLINE COURSES
3.1 Personal characteristics of the selected respondents
First question asked in the questionnaire was about the sex of respondents. This question was answered by 3857 of 3860 respondents.
Sex n f nc
Male 1908 0,4947 1908 Female 1949 0,5053 3857 Total 3857 1
Table 1: Sex of respondents
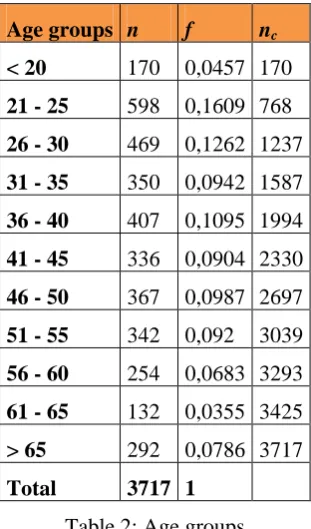
Second question in the binder was about the age of respondents. The question answered 3717 of 3860 respondents. For the better clarity of this variable we grouped it in age groups with the range 5 years.
Age groups n f nc < 20 170 0,0457 170 21 - 25 598 0,1609 768 26 - 30 469 0,1262 1237 31 - 35 350 0,0942 1587 36 - 40 407 0,1095 1994 41 - 45 336 0,0904 2330 46 - 50 367 0,0987 2697 51 - 55 342 0,092 3039 56 - 60 254 0,0683 3293 61 - 65 132 0,0355 3425 > 65 292 0,0786 3717 Total 3717 1
Table 2: Age groups
The third and very important variable measured in the first section of the questionnaire was population of respondent’s residence. This question was answered by 3829 of 3860 respondents.
Population of respondent’s residence n f nc Less than 2 000 residents 1118 0,292 1118 2 000 to 5 000 residents 649 0,1695 1767 5 000 to 15000 residents 681 0,1779 2448
15 000 to 60 000 residents 603 0,1575 3051 60 000 to 150 000 residents 488 0,1274 3539 More than 150 000 residents 290 0,0757 3829
Total 3829 1
Table 3: Population of respondent’s residence
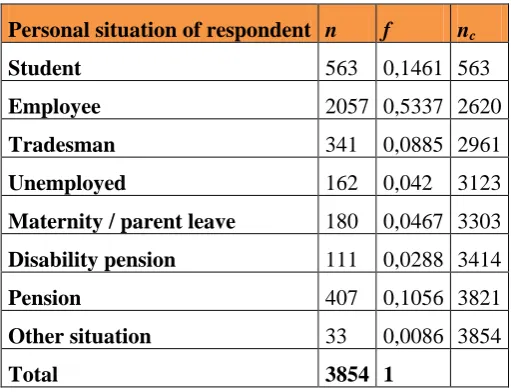
Next important question measured by the questionnaire was the personal situation (status) of respondent. The question was answered by 3854 respondents of 3860 total.
Personal situation of respondent n f nc
Student 563 0,1461 563
Employee 2057 0,5337 2620
Tradesman 341 0,0885 2961
Unemployed 162 0,042 3123
Maternity / parent leave 180 0,0467 3303 Disability pension 111 0,0288 3414
Pension 407 0,1056 3821
Other situation 33 0,0086 3854
Total 3854 1
Table 4: Personal situation of respondent
The fifth measured variable was focused on the professional orientation (kind of profession) of respondents. This question answered 3848 of 3860 respondents.
Professional orientation n f nc
Management 262 0,0681 262
Technics and technology 370 0,0962 632
Medicine and health sciences 345 0,0897 977
Education 563 0,1463 1540
Business and economy (including accounting) 442 0,1149 1982
public administration 255 0,0663 2237
Information and communication technologies 187 0,0486 2424 Law and social or cultural services 280 0,0728 2704 Private or public services 623 0,1619 3327
Operation of machines 326 0,0847 3653
Auxiliary and unskilled labor 195 0,0507 3848
Total 3848 1 Table 5: Professional orientation
The next measured personal variable was focused on education. This question answered 3855 of 3860 respondents.
Education of respondent n f nc
Elementary 186 0,0482 186
Apprenticeship 788 0,2044 974 High school 1718 0,4457 2692
College 1163 0,3017 3855
Total 3855 1
Table 6: Education
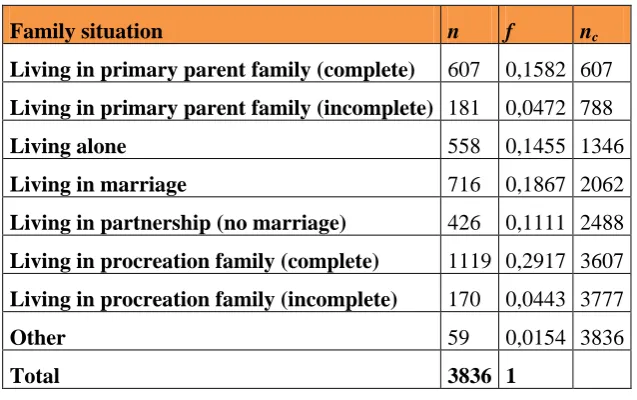
Last but one question of personal matters was focused on the family situation of the respondent. The question answered 3836 of 3860 respondents.
Family situation n f nc
Living in primary parent family (complete) 607 0,1582 607 Living in primary parent family (incomplete) 181 0,0472 788
Living alone 558 0,1455 1346
Living in marriage 716 0,1867 2062
Living in partnership (no marriage) 426 0,1111 2488 Living in procreation family (complete) 1119 0,2917 3607 Living in procreation family (incomplete) 170 0,0443 3777
Other 59 0,0154 3836
Total 3836 1
Table 7: Family situation
The very last personal question was about the financial situation of respondent’s family. This question answered 3811 of 3860 respondents.
Family financial situation n f nc
Bad or very bad (not enough for living) 119 0,0312 119
Not good (can’t make reserves) 686 0,18 805
Neither bad nor too good (can’t make enough reserves) 1708 0,4482 2513
Good (can make a reserves) 1062 0,2787 3575 Very good (can make big reserves) 236 0,0619 3811
Total 3811 1
Table 8: Family financial situation
3.2 Information and communication technology usage and skills
In the second block of questions in the research questionnaire we asked respondents about their skills in the information and communication technology.
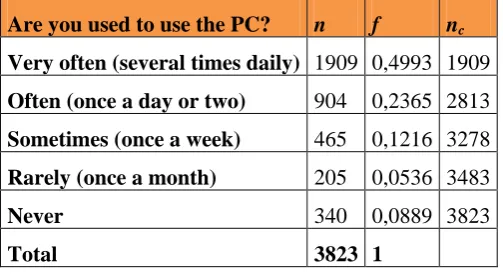
First question of this block was whether the respondent is using the personal computer. The question was answered by 3823 of 3860 respondents.
Are you used to use the PC? n f nc Very often (several times daily) 1909 0,4993 1909 Often (once a day or two) 904 0,2365 2813 Sometimes (once a week) 465 0,1216 3278 Rarely (once a month) 205 0,0536 3483
Never 340 0,0889 3823
Total 3823 1
Table 9: Are you used to use PC?
Second question about the IT skills was about internet searching and web pages reading. The question was answered by 3838 of 3860 respondents.
Are you using the computer for Internet searching and web pages reading? n f nc
Yes, can't imagine PC without Internet 1923 0,501 1923
Often (once a day or two) 931 0,2426 2854
Sometimes (once a week) 429 0,1118 3283
Rarely (once a month) 205 0,0534 3488
Never 350 0,0912 3838
Total 3838 1
Table 10: Are you using the computer for internet searching and web pages reading?
The next one question was focused on the smartphone usage. The question answered 3843 of 3860 respondents.
Are you using smartphone? n f nc Yes, including internet connection and online applications 1415 0,3682 1415 Yes, including applications but without internet connection 351 0,0913 1766
Yes, but like common phone 547 0,1423 2313
I don't use smartphone 1530 0,3981 3843
Total 3843 1
Table 11: Are you using smartphone?
After the question about smartphones one about tablets had to follow. The question about tablet using answered 3824 respondents of 3860 total.
Are you using tablet? n f nc
Yes, including internet connection and online applications 685 0,1791 685 Yes, including applications but without internet connection 164 0,0429 849
Yes, but like common diary 148 0,0387 997
I don't use tablet 2827 0,7393 3824
Total 3824 1
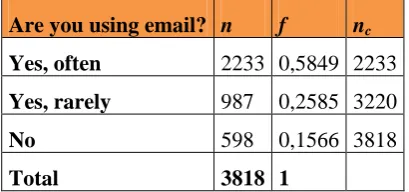
The next question focused on the usage of email communication, because this form of communication is, in addition to the ability to search the Internet, the gate for all types of internet education. The question was answered by 3818 of 3860 respondents.
Are you using email? n f nc Yes, often 2233 0,5849 2233 Yes, rarely 987 0,2585 3220
No 598 0,1566 3818
Total 3818 1
Table 12: Are you using email?
The very last question about the ability of IT communication was focused on the usage of the social networks. This question answered 3838 of 3860 respondents.
Do you have active account on some social network (like Facebook, Twitter
and so on) n f nc
Yes, and I use it intensively 630 0,1641 630
Yes, and I use it often 690 0,1798 1320
Yes, and I use it sometimes 596 0,1553 1916
Yes, but I use it rarely 523 0,1363 2439
I don't have an account 1399 0,3645 3838
Total 3838 1
Table 13: Social network usage
3.3 Online education attitudes and areas of interest
The last section of the research questionnaire was focused on the attitudes to the online courses. In this case we mean courses which are completely delivered digitally.
First question in the section of online education attitudes is focused on the common interest in the searching the information for personal or professional development. This question has answered 3803 of 3860 respondents.
Are you using the internet to search information for your personal or
professional education or development? n f nc
Very often 717 0,1885 717
Often 973 0,2559 1690
Sometimes 874 0,2298 2564
Rarely 495 0,1302 3059
Not at all 744 0,1956 3803
Total 3803 1
Table 14: Using internet for education
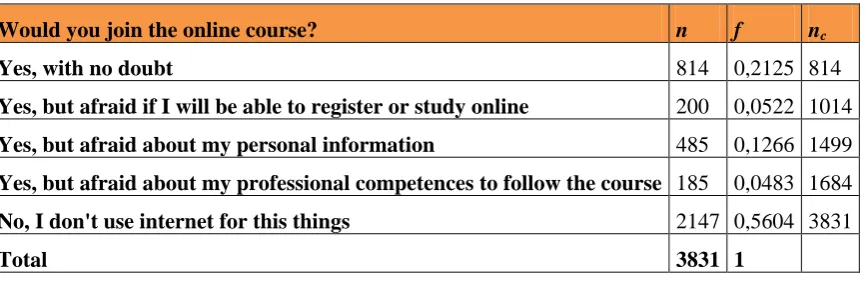
Second question of this block was about the attitudes to the online education itself. The question was specifically formulated as follows: “If you find interesting online course due the internet searching would you join it?” This question was answered by 3831 of 3860 respondents.
Would you join the online course? n f nc
Yes, with no doubt 814 0,2125 814
Yes, but afraid if I will be able to register or study online 200 0,0522 1014 Yes, but afraid about my personal information 485 0,1266 1499 Yes, but afraid about my professional competences to follow the course 185 0,0483 1684
No, I don't use internet for this things 2147 0,5604 3831
Total 3831 1
Table 15: Would you join the online course?
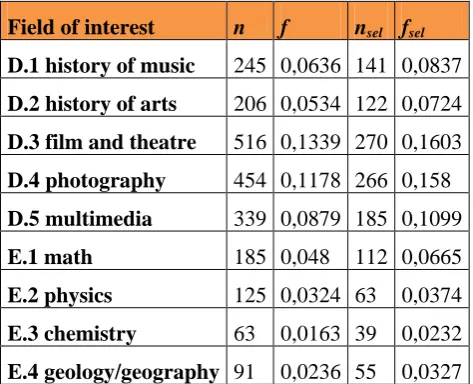
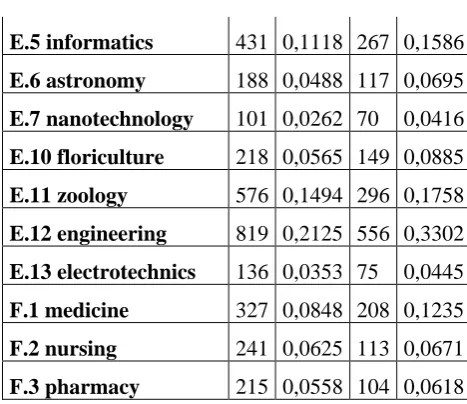
The last most important and interesting question we asked about online learning was focused on the areas of interests of the respondents. The fields of interests we grouped by the general fields of study into humanities (A), religion studies (B), social sciences (C), arts, music, dramatic arts (D), science (E) and health and medicine (F). The numbers in the column n of following table mean the counts of those
of 3860 respondents who selected the field. The numbers in the column nsel of following table mean
the counts of those 1684 respondents who selected the field of interested and also answered one of yes options in previous question. The relative numbers in the columns are related to the total 3860 in the case of f column and to the total 1684 in the case of fsel column.
Field of interest n f nsel fsel
A.1 philosophy 218 0,0565 149 0,0885
A.2 history 576 0,1494 296 0,1758
A.3 languages 819 0,2125 556 0,3302
A.4 archeology 136 0,0353 75 0,0445
A.5 cultural studies 327 0,0848 208 0,1235
B.1 Bible - biblical world, history and interpretation of the texts 241 0,0625 113 0,0671 B.2 history of christianity and church 215 0,0558 104 0,0618
B.3 christian theology 126 0,0327 71 0,0422
B.4 judaism – its culture and history 83 0,0215 48 0,0285 B.5 islam – its culture and history 62 0,0161 35 0,0208 B.6 eastern religious (f.e. buddhism, hinduism, shintoism ) 101 0,0262 70 0,0416 B.7 natural religions (f.e. animism, totemism) 67 0,0174 45 0,0267 B.8 relation between religion and science 170 0,0441 93 0,0552
C.1 sociology 289 0,075 192 0,114
C.2 education 437 0,1134 296 0,1758
C.3 politology 213 0,0553 137 0,0814
C.4 psychology 663 0,172 440 0,2613
C.6 economy 470 0,1219 291 0,1728
C.7 social work 319 0,0827 195 0,1158
Table 16: Fields of interests and respondents choices – part I
Field of interest n f nsel fsel D.1 history of music 245 0,0636 141 0,0837 D.2 history of arts 206 0,0534 122 0,0724 D.3 film and theatre 516 0,1339 270 0,1603 D.4 photography 454 0,1178 266 0,158 D.5 multimedia 339 0,0879 185 0,1099 E.1 math 185 0,048 112 0,0665 E.2 physics 125 0,0324 63 0,0374 E.3 chemistry 63 0,0163 39 0,0232 E.4 geology/geography 91 0,0236 55 0,0327
E.5 informatics 431 0,1118 267 0,1586 E.6 astronomy 188 0,0488 117 0,0695 E.7 nanotechnology 101 0,0262 70 0,0416 E.10 floriculture 218 0,0565 149 0,0885 E.11 zoology 576 0,1494 296 0,1758 E.12 engineering 819 0,2125 556 0,3302 E.13 electrotechnics 136 0,0353 75 0,0445 F.1 medicine 327 0,0848 208 0,1235 F.2 nursing 241 0,0625 113 0,0671 F.3 pharmacy 215 0,0558 104 0,0618 Table 17: Fields of interests and respondents choices – part II
4. ONLINE LEARNING AND CZECH POPULATION - THE FUTURE OF ONLINE EDUCATION
As we mentioned above we realized the division of measured population into four categories depending on the proficiency in the ICT. The result of this partition is in the following table. We divided 3858 of 3860 respondents (two responds didn’t answered any of 7 indexed questions). In the following hypothesis we will use the variable Ip group (e-learning skills level) as a one of correlated variables in the testing of independence.
Ip group n f nc
High proficiency in ICT 694 0,1799 694 Good proficiency in ICT 1388 0,3598 2082 Low proficiency in ICT 1091 0,2828 3173 No proficiency in ICT 685 0,1776 3858
Total 3858 1
Table 18: Measured population divided by Ip index
The relationships between measured variables and calculated χ2 values of these relationships are shown in the following table of research results summary.
Ip groups Groups with better Ip
than expected
Willingness for the online learning
Groups with higher willingness than expected
Sex 17,95** males 39,35** females
Age 1569,23** younger people to 35 325,19** younger people to 35 Population of
respondent’s residence
84,72**
respondents from the cities with the population over 150 000
60,71**
respondents from the cities with the population 15 000 - 60
000 and over the 150 000
Personal
situation 1516,00**
students, employees,
maternity/parental leave 262,28** students, tradesmans
Table 19: Significant relationships and significant groups (** p < 0,01) - part I
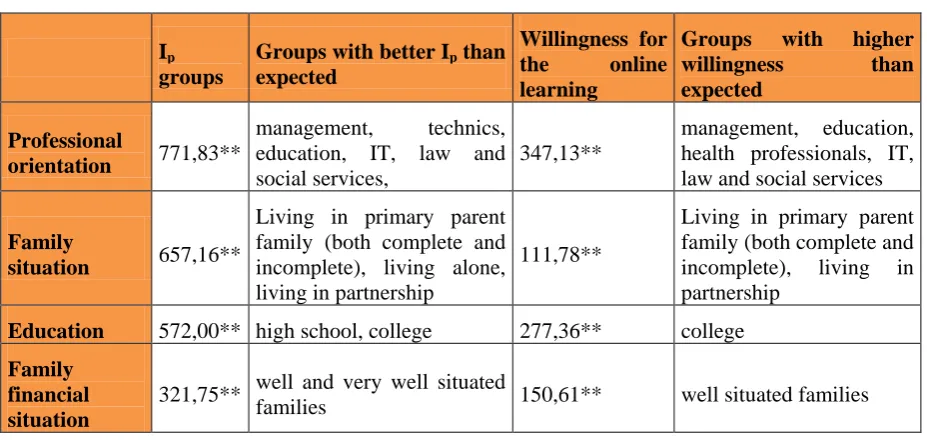
Ip
groups
Groups with better Ip than expected
Willingness for the online learning
Groups with higher willingness than expected
Professional
orientation 771,83**
management, technics, education, IT, law and social services,
347,13**
management, education, health professionals, IT, law and social services
Family
situation 657,16**
Living in primary parent family (both complete and incomplete), living alone, living in partnership
111,78**
Living in primary parent family (both complete and incomplete), living in partnership
Education 572,00** high school, college 277,36** college Family
financial situation
321,75** well and very well situated
families 150,61** well situated families
Table 20: Significant relationships and significant groups (** p < 0,01) – part II
The results in the tables 19 and 20 show we can conclude that there exist all relationships expected in the section 2 of this paper. We can also see the groups that are more proficient in the ICT than we expected and also the groups that have higher willingness for the online education.
If we analyze the first hypothesis about the influence of sex on the Ip index we can conclude that relationship is very strong in behalf on males. On the contrary, although the influence of sex on the willingness for the online education is also strong, the women are a group with more interest in the online form of education. Therefore, we assume that thanks to the interest of online education and increasing number of online courses will also grow e-learning skills of women.
As we assumed the age is also very important factor which affects the Ip index and also the willingness to join the online courses. It is no surprise that the younger people have higher proficiency in the ICT and also higher willingness to join online courses. Much more interesting are the age borders on which these exceptions are broken. The people under 35 years of age have higher than expected Ip, people between 35 – 45 years have expected Ip and only the people over 45 have lower than expected level of Ip. These numbers shows the proficiency in the ICT is not only domain of young people and middle aged people are in, too.
The hypothesis about the influence of the population of respondent’s residence was confirmed, as well as the others. If we analyze this hypothesis in more detailed view we can see that the situation is much better in the cities over 150 thousands of residents. On the contrary the Ip index is lower in the villages under 2000 of residents.
Another hypothetical assumption which concerned the relationship between personal situation on the one side and Ip level and willingness for online learning was confirmed, too. In the first part of this hypothetical questioning - whether there is a connection between personal situation and Ip - we have to conclude that students, employees and people on maternity/parental leave have better Ip than the others. In the second part of hypothetical relationship – whether there exists relationship between
personal situation and willingness for online learning - we have to conclude that the over expected groups here are students and surprisingly also the tradesman – a group which is in other cases rather featureless. From this hypothesis we can draw the secondary assumption that for the future the tradesman could be very important group to be focused by online courses designers and producers.
From the professional orientation point of view we can confirm the assumption there exists many relationships among this factor, Ip and willing for the online education. Especially for the managers, technicians, educators, lawyers and workers in the social services we can confirm the over expected proficiency in ICT. On the other side among the groups mentioned above there are also health professionals added in the case of important correlation to the willingness for the online education.
From the family situation point of view we were slightly sad as we founded that the groups with higher than expected Ip level and willingness for online learning are consisting of people living in the primary family or people who are living in the partnership without marriage. On the first sight it may look like family life doesn’t support use of ICT. But we hope that is not true and this factor is more affected by the age of respondents as these groups are also connected with the age groups under 30 years of life.
Last bud one hypothesis we tested in our research was the one assuming the relationship between education (erudition), Ip level and willingness to join the online courses. As we assumed the relationship has been confirmed and it is not surprise that people with higher acquirements have also higher Ip level (are more e-learning skilled) and the people with higher education are also more willing to join the online courses.
Last bud surely not least hypothesis assumed very important relationship from our point of view between family financial situation, Ip level and willingness for the online education. Unfortunately there exists the expected statistical dependency between these factors and we have to confirm that members of well situated or well-off families have much better Ip index and higher willingness for the online education than those who are from not so well-off families.
After all answers from the research the last question remains. What is the future of online learning in the Czech Republic? The most honestly answer is that there are many unanswered questions about the lifelong learning of those groups which are not so good in ICT proficiency (esp. older people and people with lower acquirements or not well-off families) but there also exists justified hope the situation becomes to be better in this area and there are mean opportunities to improve the e-learning skills. There is also no doubt the e-courses have strong educational potential but neither this potential is limitless. On the other hand there still remain many questions about the future of completely online courses or MOOCs because it seems the wave of MOOC mania is over and now all the universities and schools around the world are looking for the real level of importance of these forms of education.
The article was financially supported by IGA_CMTF_2015_010 Project (Methods of social-educational activities in social pedagogy).
REFERENCES
Allen, MW 2003. Guide to e-Learning. Hoboken, NJ: Willey & Sons.
Azen, R & Walker, CM 2011. Categorical Data Analysis for the Behavioral and Social Sciences. New York: Routledge.
Beetham, H & Sharpe, R, 2009. Rethinking Pedagogy for a Digital Age. Oxon: Routledge.
Clark, A 2008. E-learning skills. 2nd ed. Basingstoke: Palgrave Mcmillan.
Clark, T 2008a. Virtual schooling and basic education. In: Bramble, WJ & Panda, S (eds.). Economics of Distance and Online Learning. New York: Routledge, pp. 52 – 71.
Goodfellow, R 2007. Learning technologies in the university: from ‘tools for learning’ to ‘sites of practice’. In: Goodfellow, R & Lea, MR. Challenging E-learning in the University. Berkshire: Open University Press, pp. 29 - 49.
Goodfellow, R & Lea, MR 2007. A Literacies Approach in Practice In: Goodfellow, R & Lea, MR. Challenging E-learning in the University. Berkshire: Open University Press, pp. 90 - 122.
Haber, J 2014. MOOCS. Cambridge (MA), London: The MIT Press.
Inglis, A 2008. Costs and Quality of Online Learning. In: Bramble, WJ & Panda, S (eds.). Economics of Distance and Online Learning. New York: Routledge, pp. 132 – 147.
Jarvis, P 2010. Adult Education and Lifelong Learning. 4th ed. Oxon: Routledge.
Lea, MR 2007 Approaches to learning: developing e-learning agendas. In: Goodfellow, R & Lea, MR. Challenging E-learning in the University. Berkshire: Open University Press, pp. 9 - 28.
Moore, JL, Dickson-Deane, C & Galyen, K 2011. e-Learning, online learning, and distance learning environments: Are they the same? The Internet and Higher Education. March 2011, vol. 14, issue 2, pp. 129–135.
Moore, MG 1990. Background and overview of contemporary American distance education. Contemporary issues in American distance education. New York: Pergamon Press, pp. xii − xxvi.
Poulin, R 2003. Distance education. In: Guthrie, JW (ed.) Encyclopedia of Education. 2nd ed. New York: Macmillan, vol. 2, pp. 589 – 593.
Sheskin, DJ 2007. Handbook of Parametric and Nonparametric Statistical Procedures. 4th ed. Boca Raton, FL: Chapman & Hall.
Spector, JM, Merrill, MD, Merrienboer, JV & Dristoll, MP 2008. Handbook of research on educational communications and technology. 3rd ed. New York, London: Lawrence Erlbaum Associates.
Sutton, B & Basiel, A 2014. Teaching and Learning Online. New York: Routledge.