Open Access
Methodology
Can discrete event simulation be of use in modelling major
depression?
Agathe Le Lay*
1,2, Nicolas Despiegel
2, Clément François
2and Gérard Duru
1Address: 1Laboratoire d'Analyse des Systèmes de Santé, Université Claude Bernard, Lyon 1, France and 2International Health Economics and
Epidemiology Department, H. Lundbeck A/S, Paris, France
Email: Agathe Le Lay* - [email protected]; Nicolas Despiegel - [email protected]; Clément François - [email protected]; Gérard Duru - [email protected]
* Corresponding author
Abstract
Background: Depression is among the major contributors to worldwide disease burden and adequate modelling requires a framework designed to depict real world disease progression as well as its economic implications as closely as possible.
Objectives: In light of the specific characteristics associated with depression (multiple episodes at varying intervals, impact of disease history on course of illness, sociodemographic factors), our aim was to clarify to what extent "Discrete Event Simulation" (DES) models provide methodological benefits in depicting disease evolution.
Methods: We conducted a comprehensive review of published Markov models in depression and identified potential limits to their methodology. A model based on DES principles was developed to investigate the benefits and drawbacks of this simulation method compared with Markov modelling techniques.
Results: The major drawback to Markov models is that they may not be suitable to tracking patients' disease history properly, unless the analyst defines multiple health states, which may lead to intractable situations. They are also too rigid to take into consideration multiple patient-specific sociodemographic characteristics in a single model. To do so would also require defining multiple health states which would render the analysis entirely too complex. We show that DES resolve these weaknesses and that its flexibility allow patients with differing attributes to move from one event to another in sequential order while simultaneously taking into account important risk factors such as age, gender, disease history and patients attitude towards treatment, together with any disease-related events (adverse events, suicide attempt etc.).
Conclusion: DES modelling appears to be an accurate, flexible and comprehensive means of depicting disease progression compared with conventional simulation methodologies. Its use in analysing recurrent and chronic diseases appears particularly useful compared with Markov processes.
Published: 05 December 2006
Cost Effectiveness and Resource Allocation 2006, 4:19 doi:10.1186/1478-7547-4-19
Received: 21 August 2006 Accepted: 05 December 2006
This article is available from: http://www.resource-allocation.com/content/4/1/19
© 2006 Le Lay et al; licensee BioMed Central Ltd.
I. Background
Depression is a widespread condition associated with sig-nificant functional and social deterioration as well as extensive direct and indirect health care costs. A recent review of epidemiological studies estimates the annual prevalence rate of major depression at approximately 5% in Europe [1]. Within the next 20 years, depression is pre-dicted to become one of the leading causes of disability worldwide [2].
In 2001, the National Institute of Mental Health author-ized additional research on preventing relapse in major depression as a part of a larger effort to find effective treat-ments capable of producing long-term durable recovery [3]. Depression is a recurrent, potentially chronic and dis-abling condition. Acute treatments for depression, although effective, are often not sufficient enough for a large percentage of patients in preventing either subse-quent functional impairment due to residual symptoms, or recurrent episodes. The primary objective of an inter-vention to prevent relapse is sustained remission of depressive symptoms. However, it is increasingly accepted that economic considerations need to be taken into account. Rising costs of interventions along with newer and more expensive antidepressant treatments bring up to questions about the cost-effectiveness of therapeutic inter-ventions. Economic evaluation can assist decision-makers by providing additional support in making informed judgments concerning the allocation of increasingly scarce healthcare resources [4].
Quantifying the economic implications of a healthcare intervention requires precisely defining the target popula-tion, the characteristics of the disease and the therapeutic intervention. It also requires structuring the possible tra-jectory of patients in a logical, realistic order over time by considering the events that may occur, together with their health and economic implications. Providing a computa-tional framework to illustrate disease progression over time as accurately as possible is necessary. Decision trees have been used successfully despite general recognition that they have severe limitations when applied to medical conditions [5]. Markov models provided an alternative that allowed analysts to picture the course of a disease in terms of mutually exclusive health states and the transi-tions among them. While this technique considers time more explicitly and can be analyzed very efficiently, Markov models are considered highly rigid, mainly because of the lack of 'memory' imposed by the stochastic process.
Discrete Event Simulation (DES) models might offer a natural way of adequately depicting patient disease course throughout the health system [6] by making it possible to
take into account important (baseline) prognostic factors together with life events interactions.
In this case study, our intention was to identify and com-pare the strengths and limits of discrete event simulation models with those of Markov models in portraying depression dynamics. To achieve this goal we employed a three-step process:
1. We described the clinical features specific to unipolar major depression.
2. We conducted a conceptual implementation of a Markov model and a DES model to detect possible abili-ties to address disease-specific issues relevant to major depression.
3. We discussed and compared the ability of each type of model to adequately reflect disease progression over time.
II. Key clinical features of unipolar depression
MB. Keller and colleagues reviewed important factors pre-disposing patients to recurrence of depressive symptoms and highlighted several risk factors that should be consid-ered when modelling disease evolution [7].
II.1 Definitions
Concentrating on prophylactic strategies requires consen-sus of definitions for specific concepts such as relapse and recurrences of depressive symptoms. In 1988, the MacArthur Foundation Research Network on the Psycho-biology of Depression consensus group agreed on the def-inition of terms required to designate the relevant change points over the course of illness. These definitions have provided a framework for deciding what constitutes "an episode" and have further clarified the concepts of severity and duration.
• Remission is defined as "a relatively brief period during which an improvement of sufficient magnitude is observed so that the individual is asymptomatic, i.e. the patient no longer meets syndromal criteria for the disor-der and has no more than minimal symptoms".
• Recovery is defined as "an asymptomatic period that lasts longer than the remission period". This definition is used to designate recovery from the episode, not from the depressive symptoms per se, and implies a sustained remission of symptoms.
• Recurrence is defined as "the appearance of a new epi-sode of major depressive disorder and thus can only occur during a period of recovery".
Figure 1 provides a visual understanding of how distinct phases of depression differentiate relapses from recur-rences, and remission from full recovery.
In this paper, a "depressive event" is defined as the occur-rence of depressive symptoms. A depressive episode may include several depressive events.
II.2 Important risk factors
The following section highlights key features in terms of risk factors for unipolar major depression. The illustrative data presented hereafter were extracted from published lit-erature [7-10]. Long-term prospective studies of patients with depression are somewhat scarce, therefore this work was mainly based on the National Institute of Mental Health (NIMH) Collaborative Program on the Psychobi-ology of Depression study [7,9,10]. This study was a pro-spective, naturalistic long-term follow-up that aimed to describe the episodic course of illness in major depressive disorder. Recruited individuals received either outpatient or inpatient care (outpatients represented 25% of the total sample).
One of the major findings from this long-term follow-up study suggested that the number of previous depressive events a patient experienced significantly influenced their probability of relapse (Figure 3).
In approximately 20% of cases, as duration of depressive symptoms increased, the chances of remission decreased (Figure 4). These findings reinforce the chronic nature of the illness for a substantial number of patients [11].
The presence of residual depressive symptoms has also been proven to be associated with an increased risk of short-term relapse as well as with a long-term chronic course. Patients' attitude towards treatment has also been widely discussed as a key predictive factor of the long-term course of the disease. Olfson and colleagues [12] recently showed that approximately 4 out of 10 patients (42.4%) who initiated antidepressant treatment for depression dis-continued the antidepressant medication during the first 30 days of treatment, and among those who continued antidepressant therapy for more than 30 days, one-half (52.1%) discontinued the medication during the subse-quent 60-day period. Moreover, a 2-year naturalistic study showed superior long-term recovery in patients who were adherent to antidepressant medication compared with non-adherent patients [8,13].
Diagram of the five possible outcomes across the three phases of treatment of depression (Source: Thase M.E., 2000)
Figure 1
Lastly, sociodemographic characteristics such as age and gender have also been proven to be significant factors to be taken into consideration [14].
Figure 2 summarizes the key factors for recurrent depres-sion.
Management of patients therefore requires differentiating between their sociodemographic characteristics, disease history, number of prior episodes and compliance to treatment over time.
III. Application
Acceptance of the definitions proposed brings us to the comparison of two computational frameworks for model-ling real-life disease evolution for in- and outpatients with major unipolar depression over a period of 10 years.
The final health outcomes of interest were time spent without depressive symptoms (i.e. time in remission and full recovery) and the number of relapses and recurrences occurring over the study period. The simulation models described hereafter illustrate disease progression over time regardless of therapeutic strategy and take into con-sideration realistic patient behaviour patterns as well as important prognostic factors. We provide additional tech-nical details on both Markov and Discrete Event Simula-tion models, together with a practical example of both modelling methods. The software used to implement the simulation models was TreeAge Pro 2006 Healthcare Soft-ware, release 0.1 by TreeAge Software Inc., Williamstown, MA 01267 USA.
III.1 Markov models
Markov modelling is a decision-analytic technique that characterizes the prognosis of a cohort of patients by assigning them to a fixed number of health states and then models transitions among health states [15]. Markov models (typically Markov chains) assume transition prob-abilities to be constant over time. However, it's possible to bypass this strict assumption by modelling
non-homoge-neous (i.e. time-dependent) Markovian stochastic proc-esses. Markov models are particularly suited to modelling events of interest that occur repeatedly over a long period of time [5,15]. However, an important limitation of Markov models is that they lack "memory". This means that the probability of moving from one state to another does not take into account the history of the patient before he or she arrived in that state. This is also referred to as the Markovian assumption.
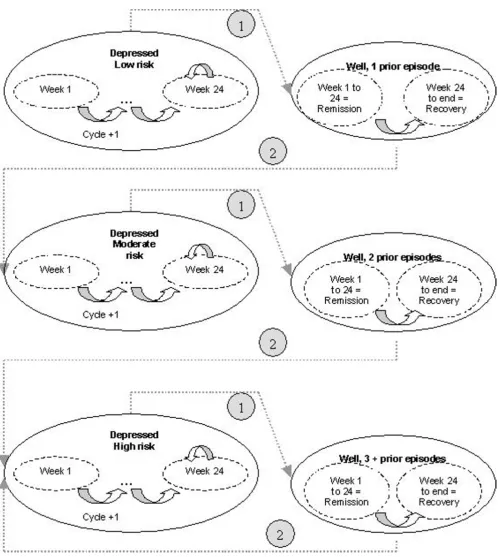
In our illustrative case (picture in Figure 5), health states were divided into three levels of risk -low, moderate, high (reflecting patient's number of previous episodes), each being divided into multiple temporary states associated with varying probabilities of remission according to the time elapsed in the disease state (in order to handle illness persistence issues). Therefore, for each level of risk, on the basis of a 1-week cycle (the accepted time span in MDD before observing any potential health transitions), we defined 24 temporary depressed states, i.e. 24 weekly remission probabilities adjusted for the duration of the disease. If the patient was still depressed at week 24, a con-stant probability of remission was applied. The number of temporary states was chosen according to the accepted management of an episode (i.e. a continuation period of 6 months) [16,17].
This resulted in 24*3 = 72 (temporary) health states accounting for risk levels and duration of the illness.
To differentiate remission periods from recovery periods (for increased precision when assessing the ability of a given strategy to further delay development of depressive symptoms), it was necessary to divide the "well" state into two separate temporary states. The first state was remis-sion, i.e. the first 24 weeks following the disappearance of symptoms (in accordance with clinical guidelines which define a minimum of 24 symptom-free weeks before con-cluding that the patient has achieved full recovery). The second state was the full recovery period (i.e. a period of remission longer than 24 weeks).
The data required to specify this simulation model (in terms of clinical data exclusively) are survival distribu-tions of remission and relapse at each cycle (i.e. one-week transition probabilities), conditional on the number of previous depression events. The time spent in the any health state may be summed over the period (i.e. 10 years = 520 cycles) and eventually discounted according to applicable rates.
This somewhat "simple" model (i.e. in terms of the number of risk factors taken into account) demonstrates the suitability of Markov models in addressing the key fea-tures of importance when modelling depression evolu-Key risk factors for recurrent depression
Figure 2
tion over time. First, they handle the problem of patients' history of the disease by splitting health states according to different risk levels (low, moderate, high). This is com-putationally acceptable. Second, the chronic nature of the disease (for approximately 20% of patients, as mentioned previously) was managed at the expense of defining mul-tiple health states (i.e. 72 states encoded as "tunnel" vari-ables), making it possible to assign varying transition probabilities according to the time spent in the "depressed" state. Lastly, Markov models can distinguish between remission and recovery periods by using tempo-rary states (i.e. 6 more health states). Therefore, a Markov representation of the problem requires defining at least 72+6 = 78 health states to properly take into considera-tion primary relevant risk factors (i.e. severity and dura-tion of the disease).
The efficiency of such a method in more complicated sce-narios, however, is questionable. For example, what if the analyst would like to take into consideration an impor-tant factor of prognosis such as patients' attitude towards treatment? This would necessitate further splitting each state in two more states. With every additional factor, the model becomes increasingly more difficult to handle properly. Would using a Markovian representation make it possible to efficiently consider the key factor of suicidal behaviour? The same reasoning applies: the integration of all relevant factors into a Markov model may render it too complex and prone to bias. Markov models have previ-ously been used to model the cost-effectiveness of relapse prevention interventions for recurrent depression [18-23]. They have also been used as a tool to portray the epidemi-ology of depression [24-29]. However, we were unable to find any Markov model that simultaneously took into consideration all of the confounding factors just men-tioned.
These factors are of great interest to researchers and deci-sion makers alike and, naturally, may merit a more flexi-ble simulation method. Discrete event simulation models may be an opportunity to adequately address the limita-tions of Markov models, and our intention was to assess the benefits and drawbacks of DES compared with Markov models.
III.2 Discrete Event Simulation models
Discrete event simulation (DES) is one way of observing the time- dependent (or dynamic) behaviour of a system [30-32]. As a cost-effectiveness tool, DES models have been widely used in various disease areas, including lapar-oscopic surgery [33], gastric cancer [34], renal diseases [35], drug abuse [36], HIV transmission [37], early breast cancer [38,39] and liver transplants [40]. To our knowl-edge, DES models have not yet been used within the field of major depression.
Recently, J.J Caro proposed further examination of DES models as a computational tool for cost-effectiveness analyses. In doing so he reiterated the key principles of the method [6]:
Entities
Entities are the items that evolve through the simulation. In the clinical simulation of a disease, patients are the entities. The patient is an explicit element of a discrete event simulation model. In DES models, patients are assigned attributes (e.g., age, sex, duration of the disease) with a specific value (distribution) for each. These values are defined at the start of the simulation and may be updated as required: age increases, disease severity levels rise and fall, the number of depressive events increases, etc. Other model specifications such as time horizon and discount rate are encoded in variables. These values may change during the simulation.
9 Cumulative probability of relapse after remission from
depressive symptoms given the number of prior depression events (Source: Solomon et al., 2000)
Figure 3
Cumulative probability of relapse after remission from depressive symptoms given the number of prior depression events (Source: Solomon et al., 2000).
Cumulative probability of remission from index episode of depression (Source: Keller et al., 1998)
Figure 4
Markov model synthetic representation
Figure 5
Events
An event is defined as anything that can happen during the simulation. This can include occurrence of depressive symptoms, remission from depressive symptoms, patients stopping treatment, a suicide attempt, an adverse event, etc. This concept extends well beyond the transitions in a Markov model, because the event need not imply a change in the patient's state. Events can occur sequentially and/or even simultaneously. They can recur – if this corre-sponds to clinical reality – and they can change the course of a given patient's experience by influencing that patient's attributes and the occurrence of future events. The rates at which events occur can take on any functional distribution supported by the data. They can be depend-ent on any attributes or variables and these functions can change over time as appropriate.
Time
The third fundamental component of a DES is time itself. An explicit simulation clock keeps track of the passage of time. This makes it possible for the analysts to clearly sig-nal the start and end of the simulation and to create sec-ondary clocks that track interim periods such as depression episode duration or remission periods. By making time explicit, a DES enables handling time much more flexibly compared with Markov models because there is no need to define cycle length.
The model described here belongs to the class of models that have been described elsewhere as individual sam-pling models [41,42]. Rather than following an entire cohort through a model by assigning proportions to dif-ferent states, discrete event simulation models the path-way of an individual by sampling probabilities from an a priori distribution. This results in greater realism in describing a patient's evolution through the healthcare system and offers more flexibility in the data requirements needed to feed the model. DES models provide an alter-native tool capable of considering multiple risk factors and non-Markovian structures (i.e. non memory-less sto-chastic processes). Peter W. Glynn describes a mathemat-ical formalism for the underlying stochastic process [43,44], named "Generalized Semi-Markov Process" (GSMP). A GSMP is an established formalism for mode-ling continuous-time stochastic discrete event systems.
Throughout the entire simulation, new information (depending on the triggered events) can be tracked and stored into a temporary variable, so that future events' probabilities can be changed to reflect a patient's new clin-ical and socio-demographic profile. Patients may then acquire attributes (e.g., a higher risk of relapse) as certain events occur within the model. The attributes of a particu-lar patient influence his/her pathway through the
simula-tion, as well as the economic outcomes associated with the events experienced (e.g., hospitalisation resulting from a suicide attempt).
Thanks to the strength of the assumptions the technique offers, and by modelling individual patient pathways, DES provides a greater degree of flexibility which, when supplied with adequate data, may allow greater confi-dence in the results [45].
To examine the properties of DES under practical circum-stances, we chose to apply them to the dynamics of depression. The algorithm associated with our problem is depicted in Figure 6. There are no cycle lengths to declare and no health states to define. Disease evolution is pic-tured using events that will trigger a change of health state. The method chosen to select the next occurring event was that used by Barton et al. [46], the underlying idea being "sample times for each possible event and use the mini-mum" (the rationale being that once the first event has happened, times to other events may need to be resam-pled). For each event, therefore, survival distributions were required assuming that no other event was possible. A time was sampled for each event and the earliest time determined which event happened. This is implemented by considering other events as censored events and the other times are discarded.
The information required was survival data conditioned on the number of prior depressive events. The time spent in the "well" state was obtained by summing the tracked sampled times leading to relapse. The time spent in the depressed state was obtained by summing the tracked sampled times leading to remission. Other tracker varia-bles make it possible to count the number of relapses or recurrences occurring during the study period. The patient started the model with a first depressive event (i.e. no prior depressive events). The only event that would remove a patient from the state of depression would be achieving remission of symptoms. Therefore, a "time to remission" was sampled based on the patient's history. The clock advances of the simulated "time to remission" and a test is performed to check if there is time left to con-tinue the simulation (according to the fixed time horizon) or not. Once the patient is symptom-free, he is still subject to relapse. Therefore, a "time to depression" is sampled and the clock is advanced to this sampled "time to depres-sion". If the sampled time was inferior to 24 weeks then the patient was in "simple remission"(i.e., relapse). If the sampled time was superior to 24 weeks, then the patient was in full recovery. Based on these tests, tracker variables count the number of events that occur, and patient's attributes are updated accordingly. Figure 6 displays a graphical representation of the algorithm.
9
The present DES model reflects a pathway with a very lim-ited list of possible events: there are no competing events. This renders the analysis quite simple and as a practical example makes it possible to visualize the flexibility with which DES models cope with multiple competing events. DES models appear to be a powerful means to address both the problem of a patient's history and the risk for an illness to persist by using survival distributions condi-tioned by tracker values. Similarly, remission and recovery periods can be easily distinguished by tracking the sam-pled "time to depression" and see if this samsam-pled time (24 weeks, per consensus definitions) is inferior or superior to a threshold value. If the sampled time to depression was less than 24 weeks, then the patient could not be in full recovery and was, therefore, only in a "remission phase". By implementing various queries, it is possible to define new trackers that will remember whether the patient was completely well or not.
DES models are as efficient as Markov models, with per-haps, slightly more flexibility regarding their implementa-tion. If the analyst wishes to tackle the problem of adherence to treatment (a key factor of interest in model-ling depression), DES models are flexible enough to man-age this by adding an event to the list of possibilities a patient is likely to experience (along with its own survival distribution) and run the model. The sequence of events experienced by the patient will be randomly generated according to the event selection method previously out-lined (i.e. sample "time to events", the first event being the one selected). This means that key events in depres-sion such as attempted suicides, adverse events or any other event for which there is adequate data, can be easily taken into account.
DES models seem to be a promising simulation tech-nique, very flexible and easy to follow for any analyst who may not be familiar either with the key aspects of the dis-ease or with simulation tools in general. DES models are able to overcome Markov model limitations particularly in their ability to take into account multiple events, which can be crucial when trying to depict disease progression as close to reality as possible.
IV. Discussion
When modelling the course of disease it is important to consider as many disease-specific risk factors as possible in order to provide an informed view of outcomes that may occur. The word 'may' is important because no model can predict any outcome with 100% accuracy. Modelling techniques are evolving in response to criticism aimed at improving their predictive abilities. Discrete event simula-tion further contributes to the field. While Markov models have served – and continue to serve – the scientific and decision-making communities well, we are of the opinion
that DES also offers additional possibilities for modelling patients with depression and their progression through the healthcare system. A frequent criticism of depression models is that they are often too short and, therefore, una-ble to accurately reflect the true progression of the disor-der. In the present case, the DES timeframe was large enough to capture all events occurring during the disease span and even beyond (periods of recovery). As such, dis-tinction between relapses and recurrences (according to whether the patient is experiencing a new episode of depression or not) were shown to be important issues to be taken into consideration in order to more precisely assess the capacity of a given strategy to delay further risk of developing depressive symptoms. The number of previ-ous depressive events, their duration and severity together with patients' adherence to therapy were also proven to be key factors that needed be taken into account in the com-putational framework.
Despite their lack of memory, Markov models managed to handle the problem of patient history by specifying vari-ous health states defined according to risk levels (low, moderate, high risk of relapse). The issue of disease per-sistence was also addressed, but at the expense of defining multiple temporary health states. A major drawback, how-ever, persists in the handling of multiple events. If analysts truly seek to portray reality as closely as possible, they should consider scenarios that are more complicated and that take into account, for example, suicidal behaviour and patients' attitudes towards treatment. In such situa-tions they may be more likely to employ more elaborate modelling methods such as discrete event simulation.
inclu-Discrete Event Simulation algorithm
Figure 6
sion alongside a clinical trial, DES may help in defining the requirements of a definitive economic analysis and determine a data collection strategy.
There are certain limits to DES that deserve to be pointed out. First, greater flexibility may only be reached at the expense of supplementary specialist analytic knowledge, which may reduce the evaluator's direct access to the model. Also, it may take time to develop, implement and verify the conceptual model. Moreover, individual-based models like DES models are highly time-consuming, as multiple replications are needed to get good estimates of mean effects. However, variance reduction methods are available that can reduce the number of replications and time needed [48]. Finally, DES may induce over-specifica-tion, whereby possible patient pathways become more complex than necessary, thus implying an increase in data requirements.
We deliberately chose here to focus on the methodologi-cal aspects of the modelling methods, regardless of the therapeutic strategies and without any costing purpose. However, costing would be equally feasible in both meth-ods: DES models would use variables associated to each event experienced, while Markov models would associate a monetary value to health states.
In order to provide decision makers with a fully specified tool aimed at prioritizing actions for relapse prevention in depression, further work should incorporate, in the form of a DES model, both clinical and economic data in accordance with national and international clinical and pharmacoeconomic guidelines. A practical example of discrete event simulation model for depression, together with judicious distribution choice on parameters (among Weibull, Log-logistic and more generally Gamma distri-butions) will be the next step of this research, with an aim towards benchmarking results from a DES model with those from standard simulation models.
V. Conclusion
When considering the practical examples previously pre-sented, discrete event simulation appears to be comple-mentary and appropriate modelling method when applied to depression. Although discrete event simulation has a quite long history in industrial operational research [49-51], it is still not widely used in the assessment of the value of healthcare interventions. DES could provide a comprehensive tool to illustrate the course of depression, thus allowing greater flexibility in depicting the cost-effec-tiveness of prevention interventions for recurrent depres-sion. In general, the greatest advantages DES has to offer are that it allows the analyst to model more complex and dynamic systems compared with other types of modelling and that it permits experiments that might not otherwise
be feasible ("what if?" scenarios) and may provide addi-tional support for expected value of information (EVPI) analyses. The greater flexibility of DES also enables the model to capture more details about the uncertainty in the system being modelled.
Conflicts of interest
This manuscript is part of the doctoral thesis requirements of Agathe Le Lay, H. Lundbeck A/S provided a grant for this study. Clement Francois and Nicolas Despiegel are employees of H. Lundbeck A/S. Gerard Duru declares no conflict of interest.
Acknowledgements
The authors gratefully acknowledge John Cochran for his editorial assist-ance.
References
1. Paykel ES, Brugha T, Fryers T: Size and burden of depressive dis-orders in Europe. Eur Neuropsychopharmacol 2005, 15(4):411-423. 2. Murray CJ, Lopez AD: Alternative projections of mortality and disability by cause 1990–2020: Global Burden of Disease Study. Lancet 1997, 349(9064):1498-1504.
3. Segal ZV, Pearson JL, Thase ME: Challenges in preventing relapse in major depression. Report of a National Institute of Mental Health Workshop on state of the science of relapse preven-tion in major depression. J Affect Disord 2003, 77(2):97-108. 4. Drummond M, Jonsson B, Rutten F: The role of economic
evalu-ation in the pricing and reimbursement of medicines. Health Policy 1997, 40(3):199-215.
5. Sonnenberg FA, Beck JR: Markov models in medical decision making: a practical guide. Med Decis Making 1993,
13(4):322-338.
6. Caro JJ: Pharmacoeconomic analyses using discrete event simulation. Pharmacoeconomics 2005, 23(4):323-332.
7. Keller MB, Boland RJ: Implications of failing to achieve success-ful long-term maintenance treatment of recurrent unipolar major depression. Biol Psychiatry 1998, 44(5):348-360.
8. Akerblad AC, Bengtsson F, von Knorring L, Ekselius L: Response, remission and relapse in relation to adherence in primary care treatment of depression: a 2-year outcome study. Int Clin Psychopharmacol 2006, 21(2):117-124.
9. Keller MB: The long-term treatment of depression. J Clin Psy-chiatry 1999, 60(Suppl 17):41-45.
10. Solomon DA, Keller MB, Leon AC, Mueller TI, Lavori PW, Shea MT,
et al.: Multiple recurrences of major depressive disorder. Am J Psychiatry 2000, 157(2):229-233.
11. Keller MB, Lavori PW, Rice J, Coryell W, Hirschfeld RM: The per-sistent risk of chronicity in recurrent episodes of nonbipolar major depressive disorder: a prospective follow-up. Am J Psy-chiatry 1986, 143(1):24-28.
12. Olfson M, Marcus SC, Tedeschi M, Wan GJ: Continuity of antide-pressant treatment for adults with depression in the United States. Am J Psychiatry 2006, 163(1):101-108.
13. Melfi CA, Chawla AJ, Croghan TW, Hanna MP, Kennedy S, Sredl K:
The effects of adherence to antidepressant treatment guide-lines on relapse and recurrence of depression. Arch Gen Psychi-atry 1998, 55(12):1128-1132.
14. Marcus SM, Young EA, Kerber KB, Kornstein S, Farabaugh AH, Mitch-ell J, et al.: Gender differences in depression: findings from the STAR*D study. J Affect Disord 2005, 87(2–3):141-150.
15. Beck JR, Pauker SG: The Markov process in medical prognosis.
Med Decis Making 1983, 3(4):419-458.
16. NICE guidance on Depression: management of depression in primary and secondary care. 2004.
17. Kennedy SH, Lam RW, Cohen NL, Ravindran AV: Clinical guide-lines for the treatment of depressive disorders. IV. Medica-tions and other biological treatments. Can J Psychiatry 2001,
18. Dardennes R, Lafuma A, Fagnani F, Pribil C, Bisserbe JC, Berdeaux G:
Economic Assessment of a Maintenance Treatment Strat-egy in Prevention of Recurrent Depressive Disorder. Value in Health 2000, 3(1):40-47.
19. Hatziandreu EJ, Brown RE, Revicki DA, Turner R, Martindale J, Levine S, et al.: Cost-Utility of Maintenance Treatment of Recurrent Depression with Sertraline Versus Episodic Treatment with Dothiepin. Pharmacoeconomics 1994, 5(3):249-264.
20. Kamlet MS, Paul N, Greenhouse J, Kupfer D, Frank E, Wade M: Cost-Utility Analysis of Maintenance Treatment for Recurrent Depression. Controlled Clinical Trials 1995, 16(1):17-40.
21. Lafuma A, Dardennes R, Fagnani F, Pribil C, Bisserbe JC, Berdeaux G:
Economic assessment of maintenance treatment of recur-rent depressive disorder with milnacipran versus episode treatment. Encephale-Revue de Psychiatrie Clinique Biologique et Ther-apeutique 1999, 25(5):401-407.
22. Nuijten M, Hardens M, Souetre E: A Markov Process Analysis Comparing the Cost-Effectiveness of Maintenance Therapy with Citalopram Versus Standard Therapy in Major Depres-sion. Pharmacoeconomics 1995, 8(2):159-168.
23. Nuijten M, Hadjadjeba L, Evans C, van den Berg J: Cost effective-ness of fluvoxamine in the treatment of recurrent depres-sion in France. Pharmacoeconomics 1998, 14(4):433-445. 24. Patten SB, Lee RC: Epidemiological theory, decision theory and
mental health services research. Soc Psychiatry Psychiatr Epidemiol
2004, 39(11):893-898.
25. Patten SB, Lee RC: Towards a dynamic description of major depression epidemiology. Epidemiol Psichiatr Soc 2004,
13(1):21-28.
26. Patten SB, Lee RC: Refining estimates of major depression inci-dence and episode duration in Canada using a Monte Carlo Markov model. Med Decis Making 2004, 24(4):351-358.
27. Patten SB: Modelling major depression epidemiology and assessing the impact of antidepressants on population health. Int Rev Psychiatry 2005, 17(3):205-211.
28. Patten SB: Markov models of major depression for linking psy-chiatric epidemiology to clinical practice. Clin Pract Epidemol Ment Health 2005, 1(1):2.
29. Patten SB, Lee RC: Describing the longitudinal course of major depression using Markov models: data integration across three national surveys. Popul Health Metr 2005, 3:11.
30. Davies R: An assessment of models of a health system. J Oper Res Soc 1985, 36(8):679-687.
31. Jacobson S, Hall S, Swisher J: Discrete Event Simulation of Health Care Systems. In Delay Management in Healthcare Systems
Edited by: Hall R. Springer in Health Care Management; 2006. 32. Law A, Kelton W: Simulation Modeling and Analysis 3rd edition. Mc
Graw Hill; 2000.
33. Stahl JE, Rattner D, Wiklund R, Lester J, Beinfeld M, Gazelle GS:
Reorganizing the system of care surrounding laparoscopic surgery: a cost-effectiveness analysis using discrete-event simulation. Med Decis Making 2004, 24(5):461-471.
34. Roderick P, Davies R, Raftery J, Crabbe D, Pearce R, Patel P, et al.:
Cost-effectiveness of population screening for Helicobacter pylori in preventing gastric cancer and peptic ulcer disease, using simulation. J Med Screen 2003, 10(3):148-156.
35. Huybrechts KF, Caro JJ, Wilson DA, O'Brien JA: Health and eco-nomic consequences of sevelamer use for hyperphos-phatemia in patients on hemodialysis. Value Health 2005,
8(5):549-561.
36. Zarkin GA, Dunlap LJ, Hicks KA, Mamo D: Benefits and costs of methadone treatment: results from a lifetime simulation model. Health Econ 2005, 14(11):1133-1150.
37. Rauner M, Brailsford S, Flessa S: Use of discrete-event simulation to evaluate strategies for the prevention of mother-to-child transmission of HIV in developing countries. Journal of the Operational Research Society 2005, 56:222-233.
38. Brown J, Karnon J, Eldabi T, Paul RJ: Using modelling in a phased approach to the economic evaluation of adjuvant therapy for early breast cancer. ABC Trial Steering Committee. Crit Rev Oncol Hematol 1999, 32(2):95-103.
39. Karnon J, Brown J: Selecting a decision model for economic evaluation: a case study and review. Health Care Manag Sci 1998,
1(2):133-140.
40. Ratcliffe J, Young T, Buxton M, Eldabi T, Paul R, Burroughs A, et al.: A simulation modelling approach to evaluating alternative
pol-icies for the management of the waiting list for liver trans-plantation. Health Care Manag Sci 2001, 4(2):117-124.
41. Barton P, Bryan S, Robinson S: Modelling in the economic evalu-ation of health care: selecting the appropriate approach. J Health Serv Res Policy 2004, 9(2):110-118.
42. Brennan A, Chick SE, Davies R: A taxonomy of model structures for economic evaluation of health technologies. Health Econ
2006, 15:1295-1310.
43. Glynn P: On the role of generalized semi-Markov processes in simulation output analysis. Winter Simulation Conference – Pro-ceedings of the 15th conference on Winter simulation 1983, 1:39-44. 44. Glynn P: A GSMP formalism for discrete event systems.
Pro-ceedings of the IEEE 1989, 77(1):14-23.
45. Eddy DM: Accuracy versus transparency in pharmacoeco-nomic modelling: finding the right balance. Pharmacoeconomics
2006, 24(9):837-844.
46. Barton P, Jobanputra P, Wilson J, Bryan S, Burls A: The use of mod-elling to evaluate new drugs for patients with a chronic con-dition: the case of antibodies against tumour necrosis factor in rheumatoid arthritis. Health Technol Assess 2004, 8(11):1-104. 47. Sargent R: Validation and verification of simulation models.
Proceedings of the 2004 Winter Simulation Conference 2004.
48. Shechter S, Schaefer A, Braithwaite R, Roberts M: Increasing the Efficiency of Monte Carlo Cohort Simulationswith Variance Reduction Techniques. Technical note. Medical Decision Making
2006.
49. Christodoulou K, Vlahos K: Variable structure modelling of dynamic industry systems. Journal of the Operational Research Soci-ety 2000, 51:1029-1040.
50. Roy R, Arunachalam R: Parallel discrete event simulation algo-rithm for manufacturing supply chains. Journal of the Operational Research Society 2004, 55:622-629.
51. Davis RM: An interactive simulation in the Health Service.