R E S E A R C H
Open Access
Measurement invariance of the Hopkins
Symptoms Checklist: a novel multigroup
alignment analytic approach to a large
epidemiological sample across eight
conflict-affected districts from a
nation-wide survey in Sri Lanka
Alvin Kuowei Tay
1*, Rohan Jayasuriya
2, Dinuk Jayasuriya
3and Derrick Silove
1Abstract
Background:The alignment method, a novel psychometric approach, represents a more flexible procedure for establishing measurement invariance in geographically, ethnically, or linguistically diverse samples, especially in large epidemiological surveys. Although the Hopkins Symptoms Checklist (HSCL-25) has been used extensively in the field to assess anxiety and depressive symptoms, questions remain about the comparability of findings when the instrument is applied across regions in large-scale national surveys.
Methods:The present study is the first in the field to apply the alignment method to test the structure and measurement invariance of the anxiety and depression dimensions of the HSCL-25 amongst Sri Lankan subpopulations (n= 8456) stratified by geographical regions, levels of past exposure to conflict, and ethnic composition.
Results:Multigroup CFA analysis yielded non-converging models requiring substantial modifications to the models. As a result, multigroup alignment analysis was applied and the results supported the bifactorial structure and measurement invariance of the HSCL-25 across eight (severe and moderate) conflict-affected districts. The alignment analysis based on a good-fitting configural model yielded a metric non-invariance of 22.22% and scalar non-invariance of 5.88% (both under the established 25% threshold). The bifactorial model outperformed the tripartite and other models. In comparison to the anxiety items, the depressive items showed higher levels of metric non-invariance across districts.
Conclusions:Our findings demonstrate the methodological feasibility of applying the alignment method to test the structure and invariance of the HSCL across ethnically diverse populations living in conflict-affected districts in Sri Lanka. Further studies are needed to examine ethnicity and language factors more critically.
* Correspondence:[email protected]
1The Academic Mental Health Unit, Psychiatry Research and Teaching Unit,
Liverpool Hospital; School of Psychiatry, University of New South Wales, Cnr Forbes and Campbell Streets, Liverpool, NSW 2170, Australia
Full list of author information is available at the end of the article
Background
Epidemiological studies undertaken across diverse set-tings in the post-conflict field have shown high preva-lence rates of anxiety and depressive symptoms, the most commonly assessed mental health outcomes to-gether with posttraumatic stress symptoms [1]. Although the Hopkins Symptoms Checklist (HSCL-25) has been used extensively in the field to assess anxiety and depressive symptoms [2], questions remain about the comparability of findings when the instrument is applied across regions, for example, in large-scale national sur-veys. Within the context of the field of transcultural mental health traumatology, measurement invariance al-lows assessment of the extent to which the construct under study is being understood and interpreted in a similar manner by respondent populations that may differ in cultural, ethnic, and linguistic backgrounds [3]. Establishing measurement invariance will indicate whether it is legitimate to compare responses on the anxiety and depression subscales of the HSCL-25 across different pop-ulations within the broader society.
The conventional first step in testing measurement invariance is to assess the configural component, that is, whether the relationship between observed indicators (symptoms) and underlying latent factors is uniform across different subpopulations [4]. Other indices that can be tested subsequently include metric invariance (equivalence in factor loadings) and scalar invariance (equivalence in intercepts), although the debate continues as to whether these tests represent too strict a standard to judge invari-ance [5]. In that regard, it is increasingly acknowledged that the commonly applied method, multigroup confirma-tory factor analysis (MGCFA) in which scalar invariance is required to compare latent mean scores across groups, may set too stringent a standard for testing invariance [6]; in particular, the method may not be suitable for testing invariance across a large number of subgroups given the complexity and the extent of the modifications commonly required to achieve invariance [7]. In that regard, MGCFA involves iterative testing of an increasingly restrictive set of factorial models, commencing with the configural model, and then progressing to models that hold relevant parameters to be equal (factor loadings, intercepts, factor variances, residual variances) [4]. Invariance achieved in factor loadings (referred to as metric invariance) and in-tercepts (referred to as scalar invariance) suggests that item responses are interpreted and understood in a uni-form manner across groups, a prerequisite for comparing group differences [5]. Put simply, measurement invariance implies that the construct being measured by an instru-ment is understood and responded to in an equivalent manner across two or more groups. If measurement vari-ance is found, this means that there are fundamental quantitative and/or qualitative differences in the construct
or the procedure being used to measure it across study groups, disparities that may be attributed to metric differ-ences (differential item loadings on factorial solutions) or scalar variance (differential intercepts or response styles). However, it has been argued that the requirements of metric and scalar invariance as specified within MGCFA may be overly restrictive particularly when comparing inter-individual or between-group differences in mental health reports across cross-cultural groups, given that it is expected that responses will vary to some extent accord-ing to individual and cultural influences [7, 8].
The alignment method, a novel approach developed and tested in a large cross-country survey [8], represents a more flexible procedure for establishing invariance when a number of subpopulations (for example, residing in different regions) are included in the composite sample. In contrast to MGCFA, the alignment model-ling approach allows for an examination of inter-individual and between-group differences that influence variance (which may be related to the comprehension and interpretation of the measure) across a large num-ber of groups that differ in demographic and other characteristics [8].
The HSCL-25 has been used extensively across clinic and community settings amongst culturally diverse sam-ples of asylum seekers [9], refugees [10], and other post-conflict populations in high and low-medium income countries (LMICs) [2]. The measure has been adapted and translated for use in conflict settings in Asia [11– 13], the Middle East [14], Africa [15, 16], and the former Yugoslavia [17, 18]. The HSCL-25 is currently available in a wide range of languages including Arabic [19], Hmong [20], Kiswahili [16], Pashto [14], Farsi, Dari, Bosnian, Somali [9], Vietnamese [21], Swedish [22], Serbo-Croatian, Russian [23], Tibetan [13], Indochinese [24, 25], and Khmer.
although all items showed some degree of differential item functioning (DIF), Indonesia being the only country where the prevalence estimate of depression could have been overestimated due to possible measurement vari-ance [27].
At the same time, other studies focusing on the HSCL in high-income, Anglophone countries have found sup-port for a tripartite factorial model [28, 29] including (in addition to anxiety and depression) a mixed domain of symptoms, variously labelled as“general/mixed distress”, “autonomic anxiety”, and “somatic depression.” Never-theless, greatest consistency has been found in the asso-ciation between potentially traumatic events (PTEs) and ongoing adversities typical of post-conflict populations, with the HSCL-25 anxiety and depression scales, re-spectively, with some minor differences in these relation-ships between the two symptom domains [9, 15, 30, 31].
Extant studies investigating the measurement invari-ance of the HSCL-25 have been restricted to small and non-representative samples [23, 32], often comparing different countries [9] where the constituent populations have been exposed to widely differing conditions and traumatic events. Remarkably, no studies have investigated the measurement invariance of the anxiety and depressive domains of the HSCL-25 in a large, representative population sample in a post-conflict country.
The population of Sri Lanka has experienced a decades-long civil war waged between the government (GoSL) and the Liberation Tigers of Tamil Eelam (LTTE), a conflict that came to an end in 2009. During the prolonged period of violence, there was extensive physical injuries and deaths, mass displacement of whole populations, and extensive deprivations, including of food, water, and medical care [33]. Prior to the conclu-sion of the armed conflict, the LTTE claimed a large portion of the territories in the north-eastern region of Sri Lanka, forming a de facto state, with its administra-tive capital situated in Kilinochchi. By the end of the conflict in 2009, over 36% of the entire population of the north was displaced, including virtually all civilians of the former LTTE controlled areas (Mullativu, Killinochi) [34]. Within three years, 236,429 (90%) of the internally displaced persons (IDPs) had returned to their homes [35]. Sinhalese and Sri Lankan Tamils represent the two largest ethnic groups in Sri Lanka, numbering approxi-mately 74 and 12 percent of the population respectively, with other minority groups comprising Indian Tamils (6%) and Sri Lankan Muslims/Moors (9%) [36].
The historical and demographic context of Sri Lanka offered an opportunity to test the measurement invari-ance of the anxiety and depressive symptom dimensions of the HSCL-25 amongst subpopulations that differed in ethnic composition, first languages, and regional expos-ure to conflict. Given these distinctive aspects across
different subpopulations, it is imperative to assess for possible measurement variance when comparing the prevalence of depressive and anxiety symptoms at a dis-trict or regional level. Our objective was to apply a novel statistical approach, the multigroup alignment method, to test the bifactorial structure and measurement invariance of the anxiety and depression dimensions of the HSCL-25 amongst Sri Lankan subpopulations stratified by geo-graphical regions, levels of past exposure to conflict, and ethnic composition.
Methods Sample
Our study draws on mental health data collected during a representative survey (n =20,632) conducted during February through April, 2014 across Sri Lanka. The pri-mary purpose of the study was to gather data about mi-gration intentions, the mental health component being added as a discrete component. Details of the study have been published elsewhere [37]. In summary, a multi-stage sampling design was used, covering all districts of Sri Lanka that were exposed to conflict (n =8), nine districts randomly selected from the remaining 16, and Colombo, the capital.
Sampling units were selected at the second lowest ad-ministrative level (Grama Sevaka, DS or Divisional Secretary’s Division) using the probability proportion to size (PPS) method based on national census data gath-ered in 2012. Eight DSs were selected for large districts and four for small districts (smaller districts were de-fined as those with fewer than 4 DSs). Next, we selected units of the lowest administrative level (Grama Niladari, GN, also known as “village officer”), using PPS. Five GNs were selected within each DS for large districts, and 10 GNs were selected within each DS for small dis-tricts. Finally, we randomly selected 28 households at the GN level, and randomly selected an adult household member within the dwelling. The response rate from the 26,600 people approached was 81%.
Measures
Hopkins Symptoms Checklist (HSCL)
distinct populations from Sub-Saharan Africa [16], East-ern Europe [17], and Asia [11, 13, 25, 42] yielded sound internal consistency (Cronback’s alpha≥.90 for the en-tire scale; ≥.85 for the depression subscale, ≥.76 for the anxiety subscale), inter-rater reliability (intra-class r≥.80), and test-retest reliability (≥.80) for the scale as a whole. Respondents rated each symptom according to the conventional four-point frequency scale (1 = not at all, 2 = a little, 3 = quite a lot, 4 = extremely). In the present study, the HSCL-25 was tested for its ease of ad-ministration in a pilot study of 1000 persons including all relevant ethnic groups. In addition, we found a sound level of test-retest reliability for the HSCL-25 amongst a random subsample (n =1000) of respondents from the present sample re-interviewed following the full survey (depression subscale: Kappa = 0.80; anxiety subscale: Kappa = 0.85; full measure: 0.89). We defined“ symptom-atic depression” and“symptomatic anxiety” according to the conventional international cut-off scores of >1.75 for each subscale.
Personnel and training
Members of the research team trained local field workers (n =83) in applying the measures using an electronic platform. The interviews were conducted in the home language (either Sinhala or Tamil) in strict privacy and responses were entered directly into tablet devices. Data were accessed daily by the lead survey manager alone.
Statistical analysis
We stratified districts by severity of conflict based on the extent of exposure to the most recent episode of war (2008–2009) and the level of population displacement (>75%), information accessible from national statistical data [34]. We thereby derived two broad groupings, se-vere conflict/displacement areas (Mannar, Kilinochchi, Mullaitivu) and moderate conflict areas (Jaffna, Batti-caloa, Trincomalee, Vavuniya, Puttalam), collectively including 8456 persons. In addition, we further subdi-vided the sample by ethnicity (Sinhalese, Tamils, and Moors/Burghers).
We calculated descriptive statistics in relation to socio-demographic variables and prevalence of anxiety and de-pressive symptoms, stratified by districts of high conflict exposure ((Mannar, Kilinochchi, Mullativu) and moder-ate conflict exposure (Jaffna, Batticaloa, Trincomalee, Vavuniya, Puttalam). Puttalam (23.5%) had the lowest population displacement ratio compared to the other moderate conflict areas and was used as the reference group. We made comparisons using chi-square statistics adjusted for sampling weights (F-adjusted tests).
The first step of the alignment analysis involves testing a configural model (base model) in which all intercepts
and loadings are unconstrained, with the factor means and variances fixed to 0 and 1 respectively [8]. The sec-ond step involves optimization of the measurement param-eters (factor loadings, intercepts/thresholds) allowing an optimal invariance pattern to be identified based on mini-mum non-invariant parameters using a simplicity function similar to the rotation criteria of exploratory factor analysis (EFA). The simplicity function (F) represents the amount of accumulated measurement non-invariance whose con-tributions can be isolated for each variable (i.e. smaller sim-plicity function contributes to greater level of invariance) with the ultimate goal of locating the optimal solution that minimizes the simplicity function. The third step involves adjustment of the factor means and variances according to the optimal alignment, analogous to the rotated model of EFA [7]. In addition, we compared the fit of a series of alignment models tested using the fixed alignment ap-proach in with the FIXED alignment apap-proach in which the factor mean was fixed to 0 in the reference group (rep-resented by Puttalam). We tested the same models using the FREE method (all factor means were freely estimated) which was poorly identified and therefore FIXED method (with Putalam fixed as the reference category) was used to estimate the model. The FIXED alignment optimization method is recommended in instances of minimal metric non-invariance, a condition commonly occurring in an analysis of a small number of groups [7].
Given that our focus was on the HSCL-25 scales of anxiety and depression, the most widely used indices in the field, the base configural model tested specified that these two dimensions loaded on their respective latent factors. In addition, however, we tested a three-factor model based on the tripartite model proposed by Clark and Watson (1991) defined by the core constellations of anxiety and depressive symptoms with an additional cluster for non-specific symptoms of insomnia, fatigue, restlessness, weakness, and feeling tense [28]. Prior to the alignment analysis, our Multigroup CFA analysis based on the bi-factorial and three-factorial models failed to sup-port metric invariance across groups. Given the large number of modifications required to potentially achieve convergence, we did not pursue this approach further.
In order to examine for the effect of ethnicity, we tested the bifactorial and tripartite models on subsam-ples stratified by two ethnic groupings (Singhalese or the composite minorities, that is Tamils/Burghers/ Moors). Each model was tested using the FIXED align-ment optimization settings, a recommended approach that estimates all factor means. We used the lowest conflict district (Puttalam) as the reference category when testing the models using the FIXED setting.
non-invariance based on the total number of measurement parameters (metric, scalar) multiplied by the number of groups and divided by the number of non-invariant pa-rameters [8]. In addition, we examined adjusted residuals [(observed–expected) /√[expected x (1 + row total pro-portion) x (1- column total propro-portion)] of each item as a supplementary indicator of model misspecification.
Monte Carlo simulations performed previously on a large cross-country survey dataset indicated that an upper limit of 25% of non-invariant items provides evidence in support of measurement invariance of the measure as a whole [7]. Group-specific factor means were compared and rank-ordered for anxiety and de-pressive dimensions in the final stage following the step-wise alignment optimization procedure.
Given that we applied ordinal variables in our analyses, all models were estimated using WLSMV with numerical integration. The alignment analysis was adjusted for sam-pling weights, stratification, and clustering. Specifically, sampling weights were generated based on varying
response rates at village level, over/under sampling across households, sex and ethnic representations (weighted ac-cording to the national census) across districts.
The analysis was performed in STATA version 14 [43] and Mplus version 7.2 [44].
Results
Sociodemographic characteristics across conflict-affected districts
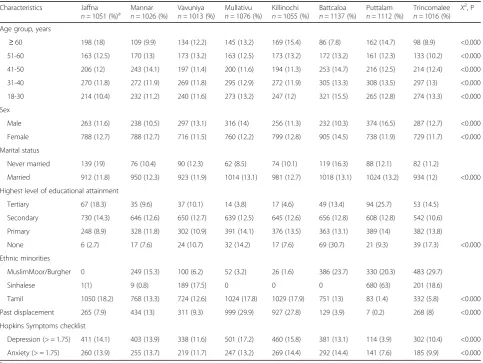
Table 1 reports descriptive statistics for sociodemo-graphic and mental health indices stratified by districts. Weighted chi-square tests indicated that the districts dif-fered significantly in sociodemographic characteristics, ethnicity, exposure to displacement, and mental health indices. Notably, the severe conflict districts (Mannar, Killinochi, Mullativu) were more heavily populated by ethnic minorities including Tamils, Moors, and Bur-ghers. Those residing in Mullativu and Killinochi also re-ported greater levels of displacement compared to the other districts. Depression based on the entire scale
Table 1Descriptive analysis of sociodemographic variables stratified by 8 conflict-affected districts (n =8456)
Characteristics Jaffna
n =1051 (%)a Mannarn =1026 (%) Vavuniyan =1013 (%) Mullativun =1076 (%) Killinochin =1055 (%) Battcaloan =1137 (%) Puttalamn =1112 (%) Trincomaleen =1016 (%) X 2
, P
Age group, years
≥60 198 (18) 109 (9.9) 134 (12.2) 145 (13.2) 169 (15.4) 86 (7.8) 162 (14.7) 98 (8.9) <0.000
51-60 163 (12.5) 170 (13) 173 (13.2) 163 (12.5) 173 (13.2) 172 (13.2) 161 (12.3) 133 (10.2) <0.000
41-50 206 (12) 243 (14.1) 197 (11.4) 200 (11.6) 194 (11.3) 253 (14.7) 216 (12.5) 214 (12.4) <0.000
31-40 270 (11.8) 272 (11.9) 269 (11.8) 295 (12.9) 272 (11.9) 305 (13.3) 308 (13.5) 297 (13) <0.000
18-30 214 (10.4) 232 (11.2) 240 (11.6) 273 (13.2) 247 (12) 321 (15.5) 265 (12.8) 274 (13.3) <0.000
Sex
Male 263 (11.6) 238 (10.5) 297 (13.1) 316 (14) 256 (11.3) 232 (10.3) 374 (16.5) 287 (12.7) <0.000
Female 788 (12.7) 788 (12.7) 716 (11.5) 760 (12.2) 799 (12.8) 905 (14.5) 738 (11.9) 729 (11.7) <0.000
Marital status
Never married 139 (19) 76 (10.4) 90 (12.3) 62 (8.5) 74 (10.1) 119 (16.3) 88 (12.1) 82 (11.2)
Married 912 (11.8) 950 (12.3) 923 (11.9) 1014 (13.1) 981 (12.7) 1018 (13.1) 1024 (13.2) 934 (12) <0.000
Highest level of educational attainment
Tertiary 67 (18.3) 35 (9.6) 37 (10.1) 14 (3.8) 17 (4.6) 49 (13.4) 94 (25.7) 53 (14.5)
Secondary 730 (14.3) 646 (12.6) 650 (12.7) 639 (12.5) 645 (12.6) 656 (12.8) 608 (12.8) 542 (10.6)
Primary 248 (8.9) 328 (11.8) 302 (10.9) 391 (14.1) 376 (13.5) 363 (13.1) 389 (14) 382 (13.8)
None 6 (2.7) 17 (7.6) 24 (10.7) 32 (14.2) 17 (7.6) 69 (30.7) 21 (9.3) 39 (17.3) <0.000
Ethnic minorities
MuslimMoor/Burgher 0 249 (15.3) 100 (6.2) 52 (3.2) 26 (1.6) 386 (23.7) 330 (20.3) 483 (29.7)
Sinhalese 1(1) 9 (0.8) 189 (17.5) 0 0 0 680 (63) 201 (18.6)
Tamil 1050 (18.2) 768 (13.3) 724 (12.6) 1024 (17.8) 1029 (17.9) 751 (13) 83 (1.4) 332 (5.8) <0.000
Past displacement 265 (7.9) 434 (13) 311 (9.3) 999 (29.9) 927 (27.8) 129 (3.9) 7 (0.2) 268 (8) <0.000
Hopkins Symptoms checklist
Depression (> = 1.75) 411 (14.1) 403 (13.9) 338 (11.6) 501 (17.2) 460 (15.8) 381 (13.1) 114 (3.9) 302 (10.4) <0.000
Anxiety (> = 1.75) 260 (13.9) 255 (13.7) 219 (11.7) 247 (13.2) 269 (14.4) 292 (14.4) 141 (7.6) 185 (9.9) <0.000
score was higher in Mullativu (17.2%) and anxiety in Killinochi (14.4%) and Batticola (14.4%), compared to the remaining populations.
Prevalence of anxiety and depressive symptoms stratified by conflict-affected districts
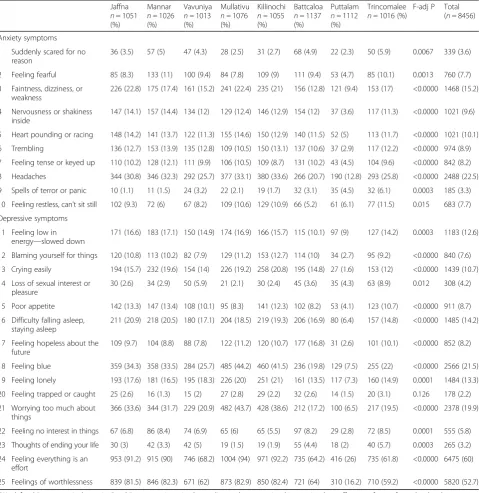
Table 2 indicates that the prevalence of individual anx-iety and depressive symptoms varied by district. The most widely endorsed symptoms across the conflict-affected districts included headaches (23%), feeling blue (22%), ongoing worries (20%), feeling everything is an effort (60%), and sense of worthlessness (53%) with populations in the severe conflict districts reporting higher prevalence of these symptoms compared to those in the moderate conflict districts.
Joint invariance testing of 8 conflict-affected districts
Table 3 reports fit statistics for the configural models tested using different alignment optimization settings. The results showed that the bi-factorial model tested using the FIXED setting (with the moderate-minimal conflict zone as the reference category) indicated a good fit, supported by lowest values of AIC and BIC com-pared to the other models. Univariate residual analysis of the item pool showed that the adjusted residual values of all items fell within the 2 SDs from the mean, noting the small cell sizes due to the difference between the cell’s observed and expected frequency (with 13 items having a residual of less than−2) (Additional file 1).
The data suggest that, in spite of the expected level of non-invariance, it was possible to achieve measurement invariance of the HSCL-25 as a whole across eight conflict-affected districts.
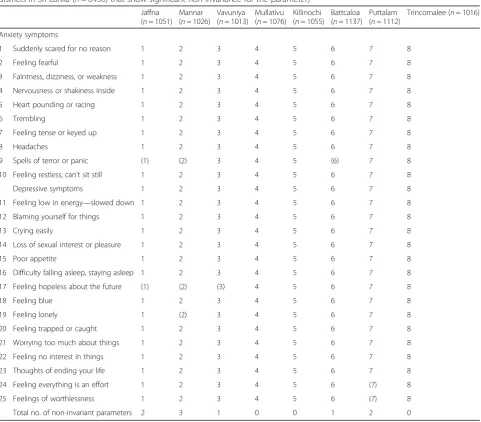
The alignment analysis yielded an average metric (factor loading) non-invariance of 22.22% (well below the upper threshold of 25%). The districts that showed a relatively higher level of metric non-invariance (judged by the number of non-invariant metric parameters esti-mated in that group) included Mannar (number of in-variant parameters = 3) and Putalam (n =2), but again, these indices were well below the 25% threshold.
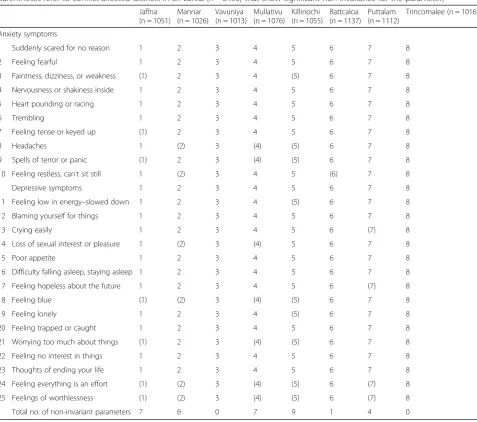
The analysis of scalar invariance yielded an average (intercept) scalar non-invariance of 5.88% (<25%). The districts that showed somewhat higher levels of scalar non-invariance (judged by the number of non-invariant scalar parameters estimated in that group) included Kill-inochi (n =9), Mullativu (n =8), Jaffna (n =7), Mannar (n =6) (Table 5).
Tables 4 and 5 report multigroup alignment analysis of metric and scalar invariance of the HSCL item pool across eight conflict affected districts. In comparison to the anxiety items, the depressive dimension showed a higher level of metric non-invariance, that is, the factor loadings associated with these items differed significantly
across districts, included feeling blue, ongoing worries, feeling everything is an effort. Most anxiety and depres-sive items showed scalar invariance with the exception of the symptom of worthlessness. Table 6 reports the es-timated alignment factor means based on the final model with metric and scalar invariance. The results indicated that the districts rank-ordered as having the highest anxiety mean scores are Jaffna, Mannar, Trincomalee, Killinochi, Mullativu, Batticola, Vavuniya, and Puttalam; and for depression, Trincomlaee, Jaffna, Batticola, Mannar, Mullativu, Killinochi, Vavuniya, and Puttalam. The additional configural models based on stratified samples of ethnic subgroups failed to converge.
Discussion
Our study tested the bifactorial structure and the meas-urement invariance of the HSCL-25 across eight conflict-affected districts, with the moderate-minimal conflict area (Putalam) fixed as the reference group. The bifactorial model outperformed the tripartite model. Our findings therefore provide support for the bifactorial model in which the HSCL items were divided into the clinically conventional dimensions of anxiety and de-pressive symptoms, a common structure identified across past studies in the post-conflict field [13, 14, 17, 26]. Our findings provide the first analysis of the meas-urement invariance of the HSCL in subpopulations across a broad range of geographic regions using a novel statistical method. Our findings show that, in spite of the level of non-invariance identified in the HSCL items, an expected outcome in transcultural measurement test-ing [3], it was possible to achieve invariance for the anx-iety and depression dimensions of the measure across a number of conflict-affected groups that differ in geo-graphical location. A further validation of our findings was that populations residing in the most severe conflict areas reported a substantially higher prevalence of anx-iety and depression compared to moderate and minimal conflict areas, a pattern that is broadly consistent with our recent analysis of the same dataset, thereby attesting to the construct validity of anxiety-depression at least in this population [45]. The severe conflict districts (Mannar, Killinochi, Mullativu) were heavily populated by ethnic minorities including Tamils, Moors, and Burghers. Configural models based on stratified samples of ethnic subgroups failed to converge, a finding that might be attributable to the low representation of ethnic subgroups across some conflict-affected districts.
showed scalar invariance, the exception being the symp-tom of worthlessness.
Our study is the first to employ the multigroup align-ment method in this field, a novel statistical approach for conducting joint invariance testing across a substan-tial number of groups, in this instance eight districts stratified by regional conflict exposure and which differ in ethnic composition. In addition, the sample size was large and was from the largest study in the post-conflict field in general and Sri Lanka in particular. The
alignment method offers greater flexibility compared to conventional Multigroup CFA in that the former relaxes the restrictive nature of iterative testing of metric and scalar invariance by applying the configural model in a manner that automatically identifies the optimal solution based on the minimal degree of non-invariance in all relevant measurement parameters [7].
Our analysis identified several items of the depres-sion and anxiety scales as showing the greater degree of scalar non-invariance including feeling blue, Table 2Prevalence (%) of anxiety and depressive symptoms across 8 conflict-affected districts (n= 8456) in Sri Lanka
Jaffna
n= 1051 (%)
Mannar
n =1026 (%)
Vavuniya
n =1013 (%)
Mullativu
n =1076 (%)
Killinochi
n =1055 (%)
Battcaloa
n =1137 (%)
Puttalam
n =1112 (%)
Trincomalee
n =1016 (%)
F-adj P Total (n =8456)
Anxiety symptoms
1 Suddenly scared for no reason
36 (3.5) 57 (5) 47 (4.3) 28 (2.5) 31 (2.7) 68 (4.9) 22 (2.3) 50 (5.9) 0.0067 339 (3.6)
2 Feeling fearful 85 (8.3) 133 (11) 100 (9.4) 84 (7.8) 109 (9) 111 (9.4) 53 (4.7) 85 (10.1) 0.0013 760 (7.7)
3 Faintness, dizziness, or weakness
226 (22.8) 175 (17.4) 161 (15.2) 241 (22.4) 235 (21) 156 (12.8) 121 (9.4) 153 (17) <0.0000 1468 (15.2)
4 Nervousness or shakiness inside
147 (14.1) 157 (14.4) 134 (12) 129 (12.4) 146 (12.9) 154 (12) 37 (3.6) 117 (11.3) <0.0000 1021 (9.6)
5 Heart pounding or racing 148 (14.2) 141 (13.7) 122 (11.3) 155 (14.6) 150 (12.9) 140 (11.5) 52 (5) 113 (11.7) <0.0000 1021 (10.1)
6 Trembling 136 (12.7) 153 (13.9) 135 (12.8) 109 (10.5) 150 (13.1) 137 (10.6) 37 (2.9) 117 (12.2) <0.0000 974 (8.9)
7 Feeling tense or keyed up 110 (10.2) 128 (12.1) 111 (9.9) 106 (10.5) 109 (8.7) 131 (10.2) 43 (4.5) 104 (9.6) <0.0000 842 (8.2)
8 Headaches 344 (30.8) 346 (32.3) 292 (25.7) 377 (33.1) 380 (33.6) 266 (20.7) 190 (12.8) 293 (25.8) <0.0000 2488 (22.5)
9 Spells of terror or panic 10 (1.1) 11 (1.5) 24 (3.2) 22 (2.1) 19 (1.7) 32 (3.1) 35 (4.5) 32 (6.1) 0.0003 185 (3.3)
10 Feeling restless, can't sit still 102 (9.3) 72 (6) 67 (8.2) 109 (10.6) 129 (10.9) 66 (5.2) 61 (6.1) 77 (11.5) 0.015 683 (7.7)
Depressive symptoms
11 Feeling low in energy—slowed down
171 (16.6) 183 (17.1) 150 (14.9) 174 (16.9) 166 (15.7) 115 (10.1) 97 (9) 127 (14.2) 0.0003 1183 (12.6)
12 Blaming yourself for things 120 (10.8) 113 (10.2) 82 (7.9) 129 (11.2) 153 (12.7) 114 (10) 34 (2.7) 95 (9.2) <0.0000 840 (7.6)
13 Crying easily 194 (15.7) 232 (19.6) 154 (14) 226 (19.2) 258 (20.8) 195 (14.8) 27 (1.6) 153 (12) <0.0000 1439 (10.7)
14 Loss of sexual interest or pleasure
30 (2.6) 34 (2.9) 50 (5.9) 21 (2.1) 30 (2.4) 45 (3.6) 35 (4.3) 63 (8.9) 0.012 308 (4.2)
15 Poor appetite 142 (13.3) 147 (13.4) 108 (10.1) 95 (8.3) 141 (12.3) 102 (8.2) 53 (4.1) 123 (10.7) <0.0000 911 (8.7)
16 Difficulty falling asleep, staying asleep
211 (20.9) 218 (20.5) 180 (17.1) 204 (18.5) 219 (19.3) 206 (16.9) 80 (6.4) 157 (14.8) <0.0000 1485 (14.2)
17 Feeling hopeless about the future
109 (9.7) 104 (8.8) 88 (7.8) 122 (11.2) 120 (10.7) 177 (16.8) 31 (2.6) 101 (10.1) <0.0000 852 (8.2)
18 Feeling blue 359 (34.3) 358 (33.5) 284 (25.7) 485 (44.2) 460 (41.5) 236 (19.8) 129 (7.5) 255 (22) <0.0000 2566 (21.5)
19 Feeling lonely 193 (17.6) 181 (16.5) 195 (18.3) 226 (20) 251 (21) 161 (13.5) 117 (7.3) 160 (14.9) 0.0001 1484 (13.3)
20 Feeling trapped or caught 25 (2.6) 16 (1.3) 15 (2) 27 (2.8) 29 (2.2) 32 (2.6) 14 (1.5) 20 (3.1) 0.126 178 (2.2)
21 Worrying too much about things
366 (33.6) 344 (31.7) 229 (20.9) 482 (43.7) 428 (38.6) 212 (17.2) 100 (6.5) 217 (19.5) <0.0000 2378 (19.9)
22 Feeling no interest in things 67 (6.8) 86 (8.4) 74 (6.9) 65 (6) 65 (5.5) 97 (8.2) 29 (2.8) 72 (8.5) 0.0001 555 (5.8)
23 Thoughts of ending your life 30 (3) 42 (3.3) 42 (5) 19 (1.5) 19 (1.9) 55 (4.4) 18 (2) 40 (5.7) 0.0003 265 (3.2)
24 Feeling everything is an effort
953 (91.2) 915 (90) 746 (68.2) 1004 (94) 971 (92.2) 735 (64.2) 416 (26) 735 (61.8) <0.0000 6475 (60)
25 Feelings of worthlessness 839 (81.5) 846 (82.3) 671 (62) 873 (82.9) 850 (82.4) 721 (64) 310 (16.2) 710 (59.2) <0.0000 5820 (52.7)
±
ongoing worries, feeling everything is an effort, and worthlessness. These findings are consistent with other studies that found variations in depression scores yielded by different instruments across cultur-ally diverse communities such as the Korean [46], Japanese [47], Chinese [48] populations, with lower intercepts generally being recorded amongst the East
Asian communities who exhibit a tendency towards emotional or affective suppression.
Our findings indicate that there may be substantial variations in the manner that some symptoms of de-pression and anxiety are understood and interpreted across geographically dispersed populations with dif-ferent ethnic and language distributions, suggesting Table 3Fit statistics for invariance configural models tested using the alignment method across 8 conflict-affected districts
Configural models Alignment setting No. of parameters Log AIC BIC
1 Two-factor Fixed 615 −18271.02 37772.04 42105.44
2 Three-factor Fixed 623 −18901.53 39049.06 43438.93
Logloglikelihood,AICAkaike,BICBayesian Information Criteria. Note: We tested a three-model based on the tripartite model proposed by Clark and Watson (1991) including the core constellations of anxiety-depressive symptoms and an additional domain of non-specific symptoms (insomnia, fatigue, restlessness, weakness, feeling tense). Models 1 and 2 tested using FREE method (all factor means were freely estimated) were poorly identified and therefore FIXED method (with Putalam fixed as the reference category) was used to estimate the model
Table 4Metric invariance (factor loadings) for anxiety and depressive symptoms (numbers in parentheses refer to conflict-affected districts in Sri Lanka (n= 8456) that show significant non-invariance for the parameter)
Jaffna (n= 1051)
Mannar (n= 1026)
Vavuniya (n= 1013)
Mullativu (n= 1076)
Killinochi (n= 1055)
Battcaloa (n= 1137)
Puttalam (n= 1112)
Trincomalee (n= 1016)
Anxiety symptoms
1 Suddenly scared for no reason 1 2 3 4 5 6 7 8
2 Feeling fearful 1 2 3 4 5 6 7 8
3 Faintness, dizziness, or weakness 1 2 3 4 5 6 7 8
4 Nervousness or shakiness inside 1 2 3 4 5 6 7 8
5 Heart pounding or racing 1 2 3 4 5 6 7 8
6 Trembling 1 2 3 4 5 6 7 8
7 Feeling tense or keyed up 1 2 3 4 5 6 7 8
8 Headaches 1 2 3 4 5 6 7 8
9 Spells of terror or panic (1) (2) 3 4 5 (6) 7 8
10 Feeling restless, can't sit still 1 2 3 4 5 6 7 8
Depressive symptoms 1 2 3 4 5 6 7 8
11 Feeling low in energy—slowed down 1 2 3 4 5 6 7 8
12 Blaming yourself for things 1 2 3 4 5 6 7 8
13 Crying easily 1 2 3 4 5 6 7 8
14 Loss of sexual interest or pleasure 1 2 3 4 5 6 7 8
15 Poor appetite 1 2 3 4 5 6 7 8
16 Difficulty falling asleep, staying asleep 1 2 3 4 5 6 7 8
17 Feeling hopeless about the future (1) (2) (3) 4 5 6 7 8
18 Feeling blue 1 2 3 4 5 6 7 8
19 Feeling lonely 1 (2) 3 4 5 6 7 8
20 Feeling trapped or caught 1 2 3 4 5 6 7 8
21 Worrying too much about things 1 2 3 4 5 6 7 8
22 Feeling no interest in things 1 2 3 4 5 6 7 8
23 Thoughts of ending your life 1 2 3 4 5 6 7 8
24 Feeling everything is an effort 1 2 3 4 5 6 (7) 8
25 Feelings of worthlessness 1 2 3 4 5 6 (7) 8
Total no. of non-invariant parameters 2 3 1 0 0 1 2 0
that these items may not be as robust in representing the emotional status of the Sri Lankan society as a whole [49, 50]. Specifically, past studies found greater prevalence of somatic symptoms relative to psycho-logical or behavioural symptoms amongst individuals presented with depressive and anxiety disorders, sug-gesting that the reaction patterns differ to some ex-tent across cultures [51–54]. It is plausible therefore that the items identified in our analysis as being non-invariant may correspond more closely to the western construct of depression.
The alignment method used in our analysis is a novel approach that allows for joint invariance testing of a large number of groups. Our study is the first in the post-conflict field to test the bifactorial structure and measurement invariance of the anxiety and depression
dimensions of the HSCL-25. In undertaking the analysis, we drew on a nation-wide survey of Sri Lankan popula-tions stratified across regions exposed to severe and moderate levels of conflict. Nevertheless, there are limi-tations in this study. Although previously used in re-search in Sri Lanka, it is acknowledged that the HSCL-25 was not re-calibrated against a gold standard clinical interview amongst all ethnic subpopulations studied.
Establishing measurement invariance across ethnic and linguistic groups living in different geographic re-gions is important for both theoretical and practical rea-sons. There is a long legacy of debate focusing on the transcultural equivalence of mental health categories such as depression and anxiety across culturally distinct communities [52, 55–58]. Critics of the notion of univer-sality argue that diagnoses such as these are culture Table 5Scalar invariance (intercepts) for aligned threshold parameters for anxiety and depressive symptoms (numbers in
parentheses refer to conflict-affected districts in Sri Lanka (n = 8456) that show significant non-invariance for the parameter) Jaffna
(n = 1051) Mannar (n = 1026)
Vavuniya (n = 1013)
Mullativu (n = 1076)
Killinochi (n = 1055)
Battcaloa (n = 1137)
Puttalam (n = 1112)
Trincomalee (n = 1016)
Anxiety symptoms
1 Suddenly scared for no reason 1 2 3 4 5 6 7 8
2 Feeling fearful 1 2 3 4 5 6 7 8
3 Faintness, dizziness, or weakness (1) 2 3 4 (5) 6 7 8
4 Nervousness or shakiness inside 1 2 3 4 5 6 7 8
5 Heart pounding or racing 1 2 3 4 5 6 7 8
6 Trembling 1 2 3 4 5 6 7 8
7 Feeling tense or keyed up (1) 2 3 4 5 6 7 8
8 Headaches 1 (2) 3 (4) (5) 6 7 8
9 Spells of terror or panic (1) 2 3 (4) (5) 6 7 8
10 Feeling restless, can't sit still 1 (2) 3 4 5 (6) 7 8
Depressive symptoms 1 2 3 4 5 6 7 8
11 Feeling low in energy–slowed down 1 2 3 4 (5) 6 7 8
12 Blaming yourself for things 1 2 3 4 5 6 7 8
13 Crying easily 1 2 3 4 5 6 (7) 8
14 Loss of sexual interest or pleasure 1 (2) 3 (4) 5 6 7 8
15 Poor appetite 1 2 3 4 5 6 7 8
16 Difficulty falling asleep, staying asleep 1 2 3 4 5 6 7 8
17 Feeling hopeless about the future 1 2 3 4 5 6 (7) 8
18 Feeling blue (1) (2) 3 (4) (5) 6 7 8
19 Feeling lonely 1 2 3 4 (5) 6 7 8
20 Feeling trapped or caught 1 2 3 4 5 6 7 8
21 Worrying too much about things (1) 2 3 (4) (5) 6 7 8
22 Feeling no interest in things 1 2 3 4 5 6 7 8
23 Thoughts of ending your life 1 2 3 4 5 6 7 8
24 Feeling everything is an effort (1) (2) 3 (4) (5) 6 (7) 8
25 Feelings of worthlessness (1) (2) 3 (4) (5) 6 (7) 8
Total no. of non-invariant parameters 7 6 0 7 9 1 4 0
bound and do not necessarily correspond with concepts of suffering across diverse cultures [59, 60]. From a pragmatic perspective, even if an assumption of univer-sality is adhered to, consideration needs to be given to the influence of culture, history, language, and religion in shaping understandings of mental disorder categories and the way individuals from different groups may re-spond to systematic inquiries into the symptoms that constitute a particular category. In relation to the HSCL, past studies have shown that measures of depression [27, 61] and anxiety (including PTSD prevalence mea-sured using the HTQ, the most widely used measure in the field [3]) have yielded considerable variations in scores across diverse populations, raising questions about the construct equivalence of these categories across diverse cultures; it is therefore imperative that cross-cultural measures such as the HSCL are adapted to the culture, context, language, and characteristics of each community. In adapting psychiatric measurement tools, researchers in the field have applied mixed-method approaches grounded in etic and emic perspec-tives [62–65], drawing on qualitative data gathered from key informant interviews and focus groups, including lo-cally salient terms and expressions that correspond to categories specified in the contemporary diagnostic systems.
Caution needs to be exercised in concluding that eth-nicity did not influence the pattern of invariance of the measure, particularly given that the small numbers of some ethnic minorities included (Burghers, Moors) meant that they had to be conflated into a single com-posite group, a possible reason why there was non-convergence of the model testing invariance by ethnicity. As such, our findings should be interpreted only as indi-cating broad validation of the construct and ecological validity of the HSCL-25 across conflict-affected popula-tions in Sri Lanka. Finally, while the use of the alignment method is novel in the field of transcultural mental health and it allows for joint-testing of invariance across a large number of groups, further testing and simulation studies based on other samples are required to establish accurate fit indicators and modification indices that can be applied to invariance model testing and refinement. The alignment analysis requires a configural model to be specified correctly prior to further alignment of parame-ters, minimizing the otherwise cumbersome procedure of iterative model modification and respecification in conventional MG-CFA, particularly when testing the in-variance of a large number of items across multiple groups.
Conclusions
A novel aspect of our study is that it is the first in the post-conflict field and in psychiatry in general to employ the alignment method to examine the invariance of the HSCL in a nation-wide epidemiological survey under-taken in a country seven years following an extensive period of conflict that affected large sectors of the Sri Lankan population. Our findings provided a foundation on which future studies may apply the alignment method especially when testing measurement variance and construct validity of psychiatric measures across a large number of culturally diverse groups.
Our findings demonstrate the methodological feasibil-ity of applying the alignment method to test the struc-ture and invariance of the HSCL across ethnically diverse populations living in conflict-affected districts in Sri Lanka. In addition, our findings provide additional support for the HSCL as a screening measure for broadly defined symptoms of anxiety and depression both in community and clinical settings in non-western populations. For example, the HSCL may be applied as a general measure for monitoring population trends, par-ticularly in relation to ecological and social correlates of anxiety and depression, and how changes in the former may influence the trajectory of the latter over time. The data gathered may be valuable in informing public policy in relation to identifying the types of programs that may assist in reducing anxiety and depression in the commu-nity as a whole. Given that the failure of convergence of Table 6Comparisons of factor means of anxiety and depressive
symptoms across 8 conflict-affected districts in Sri Lanka (n= 8456) (factor means are rank-ordered and significant atP= 0.05)
Ranking Group Factor mean
Anxiety symptoms
1 1 (Jaffna) 0.704
2 2 (Mannar) 0.692
3 8 (Trincomalee) 0.642
4 5 (Killinochi) 0.638
5 4 (Mullativu) 0.626
6 6 (Batticola) 0.550
7 3 (Vavuniya) 0.542
8 7 (Puttalam) 0.100
Depressive symptoms
1 8 (Trincomalee) 0.721
2 1 (Jaffna) 0.697
3 6 (Batticola) 0.691
4 2 (Mannar) 0.690
5 4 (Mullativu) 0.655
6 5 (Killinochi) 0.599
7 3 (Vavuniya) 0.571
8 7 (Puttalam) 0.100
a
our alignment model may be related to the low repre-sentation of ethnic minorities within our survey, further studies are needed to examine ethnicity and language factors more critically. Finally, future calibration studies are needed to examine the concurrent validity of the HSCL, based on comparisons with a gold standard clin-ical interview conducted across all ethnic groups, to en-sure that context-specific case thresholds for the HSCL are applied in clinic settings.
Additional file
Additional file 1: Table S7.Adjusted residuals of items of depression and anxiety scales of the HSCL-25. (DOCX 13 kb)
Acknowledgements
Australian National University—Department of Immigration Border Protection Collaborative Research Program.
Funding
Australian National University.
Availability of data and material
All data generated or analysed during this study are included in this published article.
Authors’contributions
AT conducted the analysis; DJ undertook the survey; AT, RJ, DJ, DS drafted and revised the manuscript. All authors approved the manuscript.
Competing interests
The authors have no competing interests.
Consent for publication
All participants provided consent for publication.
Ethics approval and consent to participate
Ethical permission was granted for the study by the Australian National University’s Human Ethics committee (protocol number 2013/677) and by the Ethics Review Committee of Faculty of Medicine, University of Colombo, Sri Lanka (EC-16-121). Oral consent was obtained from respondents given the reluctance of participant to provide written consent.
Author details 1
The Academic Mental Health Unit, Psychiatry Research and Teaching Unit, Liverpool Hospital; School of Psychiatry, University of New South Wales, Cnr Forbes and Campbell Streets, Liverpool, NSW 2170, Australia.2Community Medicine and Public Health, Faculty of Medicine, University of New South Wales, Sydney, NSW, Australia.3Development Policy Centre, Australian National University, Canberra, Australian Capital Territory (ACT), Australia.
Received: 12 September 2016 Accepted: 22 February 2017
References
1. Steel Z, Chey T, Silove D, Marnane C, Bryant RA, Van Ommeren M. Association of torture and other potentially traumatic events with mental health outcomes among populations exposed to mass conflict and displacement: A systematic review and meta-analysis. JAMA. 2009; 302:537–49.
2. Hollifield M, Warner TD, Lian N, Krakow B, Jenkins JH, Kesler J, Stevenson J, Westermeyer J. Measuring trauma and health status in refugees: a critical review. JAMA. 2002;288:611–21.
3. Rasmussen A, Verkuilen J, Ho E, Fan Y: Posttraumatic Stress Disorder Among Refugees: Measurement Invariance of Harvard Trauma Questionnaire Scores Across Global Regions and Response Patterns. Psychol Assess 2015.
4. Steenkamp J, Baumgartner H. Asssessing measurement invariance in cross-national consumer research. J Consum Res. 1998;25:78–107.
5. Cheung G, Rensvold R. Evaluating goodness-of-fit indexes for testing measurement invariance. Struct Equ Model. 2002;9:233–55. 6. Byrne B, Shavelson B, Muthen B. Testing for the equivalence of factor
covariance and mean structures: The issues of partial measurement invariance. Psychol Bull. 1989;105:456–66.
7. Asparouhov T, Muthen B. Multigroup factor analysis alignment. Struct Equ Model Multidiscip J. 2014;21:1–14.
8. Muthen B, Asparouhov T. IRT studies of many groups: the alignment method. Front Psychol. 2014;5:1–7.
9. Jakobsen M, Thoresen S, Johansen LEE. The validity of screening for post-traumatic stress disorder and other mental health problems among asylum seekers from different countries. J Refug Stud. 2011;24:171–86.
10. Lavik NJ, Laake P, Hauff E, Solberg Ø. The use of self-reports in psychiatric studies of traumatized refugees: Validation and analysis of HSCL-25. Nord J Psychiatry. 1999;53:17–20.
11. Hinton WL, Du N, Chen YC, Tran CG, Newman TB, Lu FG. Screening for major depression in Vietnamese refugees: a validation and comparison of two instruments in a health screening population. J Gen Intern Med. 1994;9:202–6.
12. Mollica RF, Wyshak G, de Marneffe D, Khuon F, Lavelle J. Indochinese versions of the Hopkins Symptom Checklist-25: a screening instrument for the psychiatric care of refugees. Am J Psychiatry. 1987;144:497–500. 13. Lhewa D, Banu S, Rosenfeld B, Keller A. Validation of a tibetan translation of
the hopkins symptom checklist-25 and the harvard trauma questionnaire. Assessment. 2007;14:223–30.
14. Ventevogel P, De Vries G, Scholte WF, Shinwari NR, Faiz H, Nassery R, van den Brink W, Olff M. Properties of the Hopkins Symptom Checklist-25 (HSCL-25) and the Self-Reporting Questionnaire (SRQ-20) as screening instruments used in primary care in Afghanistan. Soc Psychiatry Psychiatr Epidemiol. 2007;42:328–35. 15. Vinck P, Pham PN. Association of exposure to violence and potential
traumatic events with self-reported physical and mental health status in the Central African Republic. JAMA. 2010;304:544–52.
16. Kaaya SF, Lee B, Mbwambo JK, Smith-Fawzi MC, Leshabari MT. Detecting depressive disorder with a 19-item local instrument in Tanzania. Int J Soc Psychiatry. 2008;54:21–33.
17. Oruc L, Kapetanovic A, Pojskic N, Miley K, Forstbauer S, Mollica FR, Henderson DC. Screening for PTSD and depression in Bosnia and Herzegovina: validating the Harvard Trauma Questionnaire and the Hopkins Symptom Checklist. International Journal of Culture and Mental Health. 2008;1:105–16.
18. Vukovic IS, Jovanovic N, Kolaric B, Vidovic V, Mollica RF. Psychological and somatic health problems in Bosnian refugees: a three year follow-up. Psychiatr Danub. 2014;26 Suppl 3:442–9.
19. Al-Turkait FA, Ohaeri JU, El-Abbasi AHM, Naguy A. Relationship between symptoms of anxiety and depression in a sample of arab college students using the Hopkins Symptom Checklist 25. Psychopathology. 2011;44:230–41. 20. Mouanoutoua VL, Brown LG. Hopkins Symptom Checklist-25, Hmong
version: a screening instrument for psychological distress. J Pers Assess. 1995;64:376–83.
21. Smith Fawzi MC, Murphy E, Pham T, Lin L, Poole C, Mollica RF. The validity of screening for post-traumatic stress disorder and major depression among Vietnamese former political prisoners. Acta Psychiatr Scand. 1997;95:87–93. 22. Fröjdh K, Håkansson A, Karlsson I. The Hopkins Symptom Cheklist-25 is a
sensitive case-finder of clinically important depressive states in elderly people in primary care. Int J Geriatr Psychiatry. 2004;19:386–90. 23. Kleijn WC, Hovens JE, Rodenburg JJ. Posttraumatic stress symptoms in
refugees: Assessments with the Harvard Trauma Questionnaire and the Hopkins symptom checklist-25 in different languages. Psychol Rep. 2001;88:527–32.
24. Mollica RF, Wyshak G, De Marneffe D. Indochinese versions of the Hopkins Symptom Checklist-25: A screening instrument for the psychiatric care of refugees. Am J Psychiatry. 1987;144:497–500.
25. Silove D, Manicavasagar V, Mollica R, Thai M, Khiek D, Lavelle J, Tor S. Screening for depression and PTSD in a Cambodian population unaffected by war: comparing the Hopkins Symptom Checklist and Harvard Trauma Questionnaire with the structured clinical interview. J Nerv Ment Dis. 2007;195:152–7. 26. Kaaya SF, Fawzi MCS, Mbwambo JK, Lee B, Msamanga GI, Fawzi W. Validity
27. Haroz EE, Bolton P, Gross A, Chan KS, Michalopoulos L, Bass J. Depression symptoms across cultures: an IRT analysis of standard depression symptoms using data from eight countries. Soc Psychiatry Psychiatr Epidemiol. 2016;51:981–91. 28. Clark LA, Watson D. Tripartite Model of Anxiety and Depression:
Psychometric Evidence and Taxonomic Implications. J Abnorm Psychol. 1991;100:316–36.
29. Glaesmer H, Braehler E, Grande G, Hinz A, Petermann F, Romppel M. The German Version of the Hopkins Symptoms Checklist-25 (HSCL-25)–factorial structure, psychometric properties, and population-based norms. Compr Psychiatry. 2014;55:396–403.
30. Mollica RF, Sarajlic N, Chernoff M, Lavelle J, Vukovic IS, Massagli MP. Longitudinal study of psychiatric symptoms, disability, mortality, and emigration among Bosnian refugees. JAMA. 2001;286:546–54.
31. Mollica RF, McInnes K, Sarajlic N, Lavelle J, Sarajlic I, Massagli MP. Disability associated with psychiatric comorbidity and health status in Bosnian refugees living in Croatia. JAMA. 1999;282:433–9.
32. Cepeda-Benito A, Gleaves DH. Cross-ethnic equivalence of the Hopkins Symptom Checklist-21 in European American, African American, and Latino college students. Cult Divers Ethn Minor Psychol. 2000;6:297–308. 33. Somasundaram DJ. Psychiatric morbidity due to war in Northern
Sri Lanka. In: International handbook of traumatic stress syndromes. 1993. p. 333–48.
34. Saparamadu C, Lall A. Resettlement of conflict-induced IDPs in Northern Sri Lanka: Political economy of state policy and practice. In:Book Resettlement of conflict-induced IDPs in Northern Sri Lanka: Political economy of state policy and practice.(Editor ed.^eds.). City. 2014.
35. Siriwardhana C, Adikari A, Pannala G, Siribaddana S, Abas M, Sumathipala A, Stewart R. Prolonged internal displacement and common mental disorders in Sri Lanka: the COMRAID study. PLoS One. 2013;8:e64742.
36. DCS. Population by ethnic group, census years. In:Book Population by ethnic group, census years(Editor ed.^eds.). City. Sri Lanka: Department of Census & Statistics; 2012.
37. Jayasuriya D, Jayasuriya R, Tay AK, Silove D. Associations of mental distress with residency in conflict zones, ethnic minority status, and potentially modifiable social factors following conflict in Sri Lanka: a nationwide cross-sectional study. Lancet Psychiatry. 2016;3:145–53.
38. Husain F, Anderson M, Lopes Cardozo B, Becknell K, Blanton C, Araki D, Vithana EK. Prevalence of war-related mental health conditions and association with displacement status in postwar Jaffna District, Sri Lanka. JAMA. 2011;306:522–31.
39. Silove D, Steel Z, McGorry P, Miles V, Drobny J. The impact of torture on post-traumatic stress symptoms in war-affected Tamil refugees and immigrants. Compr Psychiatry. 2002;43:49–55.
40. Steel Z, Silove D, Bird K, McGorry P, Mohan P. Pathways from war trauma to posttraumatic stress symptoms among Tamil asylum seekers, refugees, and immigrants. J Trauma Stress. 1999;12:421–35.
41. Van Ommeren M, Sharma B, Thapa S, Makaju R, Prasain D, Bhattarai R, De Jong J. Preparing instruments for transcultural research: Use of the translation monitoring form with Nepali-speaking Bhutanese refugees. Transcult Psychiatry. 1999;36:285–301.
42. Mollica RF, Wyshak G, De Marneffe D, Tu B, Yang T, Khuon F. Hopkins Symptom Checklist (HSCL-25): Manual for Cambodian, Laotian and Vietnamese versions. Torture. 1996;6:35–42.
43. StataCorp. Stata Statistical Software: Release 13. In: Book Stata Statistical Software: Release 13 (Editor ed.^eds.). City. 2013.
44. Muthen L, Muthen B. Mplus user's guide. 7th ed. Los Angeles: Muthen & Muthen; 2014.
45. Jayasuriya D, Jayasuriya R, Tay AK, Silove D: Associations of mental distress with residency in conflict zones, ethnic minority status and potentially modifiable social factors following conflict in Sri Lanka. Lancet Psychiatry 2015, In press.
46. Cho MJ, Kim KH. Use of the Center for Epidemiologic Studies Depression (CES-D) Scale in Korea. J Nerv Ment Dis. 1998;186:304–10.
47. Iwata N, Roberts CR, Kawakami N. Japan-U.S. comparison of responses to depression scale items among adult workers. Psychiatry Res. 1995;58:237–45. 48. Li Z, Hicks MH. The CES-D in Chinese American women: construct validity,
diagnostic validity for major depression, and cultural response bias. Psychiatry Res. 2010;175:227–32.
49. Somasundaram D. Collective trauma in the Vanni- a qualitative inquiry into the mental health of the internally displaced due to the civil war in Sri Lanka. Int J Ment Heal Syst. 2010;4:22.
50. Somasundaram D: Collective trauma in northern Sri Lanka: A qualitative psychosocial-ecological study. Int J Mental Heal Syst 2007;1:1–27. 51. Beiser, Cargo M, Woodbury M. A comparison of psychiatric disorder in
different cultures: Depressive typologies in Southeast Asian refugees and resident Canadians. Int J Methods Psychiatr Res. 1994;4:157–72. 52. Kleinman. Culture and depression. Cult Med Psychiatry. 1978;2:295–6. 53. Kleinman A. Culture and depression. N Engl J Med. 2004;351:951–3. 54. Lewis-Fernandez R, Hinton DE, Laria AJ, Patterson EH, Hofmann SG, Craske
MG, Stein DJ, Asnaani A, Liao B. Culture and the anxiety disorders: recommendations for DSM-V. Depress Anxiety. 2010;27:212–29. 55. Kleinman A. Mental health in low-income countries. Harv Rev Psychiatry.
1995;3:235–9.
56. Kleinman AM. Depression, somatization and the 'new cross cultural psychiatry'. Soc Sci Med. 1977;11:3–12.
57. Hinton A, Lewis-Fernandez R. The cross-cultural validity of posttraumatic stress disorder: implications for DSM-5. Depress Anxiety. 2011;28:783–801. 58. Hinton DE, Park L, Hsia C, Hofmann S, Pollack MH. Anxiety disorder
presentations in Asian populations: a review. CNS Neurosci Ther. 2009;15:295–303.
59. Lewis-Fernández R, Guarnaccia P, Ruiz P. Culture-bound syndromes. In: Kaplan & Sadock's Comprehensive Textbook of Psychiatry. 2009. p. 2519–38. 60. Littlewood R, Lipsedge M. Culture-bound syndromes. Recent Adv Clin
Psychiatry. 1985;5:105–42.
61. Kessler RC, Bromet EJ. The epidemiology of depression across cultures. Annu Rev Public Health. 2013;34:119–38.
62. Betancourt TS, Bass J, Borisova I, Neugebauer R, Speelman L, Onyango G, Bolton P. Assessing local instrument reliability and validity: A field-based example from northern Uganda. Soc Psychiatry Psychiatr Epidemiol. 2009;44:685–92.
63. Kohrt BA, Jordans MJD, Tol WA, Luitel NP, Maharjan SM, Upadhaya N: Validation of cross-cultural child mental health and psychosocial research instruments: Adapting the Depression Self-Rating Scale and Child PTSD Symptom Scale in Nepal. BMC Psychiatry 2011;11:1–17.
64. Bolton P. Cross-cultural validity and reliability testing of a standard psychiatric assessment instrument without a gold standard. J Nerv Ment Dis. 2001;189:238–42.
65. Tay AK, Rees S, Chen J, Kareth M, Mohsin M, Silove D. The Refugee-Mental Health Assessment Package (R-MHAP); rationale, development and first-stage testing amongst West Papuan refugees. Int J Ment Heal Syst. 2015;9:1–13.
• We accept pre-submission inquiries
• Our selector tool helps you to find the most relevant journal
• We provide round the clock customer support
• Convenient online submission
• Thorough peer review
• Inclusion in PubMed and all major indexing services
• Maximum visibility for your research
Submit your manuscript at www.biomedcentral.com/submit