Demand Response an Alternative Solution to Prevent
Load Shedding Triggering
K. Mollah
1, N.K.C Nair
1,*and R.K. Rayudu
21 Department of Electrical and Computer Engineering, The University of Auckland, New Zealand 2 School of Engineering and Computer Science, Victoria University Wellington, New Zealand
Abstract
This paper investigates an alternative solution to prevent Load Shedding (LS) triggering during underfrequency and proposes a new technique to restore the frequency during emergency events. Demand response (DR) is considered as one of the most promising Smart Grid concepts that can be used to support the peak demand, whereas, LS is an existing last resort method during emergency grid situations. Both schemes aim to balance the load and generation in real-time and restore the frequency very quickly. This paper incorporates integrating Incentive based Demand Response (IDR) with spinning reserve for smaller underfrequency events to manage the system peak demand. It also introduces a new frequency band for an Emergency Demand Response (EDR) as an alternative inexpensive solution that can replace costly spinning reserves and help to prevent LS. An energy index factor is used to identify the consumption pattern of consumers to enable them to participate in IDR. An illustrative example of the performance of the proposed scheme on a modified 15 bus test system is shown. Simulation results on different scenarios confirm that the proposed method is effective to improve the frequency restoration process along with enabling participation of new services.
Keywords: Demand response; under frequency load shedding; rate of change of frequency; energy shedding; and radial distribution system.
Received on 03 August 2014, accepted on 07 September 2014, published on 12 December 2014
Copyright © 2014 K. Mollah et al., licensed to ICST. This is an open access article distributed under the terms of the Creative Commons Attribution licence (http://creativecommons.org/licenses/by/3.0/), which permits unlimited use, distribution and reproduction in any medium so long as the original work is properly cited.
doi: 10.4108/ew.1.3.e2
1. Introduction
The electricity grid has matured whilst the world’s population is still increasing requiring higher quality and quantity of electrical power. Upgrade of the aging infrastructure is needed to cope with the changing and increasing demand on the power system grid.
This necessitates system operators to invest for building additional transmission and distribution assets to help meet the forecast demand and correspondingly build matching generation resources. This generation expansion if not from renewable resources adds to the carbon footprint. On the other hand, the spinning reserve has reduced significantly over the years due to the limited energy resources and increasing demand [1]. For a small active power imbalance, all generators are capable to provide active power reserve within a short period of time
*Corresponding author. Email: [email protected]
by participating through primary control schedules and mechanisms. For smaller frequency decay rate, turbine
governor has enough time to react accordingly. However, for a larger active power imbalance, the governor is too slow to react and the frequency can precipitously fall to an unacceptable level [2]. These large variations can happen during severe system contingencies such as large generator unit trip or transmission line faults. During a large imbalance of power, an Automatic Under Frequency
Load Shedding (AUFLS) technique is triggered to
maintain system balance and acts as a last defence to avoid complete system blackouts.
Existing adaptive AUFLS techniques estimate the total imbalance power adaptively for different system contingent events [3, 4]. The accuracy of the imbalance estimation depends on the rate of change of frequency
Demand Response (DR) is the most common alternative step taken by utilities to tackle peak loads during underfrequency events [1, 6, 7]. DR is the reduction of consumption of electricity energy by the consumer in response to the increase in the heavy burden on the system. Traditional end users of electricity are mostly passive customers who did not contribute to the grid and thus limiting the involvement in DR programs to power utilities. Due to the advancement of technologies, it is now possible for the electricity end user to dynamically interact with the network operators and contribute to the necessary services such as load control or shedding for reducing peak loads. These technologies allow integration and control of the energy consuming appliances through a central automation control system [8, 9]. DR allows system operators to use technology to manage the grid overloading smartly. The DR load is classified two main categories. One type is the Incentive based Demand
Response (IDR) that is used to manage the peak demand
to support the system and other type is Emergency based Demand Response (EDR) which can use to support the system during severe under-frequency events [10]. DR policies for transmission grids can be designed based on demand side bidding, forecasting and dispatchable demand [7, 11, 12]. For example, commercial building services, household appliances or industries can reduce their load during the times of peak demand when they receive DR signal.
EDR has the capability to control the load directly with the real-time data and it can be triggered within 1-3 seconds [1]. EDR is targeted to large loads such as the industrial or commercial building, ripple control, water pumping system [1]. The system operators are required to make pre-agreement with customers to control these loads. If the system frequency goes below the EDR threshold then energy management system (EMS) sends a signal which direct dynamic control of the EDR load [13]. If the EDR load is not enough to meet the load-generation gap then, finally, an AUFLS scheme is triggered to reduce the gap and restore the frequency. The AUFLS triggering is expensive and includes system operator cost, the customer interruption cost and social cost (e.g. insurances). AUFLS is the automatic process of cutting off the electric load in a system if demand becomes greater than supplied and if the frequency declines to pre-set level. It is generally used as a last resort to protect the system frequency when the spinning reserve is failed to stop the frequency declined. AUFLS are employed in a security operation view-point and EDR is employed as an economical operation point of view.
In the future, consumers such as homes, business centres and industries will be equipped with smart meters, Intelligent Electronic Devices(IEDs) and will follow the communication protocol complying with standards such as International Electrotechnical Commission (IEC) 61850[14, 15]. Smart meters are capable of bidirectional communication between energy suppliers and domestic loads (or appliances) and can enable direct control of loads. This can provide real time price information for all
types of users and they can visualize direct incentive to reduce their power consumption more effectively and efficiently, such as dimming or turning off their lighting or heating at high-demand and high-price periods. For example, a building owner can start by retrofitting an older building with a wifi-enabled dimmable light that comes as a package with a building management system and iPhone application. The building owner can add more lights, remote controllable plugs, smart thermostat etc. over time to increase their control capability [16]. In this paper a new frequency band is introduced for EDR to employ frequency restoration procedure and dealing with different system contingencies. It is an alternative solution to deal with under frequency events without having to operate AUFLS scheme frequently. It is also flexible to deal with small to severe contingencies. The introduction of EDR can reduce the investment for system infrastructures. It is worth mentioning that the system operators need to improve the distribution Information and Communication Technologies (ICT) to implement the proposed method. DR aggregators can participate to reduce the peak demand and it can also bid for the spinning reserve to help reduce the grid and generation investment. If the participants switch off non-essential load in response to transmission or generation failure, it can help to increase the reliability of the overall services. The carbon footprint can also be limited without having to get online non-renewable generation. Consumers those participate in EDR can receive payment for participation. This paper is organized as follows: Section 2 discusses the strategy of spinning reserve and DR, Section 3 outlines the mathematical formulation, and the next section demonstrates the proposed scheme strategies. Section 5 discusses the test system while Section 6 evaluates the simulation and results. The final section concludes this chapter.
2. Strategy of Spinning Reserve and
Demand Response
[19]. The AGC usually take place within a couple of seconds to minutes. The Tertiary Control usually spans over several minutes to hours. If frequency declines due to the system contingencies, then the spinning reserve should trigger as soon as possible to balance the system. The above discussion concludes that the spinning reserve is available within a couple of seconds to minutes which is beyond the time frame for emergency control specially execution of AUFLS scheme. The spinning reserve which is increased generation within 6 seconds following an event that causes the frequency to fall is defined as FIR. The Fast Instantaneous Reserve (FIR) is sustained around 60 seconds [20]. The spinning reserve which is increased generation within 60 seconds following an event and which is sustained for 15 minutes is defined as the Sustained Instantaneous Reserve (SIR) [21]. The AUFLS scheme should trigger immediately if the frequency declined to the pre-set threshold and if the system detect imbalance active power.
On the other hand, DR is an involuntary reduction of loads during peak demand. DR load aggregators can bid the peak demand and can submit offers for a price and time in the way of generators. The DR could be one of the vital components of smart energy demand. IDR can treat as spinning reserve and it allows customers to participate an involuntary reduction of consumption and ‘ancillary’ services. EDR is employed to escape involuntary service interruptions during times of supply scarcity or sever contingency events [10]. The DR aggregators need to provide a guaranteed level of DR over the course of the EDR program. EDR blocks should be available as long as the call is within the block’s contractual availability period and operational limits [22].
3. Mathematical Formulation
3.1 Estimation of imbalance power
To determine the imbalance power the system inertia constant H should be known in advance. For a multiple machine system an equivalent inertia can be obtained as following [23]:
1
1
g
g
i i i eq
i i
S
S
(1)eq
=inertia constant of an equivalent generation unit
i
= inertia of the ith generation
i
S = apparent power ith generation unit
g
=number of generation units
If the balance of generation and loads is perturbed significantly, then the system frequency will change according to swing equation (2).
0
2 i i
mi ei i
Η df
Ρ Ρ ΔΡ
f dt (2)
mi
Ρ is the mechanical power ith generation
ej
Ρ is the electrical power ith generation
0
f is the rated frequency of the system (50 Hz)
i
is the unbalance power ith generation
The total load generation gap [9] can be obtained from the following expression:
1 1
0
2
g
Ν
i Ν
j c
i j
Η df ΔΡ ΔΡ
f dt
(3)
Where, is the total amount of imbalance power at
0 t s;
c
f is the centre of inertia frequency.
3.2 Calculation of Spinning Reserve and
Demand Response
SIR and FIR are a slow process to recover the frequency after severe disturbance. It is assumed that the spinning reserve and IDR are allocated to restore the decline frequency between 49.2 Hz to 50 Hz. The EDR frequency threshold is introduced in this paper and allocated the frequency band 48.8 Hz to 49.2 Hz. Once the system frequency drops to EDR frequency threshold ( fEDR49.2 Hz) EDR will be initiated. The imbalance power, where the frequency does not fall below EDR threshold value can be obtained by using the frequency response model explained in [24].
min,EDR DR Km /R
(4)
Where, min,EDR= approximate imbalance power that
makes the frequency from nominal to the minimum frequency before the EDR frequency threshold;
D= load-damping coefficient; R=governor speed regulation;
m
K =mechanical power gain factor.
The imbalance power where the frequency does not drop below the LS threshold frequency ( fLS 48.8 Hz) can be obtained the same way as (4) where only the frequency deviation will change.
min,LS new DR Km /R
(5)
So the approximate EDR can be calculated as
min, min,
EDR LS EDR
4. Proposed Scheme Strategy
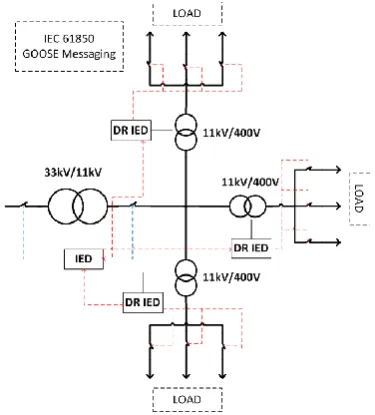
Proposed scheme architecture is shown in Figure 1. It uses DR aggregator IEDs at the distribution transformer and a substation IED (SUB IED) at the substation. The PMUs can collect data and the Programmable Logic Controller (PLC) can be used to control the loads at the distribution transformer. The authors believe that in near future all the protection and control relays will be replaced by emerging multifunctional IEDs that comply with standard based communication protocols. It will spread across sub transmission/substation to end user level [25]. The load can be controlled either at the substation level by controlling the feeder breaker or at the end user level (DR aggregator) by controlling the distribution transformer or re-closer IEDs [26]. All communications between the IEDs will use International IEC 61850 Generic Object Oriented Substation Event (GOOSE) messaging and it can be done within milliseconds [27]. The GOOSE messaging between these IEDs is used to exchange load flow values (watts), voltage, and frequency as well as to initiate commands for opening/ closing feeder breakers/nodes. The relays are able to exchange digital and analog data over the same Ethernet media by using IEC61850 messaging. The whole region from sub-transmission or substation to feeder IEDs to end user IEDs can be covered this way.
Figure 1. Proposed Architecture
The technique proposed in this paper is considered in two layers: the first layer is an economic layer that incorporates IDR and spinning reserves and deals with small contingencies or peak demand, and the second layer is an emergency layer that incorporates EDR with AUFLS that deals with serious contingencies of the system such as
overloading, under-frequency and under-voltage
constraints.
4.1 Economic Layer
This layer implements Energy Shedding (ES) technique and can be designed based on electricity price signal and controlling customer loads directly. The system operators could set the higher price for peak periods from the energy curve, or send incentive dynamic price signal to industrial and commercial consumers when the power
demands rise to peak demand through the Energy
Management System (EMS). The dynamic price signal is created by tariff-based incentives which increase the electricity price for a short period of time. Participant ES scheme consumers receive a discount or other incentives, based on their firm commitments. One needs to install a piece of intelligent equipment to control the loads of household, buildings or business premise appliances for enabling remote control. Domestic appliances such as refrigerators-freezers, lightning, cooking appliances, and washing appliances, entertainment appliances, electric heating and dryers are classified further into smaller groups. When it comes to reducing demand during peak load periods the Energy Price Signal (EPS) is sent directly to consumers through smart meters or IEDs. The participants, especially buildings or business premises will deliver their agreed response by reducing their lighting and heating corresponding to the EPS event. The EMS sends dynamic EPS to voluntary response without enabling technologies. This is targeting IDR customers such as smart appliances, freeze/freezer, lighting, heating, ventilation and air condition etc. The charge for energy is directly proportional to consumer consumption where power is the rate of change of energy. Mathematically, the energy can be found by integrating the power, i.e.
0 0
t t t
w w p dt (7)
Where,
( )t is the energy in joules (J) and p t( ) is the instantaneous power in watts (W). In the power system study, usually energy is expressed as a product of the unit Watt-hour or MW-hour [28].0
[ . ]
Tm
E watt x hour or MWh df
C t C f dt
(8)
Where, *
50 R m
MW CT
m
T
: is the inertia of machineR
MW : is the megawatt rating of the machine
f
: is the frequency deviation of the system
management system can be designed and manage the energy consumption during system peak demand. The total energy consumption by the customers’ load can be expressed as follows in equation (9):
1 2 1
...
n
i n
i
E E E E
(9)
The average energy consumption per customer can be obtained from the Energy Index Factor (EIF).
1
i
i i
E EIF
n E
(10)
The EIF is calculated for each installation control point for every half hour and financial incentives are provided based on EIF values and time of use. The payment of the participant of the ES program will be reconciled using meter information.
4.2 Emergency Layer
This layer incorporates EDR with AUFLS and deals with serious underfrequency situations. This layer is activated if the frequency goes down to EDR frequency threshold. Both EDR and AUFLS techniques will be occurring simultaneously. The following steps are considered to employ the proposed method.
Determination of Disturbance Magnitude: When an abrupt frequency drop is detected by PMU, the EMS of the control centre would calculate the magnitude of disturbance () by (3).
Triggering EDR from Control Centre: Once magnitude of disturbance () is obtained, then
it compares withfEDR, if fEDR, it
means that the imbalance power could drop the
frequency below fmin(49.2 Hz). Therefore, EDR
is initiated when fth 49.2Hz. The approximate
EDR can be evaluated using (6). When the frequency threshold drops down to 48.8 Hz AUFLS relay will be initiated immediately.
Determination of Imbalance Active Power for AUFLS: The imbalance power for AUFLS can be calculated by using (3), (4) and (6) as
min,
sh EDR EDR
(11)
The AUFLS scheme is designed based on system
contingencies and it can automatically
disconnect load based on the frequency
deviations setting, time delays, load
characteristic as well as the power system demand.
5. Test system
The proposed scheme is applied to a 15- bus radial distribution feeder in the Kumamoto area of Japan [29]. A power base of 10 MVA and a voltage base on 6.6 kV are chosen for all simulations. The test system consists of 14 load buses and a total load of the system is 5.9922 MW and 0.446 MVAR. A single line diagram of the test system is shown in Figure 2. The radial distribution system (RDS) is connected to the transmission network at Bus #1. A constant power load model is preferred to study the conventional load flow analysis, because it is independent of voltage magnitude. In the real network load is sensitive to frequency and voltage and the characteristics of the load model can describe as follows:
3
1 2
0 1 2 3 1 7
n n n L
Ρ Ρ a V a V a V a f
(12)
5 6
4
0 4 5 6 1 8
n n
n L
Q Q a V a V a V a f
(13)
Where, L and QLare active and reactive components of
the load when voltage magnitude is V ,0 and Q0 are the initial operating condition value when voltage magnitude is V0 and,a andnconstants in the model need not be an integer, and can either be negative or zero.
Figure 2. Single line diagram of 15 bus radial system
6. Simulation Results and Discussions
PSS/E commercial software is used to develop the proposed scheme. This simulation package has the capability of modelling various power system elements and conducting different systems analysis. The system generators, exciters and loads need to be modelled to obtain the dynamic simulation results. This paper ignores governor action. All the above models are available in the PTI PSS/E model library and are used in this paper [30].
6.1
Case
Study-Energy
Shedding
Application
performed 5% - 15% system overload condition. When the frequency is declined to below the threshold ( fth)
49.8 Hz and frequency decay is negative ( df dt/ 0) then the EMS controller displays the incentive EPS through smart meters and warn the customers (supposed 10% overload condition). It is considered that the DR action can be delayed due to the system operators’ time delay to decide and activate the DR program and the system communication delay. The frequency ranges are selected 49.8 Hz to 49.2 Hz for ES scheme. Frequency profiles plotted with 10%, 15% and 20% system overload conditions in Figure 3. The Figures 1a and 1b, 2a and 2b, and 3a and 3b are depicted the frequency profile with and without ES scheme at 10%, 15% and 20% overload conditions simultaneously. The simulations results presented the post recovery frequency with different time delays. The time delay is verified 0 s to 5 s. It can be seen that if the demand increases then the frequency starts to decrease. The frequency declines to 49.75 Hz, 49.3 Hz and 49.25 Hz for 10%, 15% and 20% system overload conditions respectively.
Figure 3. Frequency profile with and without ES at
10%, 15% and 20% overload conditions
Table I. Incentive benefits for participates customers
BUS EIF
3 23
4 45
5 46
7 55
The simulation results found that if the customers responded, then with the help of spinning reserves the frequency can restore to normal level without triggering any load. The customers at buses #3, #4, #5 and #7 are active participants into the ES scheme in this case. The Table I present EIF for each customer during the peak
load periods. The highest incentive is paid at bus 3 due to the lowest EIF and so on.
6.2 Case Study-Incorporating EDR into
AUFLS
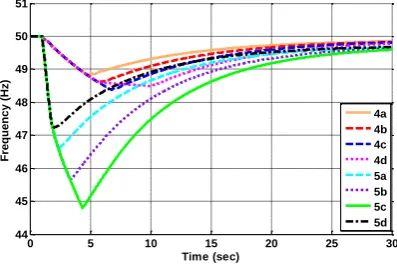
In this case, the validation of the proposed scheme is compared with a conventional AUFLS scheme. It is considered that 1MW load is available for DR programme and it is allocated for EDR. It can be triggered off within 1-3 seconds when the frequency is detected below the EDR frequency threshold. EDR is incorporated with conventional AUFLS to verify the simulation results. Frequency thresholds were chosen 48.7, 48.5 and 48.3 Hz respectively for an AUFLS scheme with time delay 0.3 s for each step and the similar amount of load was shed for each step. The generation loss is considered for verifying test results and observed the dynamic results. Since there is no governor action, so the scheme in this paper targets to restore the frequency above 49.5 Hz.
The EDR frequency response is presented in Figure 4(4a, 4b and 4c) with time delays 1s, 2s and 3s respectively after outage of 1 MW generation in the main supply. The frequency response after applying AUFLS scheme can be seen Figure 4d. It shows that EDR technique is sufficient to restore the frequency above 49.5 Hz without triggering AUFLS. Figure 4 also depicts the frequency response with the proposed integration scheme after outage of a generator at bus#1(2 MW). The frequency response is depicted in 5a, 5b and 5c after applying the proposed scheme and 5d representing the frequency response after applying AUFLS separately. The frequency response has shown both the proposed scheme and conventional AUFLS and found that both the scheme restores the frequency within the same time frame. The EDR is capable to handle the small to medium contingency without triggering AUFLS. During sever underfrequency events the integration scheme frequency falls below the minimum frequency threshold at 3 s. If EDR is triggered within 1-2 s, then the integration scheme is capable to restore the frequency without violating the lower frequency threshold.
Figure4. Frequency profile with EDR and LS
scheme outage at 1MW
0 2 4 6 8 10 12 14 16 18 20 49.2
49.3 49.4 49.5 49.6 49.7 49.8 49.9 50 50.1
Time (sec)
Frequen
cy (H
z)
1a 1b 2a 2b 3a 3b
0 5 10 15 20 25 30
44 45 46 47 48 49 50 51
Time (sec)
Frequen
cy (H
z)
8. Conclusion
DR is the most promising Smart Grid concept that can help to reduce the grid and generation investments, limit the carbon foot print and enable consumers to directly participate to system operation. In this paper authors propose alternative solutions to restore the frequency during underfrequency conditions. The scheme using IEC 61850 high-speed peer-to-peer GOOSE message allows the development of more flexible and efficient frequency restoration process.
A new concept of incorporation of EDR into AUFLS technique has been proposed in this paper. DR has financial incentive that is directly involved with customers’ participation and AUFLS is the technical issue that is directly involved with the system security during underfrequency conditions. The proposed scheme confirms the system security and manages the peak demand with minimal disruption for customers. The validation of the proposed scheme is confirmed by simulation results on typical network configuration.
Appendix A. List of symbols and
abbreviations
Abbreviations Full Form
AGC Automatic generation control AUFLS Automatic under frequency load
shedding
DR Demand response
DS Distribution system
EDR Emergency demand response EIF Energy index factor
EPS Energy price signal
EMS Energy management system
ES Energy shedding
FIR Fast instantaneous reserve
GOOSE Generic object oriented substation event
ICP Installation control point
ICT Information and communication technologies
IEC International electrotechnical commission
IED Intelligent electronics devise IDR Incentive demand response
LS Load shedding
MW Mega-watt
MVA Mega volt ampere MVAR Mega volt ampere reactive
NZ New Zealand
PLC Programmable logic controller PMU Phasor measurement unit
PSS/E Power system simulator for engineering
PTI Power technologies international SCADA Supervisory control and data
acquisition
SIR Sustained instantaneous reserve
SUB Substation
Symbols Quantity
a Constant
D Load damping coefficient
/
df dt
Rate of change of frequencyE
Energyi
E
Energy of ith busf
Frequency deviationc
f Centre of inertia frequency EDR
f EDR frequency threshold
0
f Rated system frequency
th
f
Frequency thresholdmin
f Minimum frequency
LS
f LS frequency threshold
H Inertia constant
Hz Hertz
m
Mechanical power gain factor
g Number of generation units
R
MW Megawatt rating of the machine
MWh Megawatt hour
n constants
L
Active component of load
0
Initial condition of active component of load
Imbalance load
EDR
Emergency demand response
ei
Electrical power ith generation mi
Mechanical power ith generation
i
Unbalance power ith generation
sh
LS imbalance power
t
p
Instantaneous powerL
Q Reactive component of load 0
Q Initial condition of reactive component of load R Governor speed regulation
s Second
i
S Apparent power ith generation unit m
T
Inertia of machineV Magnitude of voltage
0
V Initial condition of voltage
Frequency deviation
tw
Energy in joulesAcknowledgements
References
[1] LE-REN, C.-C., LUU NGOC, A., TA-WEI, L. & WEI-JEN, L. 2012. Incorporating Demand Response With Spinning Reserve to Realize an Adaptive Frequency Restoration Plan for System Contingencies. Smart Grid, IEEE Transactions on, 3, 1145-1153. [2] RUDEZ, U. & MIHALIC, R. 2011. Analysis of
Underfrequency Load Shedding Using a Frequency Gradient. Power Delivery, IEEE Transactions on, 26,
565-575.
[3] TERZIJA, V. V. 2006. Adaptive underfrequency load shedding based on the magnitude of the disturbance estimation. Power Systems, IEEE Transactions on, 21,
1260-1266.
[4] TANG, J., LIU, J., PONCI, F. & MONTI, A. 2013. Adaptive load shedding based on combined frequency and voltage stability assessment using synchrophasor measurements. Power Systems, IEEE Transactions on, 28, 2035-2047.
[5] TERZIJA, V., VALVERDE, G., DEYU, C.,
REGULSKI, P., MADANI, V., FITCH, J., SKOK, S., BEGOVIC, M. M. & PHADKE, A. 2011. Wide-Area Monitoring, Protection, and Control of Future Electric Power Networks. Proceedings of the IEEE, 99, 80-93. [6] GHOSH, S., SUN, X. A. & XIAOXUAN, Z.
Consumer profiling for demand response programs in smart grids. Innovative Smart Grid Technologies - Asia (ISGT Asia), 2012 IEEE, 21-24 May 2012 2012. 1-6.
[7] HAMILTON, K. & GULHAR, N. 2010. Taking Demand Response to the Next Level. Power and Energy Magazine, IEEE, 8, 60-65.
[8] DAE-MAN, H. & JAE-HYUN, L. 2010. Smart home energy management system using IEEE 802.15.4 and zigbee. Consumer Electronics, IEEE Transactions on, 56, 1403-1410.
[9] SANUDIN, R., MUN, Y. T., ZAKI, W. S. W. & WAHAB, M. H. A. Wireless appliance control system. Innovative Technologies in Intelligent Systems and Industrial Applications, 2009. CITISIA 2009, 25-26 July 2009 2009. 476-479.
[10]LOUGHRAN, D. S. A. J. K. 2004. Demand-Side Management and Energy Efficiency in the United States. The Energy Journal, 25.
[11]NAIR, N. C., NAYAGAM, R. & FRANCIS, R. New Zealand utility experiences with demand side management. Power and Energy Society General Meeting - Conversion and Delivery of Electrical Energy in the 21st Century, 2008 IEEE, 20-24 July 2008 2008. 1-5.
[12]TYAGI, R. & BLACK, J. W. Emergency demand response for distribution system contingencies. Transmission and Distribution Conference and Exposition, 2010 IEEE PES, 19-22 April 2010 2010. 1-4.
[13]COMMISSION, C. E. 2005a. Energy Efficient Load-Shedding Lighting Technology.
[14]GROUP, S. G. W. 2003-2006. Challenge and Opportunity: Charting a New Energy Future,. Washington, DC 20036 Energy Future Coalition. [15]MILHAU, D., MOLLAH, K. & NAIR, N. K. C.
Laboratory test bench demonstrating smart load shedding schemes. Power System Technology
(POWERCON), 2012 IEEE International Conference on, Oct. 30 2012-Nov. 2 2012 2012. 1-6.
[16]QUINTIN, T. 2013. Establishing Demand Response in New Zealand. EEA. Auckland, New Zealand.
[17]JOVAN ILIC, D. W., MARIJA PRICA, SHAWN RABIEI, JESSE GOELLNER 2011. Frequency Instability Problems in North American Interconnections. National Energy Technology Laboratory.
[18]CHUVYCHIN, V. N., GUROV, N. S., VENKATA, S. S. & BROWN, R. E. 1996. An adaptive approach to load shedding and spinning reserve control during underfrequency conditions. Power Systems, IEEE Transactions on, 11, 1805-1810.
[19]P. M. ANDERSON, A. A. A. F. 2003. Power System Control and Stability, Piscataway, NJ, John Wiley and Sons.
[20]KUNDUR, P. 1994. Power System Stability and Control, New York, McGraw-Hill.
[21]2013. Under Frequency Management - UFM Initiatives & changes to procurement plan. Electricity Authority.
[22]LIMITED, T. N. Z. 2013. Demand Side Initiatives Programme
[23]MOLLAH, K. 2010. Under Voltage and Under Frequency Load Shedding Schemes. ME, The University of Auckland.
[24]REDDY, C. P., CHAKRABARTI, S. &
SRIVASTAVA, S. C. 2014. A Sensitivity-Based Method for Under-Frequency Load-Shedding. Power Systems, IEEE Transactions on, 29, 984-985.
[25]JIANG, X., CHEN-WEI, Y., ZHABELOVA, G.,
BERBER, S. & VYATKIN, V. Towards
implementation of IEC 61850 GOOSE messaging in IEC 61499 environment. Industrial Informatics (INDIN), 2013 11th IEEE International Conference on, 29-31 July 2013 2013. 464-470.
[26]SEVOV, L., ZHAO, T. W. & VOLOH, I. 2013. The Power of IEC 61850: Bus-Transfer and Load-Shedding Applications. Industry Applications Magazine, IEEE, 19, 60-67.
[27]HIGGINS, N., VYATKIN, V., NAIR, N. C. & SCHWARZ, K. 2011. Distributed Power System Automation With IEC 61850, IEC 61499, and Intelligent Control. Systems, Man, and Cybernetics, Part C: Applications and Reviews, IEEE Transactions on, 41, 81-92.
[28]PELLETIER, M. A., PHETHEAN, M. E. & NUTT, S. Grid code requirements for artificial inertia control systems in the New Zealand power system. Power and Energy Society General Meeting, 2012 IEEE, 22-26 July 2012 2012. 1-7.
[29]APONTE, E. E. & NELSON, J. K. 2006. Time optimal load shedding for distributed power systems. Power Systems, IEEE Transactions on, 21, 269-277. [30]GROUP, S. P. T. A. D. 2012. Siemens Power