WWJMRD 2017; 3(5): 1-6 www.wwjmrd.com Impact Factor MJIF: 4.25 e-ISSN: 2454-6615
Thamotharan J
Assistant Professor, Department of Mechanical Engineering, Shreenivasa Engineering College, Tamil Nadu, India
Jagatheswaran K
P.G students in Mechanical Engineering, Shreenivasa Engineering College, B.Pallipatti, Tamil Nadu, India
Vadivel M
U.G students in Mechanical Engineering, Shreenivasa Engineering College, B.Pallipatti, Tamil Nadu, India
P.Udayakumar
U.G students in Mechanical Engineering, Shreenivasa Engineering College, B.Pallipatti, Tamil Nadu, India
S.Sathishkumar
U.G students in Mechanical Engineering, Shreenivasa Engineering College, B.Pallipatti, Tamil Nadu, India
Multi-response optimization of quality characteristics
of co2 moulding sand using taguchi method
Thamotharan J, Jagatheswaran K, Vadivel M, P.Udayakumar,
S.Sathishkumar
Abstract
Mould properties and its control is a section in foundry industry that has to be dealt with prior importance during the making of moulds. The property of the mould sand and mould plays a key role in determining the quality of the casting. There are several important properties associated with these such as moisture content, permeability, compatibility, combustibility, mould hardness, tensile strength, shear strength, transverse strength, compression strength etc. This work is aimed at optimizing the
CO2 sand mould properties using Taguchi method with the help of MINITAB software. A
multi-response optimization method is intended to be followed. For that three input parameters and three output parameter are taken for CO2 sand. All the three output parameters will be optimized
individually. The input process parameters selected for CO2 sand are AFS (Average Fineness of
Sand) number, percentage of yellow dextrin content and percentage of sodium silicate content at three levels, and the output parameters selected are permeability, dry compression strength (DCS) and dry shear strength (DSS). An L9 orthogonal array will be used for carrying out experiments for optimizing each of the output parameter.
Keywords: CO2 moulding, Permeability, Dry compression strength, Dry shear strength, Optimization,
Taguchi method, MINITAB
Introduction
Mould properties such as permeability, DCS (dry compression strength), DSS (dry shear strength) have to be dealt with utmost importance in order to obtain a good quality mould. If these properties are found below the required values, then it will in turn give a low quality mould resulting in poor casting quality. The process parameters selected were AFS number, Yellow dextrin content and Sodium silicate content. Yellow dextrin is used to improve the binding strength between sand particles in a mould. Sodium silicate mixed in dry sand reacts with CO2 passed through the mould. CO2 reacts with sodium silicate and forms silica gel and in turn it hardens and imparts strength to the mould.
Permeability number should be above 200, DCS above 180 Psi and DSS above 38 Psi. After making mould pouring might be done at different times. So the mould strength should remain in limits until the pouring of metal occurs. Also mould should withstand while pouring and solidification too. So in order to find out the optimum parameters determining the properties which is applicable for the mould till pouring this experiment is carried out. Cylindrical specimens of dimension 2”x2” will be made. Sand mixed with yellow dextrin and sodium silicate according to the specification in Taguchi method at three levels will be tested. Specimens will be made. Of which specimens will be tested soon after the specimen is made, then specimens after 1 hour from which specimen is made, and then specimen after 24 hours respectively. This is done to find out if any properties are coming out of required values as time passes on. Also to find out how the mould properties will change when molten metal is poured, the specimen is kept in a muffle furnace for 1 hour at 9000C.
compression strength, permeability, hardness and bulk density will lead to some casting defects [2] such as blow holes, pinhole porosity, poor surface finish, dimensional variation, scabs and rat tails etc. The properties are influenced by a large number of controllable parameters such as grain fineness number, % clay, % water and number of strokes. Therefore, to improve the mould properties by identifying the levels of input parameters is carried out in this journal. In this journal non-linear regression equations developed between the control factors, i.e. process parameters, and responses have been considered for optimizing using PSO. In this journal an attempt has been made to search for the optimal process parameter values for the multiple objectives, namely green compression strength, permeability, hardness and bulk density using PSO. Five different cases were considered by varying weighting factor of each objective. In this the percent deviations of the objective function values between the values obtained through PSO and experiments are found to be in the acceptable range.
A.Noorul Haq et al [3] demonstrates optimization of casting process parameters by using Taguchi’s design of experiments method. The process parameters considered were weight of gas, mould hardness number, sand particle size, percentage of sodium silicate, sand mixing time, pouring time, pouring height, pouring temperature, and cooling time of poured metal. Casting defects [4] that may occur are swell, blow holes, pin hole, cold shut, shrinks, hot tears, honey combing etc. Here an L27 orthogonal array was taken with 3 level. Signal to noise ratio was calculated as three runs were conducted. ANOVA for casting defects and S/N ratio was also computed. Then the optimum casting process parameters were calculated. Confirmation experiments were also carried out finally. It was found that percentage rejection rate of casting process has decreased when the process parameters were set to an optimal level from that before setting the optimal parameters. 95% confidence level was taken.
A. kumaravadivel et al [5] prime focus was kept on minimizing the defects developed in the sand-casting process by Process Window Approach (PWA). Analysis of various critical process parameters and the interaction among them is carried out with the help of Taguchi method of experimental design. To optimize [7] the results obtained and to make the analysis more precise and cost effective, response surface methodology (RSM) is also incorporated. The optimized parameters obtained using the Taguchi method and RSM are then tested in an industrial case study. The process parameters [9] considered in this journal were moisture content, permeability, loss on ignition, compressive strength, volatile content, vent holes, pouring time, pouring temperature and mould pressure with three levels for each of the above parameters. An L27 orthogonal array [11, 12] was formed and experiments were carried out according to this. Three trial runs were taken and S/N ratios were calculated. The process parameters were optimized. M.Ravichandran et al. and others [6,8,10,13,15] adopted the well-established Taguchi technique for optimizing the several machining process which involves large number of complicated factors to be considered and they successfully optimized the parameters. So Taguchi method [14,16] can be utilized for optimizing the sand moulds which is also having some complex factors.
Experimental Setup
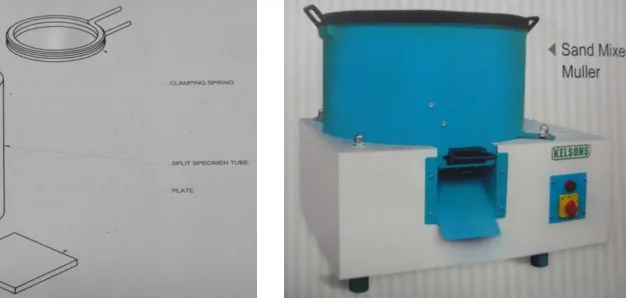
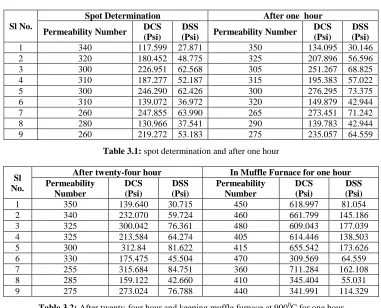
Mixing of sand will be done with the help of a sand muller. After which the specimens will be made with the help of a split specimen tube. With the help of a sand rammer, the sand will be rammed by three strokes. Then CO2 gas will be passed through specimen for reaction with sodium silicate to occur. After which the specimens will be tested using a permeability meter for finding permeability number, and with a universal strength machine to find out DCS and DSS in kg/cm2 which is converted to Psi by multiplying with 14.22. The values are tabulated and are optimized with the help of MINITAB software.
Fig 3.3: Sand rammer Fig 3.4: Universal strength testing machine
The process parameters selected are shown in table 3.1
PARAMETER LEVEL
1 2 3
AFS Number 39 41 44
Sodium Silicate (%) 3.5 4.5 5.5
Yellow Dextrine (%) 0 0.5 1.0
Table 3.1: Process parameters
An L9 orthogonal array was selected for carrying out Taguchi method as there were 3 parameters each at 3 levels as shown in above table. Selected L9 orthogonal array is shown below.
Expt. No
AFS number
Yellow Dextrine content (%)
Sodium silicate content (%)
1 1 1 1
2 1 2 2
3 1 3 3
4 2 1 2
5 2 2 3
6 2 3 1
7 3 1 3
8 3 2 1
9 3 3 2
Table 3.2: L9 Orthogonal array
Experiments were carried out in three trials and the average value was taken to minimize errors.
Experimental Results
The obtained results are shown in the following tables.
Sl No.
Spot Determination After one hour
Permeability Number DCS
(Psi)
DSS
(Psi) Permeability Number
DCS (Psi)
DSS (Psi)
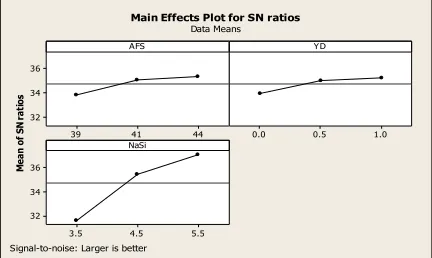
1 340 117.599 27.871 350 134.095 30.146
2 320 180.452 48.775 325 207.896 56.596
3 300 226.951 62.568 305 251.267 68.825
4 310 187.277 52.187 315 195.383 57.022
5 300 246.290 62.426 300 276.295 73.375
6 310 139.072 36.972 320 149.879 42.944
7 260 247.855 63.990 265 273.451 71.242
8 280 130.966 37.541 290 139.783 42.944
9 260 219.272 53.183 275 235.057 64.559
Table 3.1: spot determination and after one hour
Sl No.
After twenty-four hour In Muffle Furnace for one hour
Permeability Number
DCS (Psi)
DSS (Psi)
Permeability Number
DCS (Psi)
DSS (Psi)
1 350 139.640 30.715 450 618.997 81.054
2 340 232.070 59.724 460 661.799 145.186
3 325 300.042 76.361 480 609.043 177.039
4 325 213.584 64.274 405 614.446 138.503
By using the MINITAB software, the results were analyzed and S/N ratio was found and graph was plotted. The graphs
are as shown below.
44 41 39 48.0 46.5 45.0 43.5 42.0 1.0 0.5 0.0 5.5 4.5 3.5 48.0 46.5 45.0 43.5 42.0 AFS M ea n of S N ra ti os YD NaSi
Main Effects Plot for SN ratios
Data Means
Signal-to-noise: Larger is better
Fig 3.1: S/N ratio graph of permeability and DCS of spot determination
44 41 39 36.0 34.5 33.0 31.5 30.0 1.0 0.5 0.0 5.5 4.5 3.5 36.0 34.5 33.0 31.5 30.0 AFS M ea n of S N ra tio s YD NaSi
Main Effects Plot for SN ratios
Data Means
Signal-to-noise: Larger is better
Fig 3.2: S/N ratio graph of DSS of spot determination
44 41 39 50.4 50.0 49.6 49.2 48.8 1.0 0.5 0.0 5.5 4.5 3.5 50.4 50.0 49.6 49.2 48.8 AFS M e a n o f S N r a ti o s YD NaSi
Main Effects Plot for SN ratios
Data Means
Signal-to-noise: Larger is better
44 41 39 48 46 44 1.0 0.5 0.0 5.5 4.5 3.5 48 46 44 AFS M e a n o f S N r a ti o s YD NaSi
Main Effects Plot for SN ratios
Data Means
Signal-to-noise: Larger is better
Fig 3.3: S/N ratio graph of permeability and DCS of After 1-hour experiment
44 41 39 36 34 32 1.0 0.5 0.0 5.5 4.5 3.5 36 34 32 AFS M ea n of S N ra ti os YD NaSi
Main Effects Plot for SN ratios
Data Means
Signal-to-noise: Larger is better
44 41 39 50.5 50.0 49.5 49.0 48.5 1.0 0.5 0.0 5.5 4.5 3.5 50.5 50.0 49.5 49.0 48.5 AFS M ea n of S N ra ti os YD NaSi
Main Effects Plot for SN ratios
Data Means
Signal-to-noise: Larger is better
44 41 39 50 48 46 44 1.0 0.5 0.0 5.5 4.5 3.5 50 48 46 44 AFS M ea n of S N ra ti os YD NaSi
Main Effects Plot for SN ratios
Data Means
Signal-to-noise: Larger is better
Fig 3.5: S/N ratio graph of permeability and DCS of After 24-hour experiment
44 41 39 38 36 34 32 1.0 0.5 0.0 5.5 4.5 3.5 38 36 34 32 AFS M ea n of S N ra tio s YD NaSi
Main Effects Plot for SN ratios
Data Means
Signal-to-noise: Larger is better
Fig 3.6: S/N ratio graph of DSS of After 24-hour experiment
44 41 39 53.2 52.8 52.4 52.0 1.0 0.5 0.0 5.5 4.5 3.5 53.2 52.8 52.4 52.0 AFS M e a n o f S N r a ti o s YD NaSi
Main Effects Plot for SN ratios
Data Means
Signal-to-noise: Larger is better
44 41 39 -52 -53 -54 -55 -56 1.0 0.5 0.0 5.5 4.5 3.5 -52 -53 -54 -55 -56 AFS M e a n o f S N r a ti o s YD NaSi
Main Effects Plot for SN ratios
Data Means
Signal-to-noise: Smaller is better
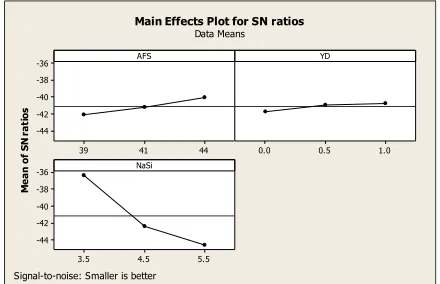
Fig 3.7: S/N ratio graph of permeability and DCS of in muffle at 9000C for 1 hour
44 41 39 -36 -38 -40 -42 -44 1.0 0.5 0.0 5.5 4.5 3.5 -36 -38 -40 -42 -44 AFS M e a n o f S N r a ti o s YD NaSi
Main Effects Plot for SN ratios
Data Means
Signal-to-noise: Smaller is better
Fig 4.11: S/N ratio graph of DSS of in muffle at 9000C for 1 hour
Conclusion
It is clear from the above graphs of S/N at 95% level of
References
1. L. Sasi Rekha Lathan, B. Surekha, Pandu R Vundavilli “Multi-Objective Optimization of Green Sand Mould System Parameters using Part Swarm Optimization”, Advanced Materials Manufacturing & Characterization Vol 3 Issue 1 (2013).
2. B. Surekha, Lalith K. Kaushik, Abishek K. Panduy, Pandu R. Vundavilli, Mahesh B. Parappagoudar “Multi-Objective Optimization of Green Sand Mould System using evolutionary algorithms”, International Journal of Advanced Manufacturing Technology, 2012, 58, 9-17.
3. A. Noorul Haq, S. Guharaja, K. M. Karuppannan, “Parameter Optimization of casting process by using Taguchi Method”, International Journal of Interactive Design Manufacturing, 2009, 3, 41-50. 4. Charnnarong Saikaew, Sermsak Weingwiset,
“Optimization of Moulding Sand Composition for Quality Improvement of Iron Castings”, Applied Clay Science, 67-81, 2012, 26-31.
5. A. Kumaravadivel & U. Natarajan, “Optimization of Sand-Casting Process Variables – A Process Window Approach”, The International Journal of Advanced Manufacturing Technology (2012)
6. M.Ravichandran, M.Meignanamoorthy and S.Sakthivelu, “Optimization of material removal rate in CNC drilling of AA6063 using Taguchi method”, International Journal of Research in Advanced Technology, Volume-1, Issue-9, November- 2016, 1-3. 7. A. Kumaravadivel & U. Natarajan, “Application of Six-Sigma DMAIC methodology to Sand-Casting Process with Response Surface Methodology”, The International Journal of Advanced Manufacturing Technology (2013).
8. Sivakumar M, Sivakumar K, R.Shanmuga Prakash, and S.Vignesh, “Parameters Optimisation of Wire Electrical Discharge Machining on AISI D3 Steel with Different Thickness”, International Journal of Applied Engineering Research, 10(62), 2015, 185–191.
9. Krishankant, Jatin Taneja, Mohit Bector, Rajesh Kumar, “Application of Taguchi Method for Optimizing Turning Process by the effects of Machining Parameters”, International Journal of Engineering and Advanced Technology, ISSN: 2249-8958, Volume-2, Issue-1, October 2012.
10. S.Vignesh, M.Sivakumar, R.Shanmuga Prakash, “Parameter Optimization of Wire EDM in a Range of Thickness for EN8 Die Steel”, International Journal for Trends in Engineering and Technology, Vol.5 (2), 123-130, 2015.
11. Ching-Ping Fung, Po-Chung Kang, “Multi-Response Optimization in Friction Properties of PBT composites using Taguchi method and principle component analysis”, Journal of Materials Processing Technology 170 (2005) 602-610.
12. J. Antony, “Simultaneous Optimization of Multiple Quality Characteristics in Manufacturing Processes using Taguchi’s Quality Loss Function”, The International Journal of Manufacturing Technology (2001) 17: 134-138
13. S. Sakthivelu, T. Anandaraj, M. Selwin, Multi-Objective Optimization of Machining Conditions on Surface Roughness and MRR during CNC End Milling of Aluminium Alloy 7075 Using Taguchi Design of
Experiments, Mechanics and Mechanical Engineering, Volume-21, Issue-1 (2017) 95–103.
14. Jiju Antony and Nick Capon, “Teaching Experimental Design Techniques to Industrial Engineers”, Int. J. Engng Ed. Vol.14, No. 5 pp. 335-343, 1998.
15. S. Kamaruddin, Zahid A. Khan, K. S. Wan, “The Use of the Taguchi Method in Determining the Optimum Plastic Injection Moulding Parameters for the Production of a Consumer Product”, Journal Mechanical (2004) 98-110