Keywords
Highlights
Abstract
Graphical abstract
158
Research Paper
Received 2017-08-18 Revised 2017-10-25 Accepted 2017-12-19 Available online 2017-12-19
Mixed matrix membrane Finite difference numerical solution Pervaporation model
Effective permeability
• FD method was used for species permeation mass transport through MMM
• Fick’s second law of diffusion was solved to obtain the concentration profile
• Effective permeability of MMMs was calculated using the permeation flux
• Effective permeability depends on the Pd /Pc and the volume fraction of particle • Effective permeability depends on the type and parameters of the isotherm
On the Effective Permeability of Mixed Matrix Membranes
Department of Chemical and Biological Engineering, University of Ottawa, Ottawa, Ontario, Canada K1N 6N5
Hoda Azimi, F. Handan Tezel, Jules Thibault
*Article info
© 2018 MPRL. All rights reserved.
* Corresponding author at: Phone: (+613) 562-5800 x6094; fax: (+613) 562-7172 E-mail address: Jules.Thibault@uottawa.ca (J. Thibault)
DOI: 10.22079/JMSR.2017.70256.1155 1. Introduction
Pervaporation process is a membrane-based separation technique which is widely used for the separation of alcohols from dilute aqueous solutions due to its advantages such as good separation performance and low energy consumption [1–5]. Membrane materials are commonly divided into two categories: polymeric membranes and inorganic membranes. Polymeric membranes are well-known due to their wide range of properties, ease of fabrication, high mechanical stability and low cost [6]. However, separation processes using polymeric membranes are restricted by the trade-off between membrane permeability (or permeate flux) and selectivity [7]. On the other hand, inorganic membranes have higher selectivity and permeability than the polymeric membranes, but they are more expensive and fragile. In order to overcome these barriers, it has been suggested to embed porous inorganic filler materials such as zeolites [8], metal organic frameworks (MOFs) [9], silicalites [10], carbon molecular sieves (CMS) [11,12],
activated carbons (AC) [13] and carbon nanotubes (CNTs) [14] into the host polymer matrix to manufacture mixed matrix membranes (MMMs) or hybrid composite membranes. It has been reported that the presence of filler materials embedded within the polymer matrix could enhance the effective permeability of the membranes [8,10,15,16]. In addition, the presence of fillers might also improve the mechanical and thermal stability of membranes
[13,17]. However, there are still important challenges (e.g. selecting the most appropriate pair of polymer-filler materials) which have to be overcome before applying these types of membranes at an industrial scale.
Modelling of mass transport is paramount to obtaining a better understanding about the influence of permeable and barrier fillers within the membrane, on the permeation of species through mixed matrix membranes. Different analytical and numerical solutions have been introduced to estimate the effective permeability of ideal mixed matrix membranes as a function of
Journal of Membrane Science & Research
journal homepage: www.msrjournal.com
Mixed matrix membranes (MMMs) are attracting significant interest for pervaporation and gas separation applications. To better comprehend the impact of filler particles within a polymer matrix, the species permeation mass transport was theoretically studied by numerical simulation using finite differences. The Fick’s second law of diffusion was solved for a three-dimensional MMM to obtain the concentration profile within the membrane and consequently the steady-state permeation flux of the species. The effective permeability of MMMs was then calculated using the steady-state permeation flux of the permeants. The effects of various structural parameters such as the filler volume fraction, particle size, shape and orientation, the ratio of permeability coefficients in the dispersed and continuous phases (Pd/Pc), membrane thickness and particle sorption isotherms were investigated.
Results revealed that the effective permeability of MMMs strongly depends on the permeability ratio of the dispersed phase to the continuous phase and the volume fraction of the filler material. Moreover, the shape and size of the particles had no influence on the effective permeability of MMMs for filler volume fractions that are less than 0.4. For numerical simulations performed with different particle sorption isotherms, results showed that the effective permeability of the membrane depends on the type and parameters of the isotherm as well as the feed concentration.
different parameters such as membrane thickness, filler size, volumetric filler loading and permeability of the components in the continuous and dispersed phases [7,18,19]. Recently, Ebneyamini et al. [20] proposed a semi-empirical resistance-based model to estimate the effective permeability of ideal MMMs. This model was developed by introducing a correction factor to a simple one-directional resistance-based (RB) analytical solution to account for the three-directional diffusional pathway. The correction factor was based on the ratio of the estimated effective permeability determined by a finite difference (FD) numerical solution and the simple RB model. The model was obtained under the assumptions of homogenous dispersion of cubical filler materials throughout the polymeric matrix and an ideal morphology at the polymer-filler interface. In addition, it was assumed that the solubility of the permeants in both the continuous and dispersed phases followed a linear sorption isotherm (Henry’s law) which implied a fixed permeability of the penetrants in the two different phases within the membrane [20–23].
A three-directional (3D) numerical solution of the Fickian diffusion equations was used in this study to investigate the influence of the different parameters such as the filler content, the permeability ratio between the dispersed and the continuous phase (Pd/Pc), the filler shape (cubical, spherical,
cylindrical), the size and orientation of the filler, the linear and non-linear sorption isotherms of species in the filler material and the membrane thickness on the effective permeability of ideal mixed matrix membranes with a homogenous and random dispersion of filler materials. To the best of our knowledge, this work is one of the first few investigations to simulate comprehensively the effect of filler properties on the relative permeability of mixed matrix membranes.
2. Development of finite-difference numerical solution
Finite difference numerical solution has been used to study the mass transfer of species through mixed matrix membranes. It was assumed that polymer-particle interface morphology was ideal. Moreover, it was assumed that the particle geometrical and intrinsic specifications of filler particles are identical throughout the membrane matrix. The overall membrane can be represented by a number of repeatable unit elements where each element contains a distribution of random or uniformly dispersed particles that is statistically identical to the distribution of particles of any other element of the membrane. For illustration purposes, a uniform distribution of cubical particles within the membrane is considered. Each element consists of a centrally-located cubical particle surrounded by the polymer matrix (Fig. 1). All membrane elements and their permeability are identical. The permeability of each unit is also identical to the entire membrane. Figure 1(a) represents a specific case of cubical elements (Figure 1(b)) of dimension 2 2 2 𝜇m3
homogenously distributed within a 10 1010 𝜇m3 ideal mixed matrix
membrane. The filler size and the solid volume fraction in Figure 1 are 1 𝜇m3
and 0.125, respectively.
To determine the steady and the unsteady state concentration profiles of the penetrants through the mixed matrix membrane, the three-dimensional Fick’s second law of diffusion (Eq. (1)) was solved by finite differences in Cartesian coordinates.
+
+
=
z
C
D
z
y
C
D
y
x
C
D
x
t
C
z y x z y x z yx,, ,, ,, (1)
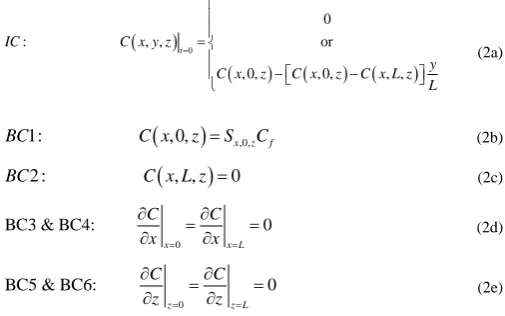
In this investigation, it was assumed that the concentration of the feed solution, in contact with the retentate side of the membrane, remains constant and a perfect vacuum prevails on the permeate side. The unsteady state equation was solved to determine the time required to achieve steady state. However, for the majority of the results presented in this investigation such as to determine the effective permeability of mixed matrix membranes, the steady-state solution was required. It would therefore be possible to solve Eq. (1) with the time derivative term equal to zero. The finite differences code developed for this investigation had both the steady and the unsteady state options. However, it turned out that solving the very large sparse matrix for the steady state case took significantly more computation time than solving the unsteady state equation, while assuming a linear profile as the initial conditions. It is important to note that the final steady-state concentration profile and permeate flux are independent of initial conditions. For this reason, the unsteady state equation was used throughout this investigation. In addition, in the case where the solubility of permeants in the continuous and dispersed phases are nonlinear, solving for the unsteady state equation is required. The initial and boundary conditions considered in this investigation are given in Eq. (2).
(
)
(
)
(
)
(
)
0
0
: , , or
, 0, , 0, , ,
= = − − t
IC C x y z
y
C x z C x z C x L z
L
(2a)
(
)
,0,1:
, 0,
=
x z fBC
C x
z
S
C
(2b)(
)
2 :
, ,
=
0
BC
C x L z
(2c)0
BC3 & BC4:
0
= =
=
=
x
x LC
C
x
x
(2d)0
BC5 & BC6:
0
= =
=
=
z
z LC
C
z
z
(2e)For BC1, at the feed solution membrane interface, the surface concentration within the membrane is in equilibrium with the feed solution which was assumed constant over the entire membrane surface. For BC2, the concentration is equal to zero as perfect vacuum is assumed. For BC3-BC6, symmetry conditions (or periodic conditions) are assumed where the portion of the membrane that is solved using Eq. (1) is representative of all the other equal-size volumes forming the membrane. It will be shown in the results that the permeability of a representative element has the same permeability of the entire membrane.
Eq. (1) was discretized using a sufficiently large number of mesh points and solved by finite differences. Eq. (3) determines the concentration of a permeant m at a mesh point (i, j, k) at time t + t as a function of the current concentration at mesh point (i, j, k) and the concentrations at the six neighbouring mesh points at time t. Eq. (1) prevails for all interior mesh points. This equation was solved iteratively to obtain the steady-state concentration profile and permeate flux of components.
Fig. 1. Schematic diagram of (a) 101010 𝜇m3
, , , ,
, , , ,
, , 1, , 1, , , ,
1, , 1, ,
, , 2 , , 2
, ,
, ,
, , , 1, , 1,
, ,
, , , , , , 2 , ,
− + − + − − +
−
−
−
+
−
=
+ −
+
x x y yi j k i j k
m t m t m t m t
i j k i j k i j k i j k
i j k i j k
L R
i j k i j k
i j k
m t m t
i j k i j k i j k
L R
m t t m t
i j k i j k i j k i j k
S
S
C
C
C
C
S
S
D
D
x
x
S
S
C
C
S
C
C
t
D
D
y
, , , , , 1, , , , 1,
2
, , , ,
, , , ,
, , , , 1 , , 1 , , , , 1 , , 1
, , 2 , , 2
+ + − + − +
−
−
−
−
+
z zi j k m t m t i j k i j k i j k
i j k i j k
m t m t m t m t
i j k i j k i j k i j k
i j k i j k
L R
i j k i j k
C
C
S
y
S
S
C
C
C
C
S
S
D
D
z
z
(3)
The concentrations of all six neighboring mesh points in Eq. (3) were converted to their equilibrium concentrations relative to the phase of the central mesh point (i, j, k)using the ratio of the solubility coefficients in the two respective phases. For boundary mesh points, Eq. (3) was adapted to take into account boundary conditions of Eq. 2(b)-2(e).
An effective diffusion coefficient between neighbouring mesh points was considered due to the different properties of the surrounding mesh points such as the diffusivity and solubility coefficients. A mass balance was performed to calculate the effective diffusivity coefficient of each mesh point within the matrix of the membrane. Eq. (4) was used to estimate the effective diffusivities in the x-direction between mesh point (i, j, k) and its left neighbour (i-1, j, k), and between mesh point (i, j, k) and its right neighbour (i+1, j, k), respectively. Similar equations have been used for the effective diffusion coefficients in y and z directions.
, ,
, , 1, , 1, , , ,
1
1
2
1
2
− −=
+
Xi j k L
i j k i j k i j k i j k
S
D
S
D
D
(4a), ,
1, , 1, , , , , ,
1
1
1
2
2
+ +
=
+
X
i j k
i j k
R
i j k i j k i j k
S
S
D
D
D
(4b)The Fick’s first law of diffusion (Eq. (5)) was used to estimate the average steady-state permeation flux of a permeant at the permeate side of the membrane based on all surface mesh points of the x-z plane. A similar equation was used for estimating the permeation flux at the feed side of the membrane.
(i N, y,k) x y z, ,
y L
C
J
D
y
=
= −
(5a)(
)
(
)
(
)
, ,1 1
1
1
=
= =
=
−
−
x zy
N N
i N k y L
i k x y
J
J
N
N
(5b)where J is the permeation flux calculated for a x-z plane. Nx, Ny and Nz are the number of mesh points used to discretize Eq. (1) in the x, y and z directions, respectively. Given the estimation of the permeation flux, the concentration driving force and the thickness, the effective steady-state permeability of a permeant in MMMs can be calculated (Eq. (6)).
eff
JL
P
C
=
(6)To investigate the effect of embedded filler material on the effective permeability of the mixed matrix membrane, the finite difference algorithm was coded in FORTRAN and solved for different case studies. Moreover, in the case when the filler is an adsorbent for a given permeant, the impact of different adsorption isotherms of the filler material on the effective permeability of the MMMs was also studied. Both linear (Henry’s law) and nonlinear (Langmuir) equilibrium adsorption models were investigated. Table 1 presents the values of the solubility and diffusion coefficients which were used in this study for the continuous and dispersed phases for various numerical simulations when sorption follows a linear isotherm (Henry’s law).
3. Results and discussion
3.1. Comparison between analytical and numerical solutions for neat polymeric membranes
Since numerical solutions are used extensively in this investigation, it is important to validate the precision of the finite difference scheme with a benchmark analytical solution. An analytical solution does not exist for mixed matrix membranes. Therefore, the validation of the numerical solution will be done with the analytical solution for a pure polymeric membrane. The analytical solution was used to calculate the time-dependent concentration profile within the membrane and the time-dependent permeation fluxes at the two interfaces of the membrane. The analytical solution both for the concentration profile and the permeation flux can be found in Wu et al. [24].
Both the analytical and numerical solutions were obtained as a function of time for a neat membrane having a diffusion and solubility coefficients (D
= 510-10 m2/s and S = 25 (g/L)/(g/L)), respectively. For the numerical solution, Eq. (3), subjected to boundary conditions of Eq. (2b-2e), was used to calculate the concentration profile of the permeants and the permeation flux at the two interfaces as a function of time. For this validation, the initial condition of the concentration within the membrane was set to be zero. The number of mesh points, (Nx, Ny, Nz), for this numerical solution, as well as for the majority of the numerical simulations was (41, 41, 41).
Results of the validation for the time-dependent concentration profile and the permeation fluxes at the two interfaces are presented in Figures 2 and 3, respectively.
Fig. 2 compares the numerical solution with the analytical solution for the concentration profile across the neat membrane at three different permeation times. Results clearly show that the numerical solution is very precise with an average error of 0.01% based on the three concentration profiles.
Fig. 3 shows the time-dependent upstream and downstream permeation fluxes of a penetrant in a neat polymeric membrane which were calculated using both the analytical model and the numerical solution. Results clearly show that the calculated permeation flux with the numerical method is a very good estimation of the analytical permeation flux with an average error of 0.05%. A much higher precision for the estimation of the steady-state permeation flux was obtained such that the numerical scheme developed in this investigation can be used with confidence for calculating the concentration profiles and the steady-state permeation flux of permeants in mixed matrix membranes.
Table 1
Values of solubility and diffusion coefficients used for various case studies for linear sorption isotherms.
Material D (m2
/s) (g/L)/(g/L) S P (m2
/h) Pd / Pc
Case 1
Continuous phase 5.0010-10 0.01 5.0010-12
500
Dispersed phase 1.0010-10 25.00 2.5010-09
Case 2
Continuous phase 5.0010-10 0.01 5.0010-12
10.00
Dispersed phase 2.0010-12 25.00 5.0010-11
Case 3
Continuous phase 5.0010-10 0.01 5.0010-12
1.00
Dispersed phase 5.0010-10 0.01 5.0010-12
Case 4
Continuous phase 5.0010-10 0.01 5.0010-12
0.1
Fig. 2. Concentration profile of the penetrant within a neat polymeric membrane as a function of the normalized length of the membrane at three different dimensionless times of the permeation process (Symbols: FD numerical solution; Lines: Analytical solution).
Fig. 3. Upstream (blue) and downstream (red) dimensionless permeation fluxes as a function of the dimensionless time for a neat polymeric membrane (Symbols: FD numerical solution; Lines: Analytical solution).
3.2. Concentration profile
In order to investigate the impact of the presence of particles on the concentration profile of the penetrants through a mixed matrix membrane, different permeability ratios of the dispersed to the continuous phase were considered for a single spherical filler located at the centre of a cubical repeatable element, with a filler volume fraction of 0.065. Figure 4 presents the concentration profile, normalized by their solubility, through the centre of the cubical unit element as indicated in the insert in Figure 4. When the permeability of the dispersed and continuous phases are identical, the concentration profile is obviously linear throughout the membrane. When the permeability of the dispersed phase is larger than the permeability of the continuous phase, the solid particle acts as an attractor where the
concentration streamlines will deviate slightly toward the solid particle since it offers an easier diffusion path. As a result, the overall permeation flux across the membrane will increase such that the slope of the concentration within the polymeric phase will increase to support this higher flux as observed for the concentration profile for Pd/Pc of 10. However, away from
the path of the particle, the concentration profile will not be as steep as the one shown in the centre line of the cubical element. Since the permeability of the particle is higher, the concentration gradient within the particle is smaller and the total concentration profile under steady state will adjust such that the average permeation flux at all x-z planes will be identical across the membrane (y-direction).
On the other hand, when the dispersed to the continuous permeability ratio is less than one, the particle acts as a barrier to the permeation of the penetrant and the concentration streamlines deviate away from the particle and the average permeation flux across the membrane becomes smaller. This is evidenced by the lower concentration gradient in the continuous phase above and below the particle in Figure 4. It is obvious that for mixed matrix membranes used for pervaporation and gas separation, a larger dispersed to continuous permeability ratio is required.
Fig. 4. Effect of presence of fillers on the concentration profile of the penetrants through a mixed matrix membrane. Concentration profile is along the line passing though the poles of the spherical particle.
3.3. Effect of the filler volume fraction () and permeability ratio (Pd/Pc)
A series of numerical experiments were performed to determine the effect of the volumetric filler content of the dispersed phase in the polymer matrix of MMMs on the effective membrane permeability. Since the effective permeability of a homogenously dispersed mixed matrix membrane is identical to the permeability of its repeatable unit element [20], to reduce the computing time, the numerical solution was performed on the repeatable element instead of the whole MMM. In addition to the filler volume fraction, another very important parameter impacting on the relative permeability of mixed matrix membranes is the ratio of the permeability coefficient of the dispersed to the continuous phase (Pd /Pc).
Figure 5 shows the variation of the relative effective permeability (Peff /Pc) as a function of the ratio of the permeability coefficient of the dispersed to the continuous phase for three different filler volumetric fractions for a spherical particle located at the centre of the repeatable cubical unit element. The variation of the relative effective permeability follows a sigmoid-shape variation with the ratio (Pd /Pc) with amplitude that increases rapidly with increasing filler volume fraction. When the permeability of the dispersed phase is smaller than the one in the continuous phase (when
permeability (Pd /Pc), the particles inhibit the permeation of penetrants across the membrane with Peff /Pc <1.
Results of Figure 5 show that there is a steep increase in the relative effective permeability for a dispersed to continuous permeability ratio between 1 and 10 and then it increases more slowly to attain a maximum increase in the relative effective permeability of the membrane at a dispersed to continuous permeability ratio of approximately 100. For ratio (Pd /Pc) lower than one, the particles inhibit the permeation of penetrants across the membrane. In order to compare the prediction of the effective permeability between the Maxwell model and the finite difference model obtained in this study, the relative effective permeability of the membrane was estimated using the Maxwell equation [25]. The predictions of the Maxwell model for the three filler volume fractions are plotted on Figure 5. The comparison in the prediction of the effective permeability between the Maxwell model and finite difference solutions revealed that, at the lower particle volume fraction, the predictions are almost identical. However, for higher particle volume fractions and for (Pd/Pc) values higher than 10, the Maxwell model tends to under estimate the relative effective permeability.
Fig. 5. Effect of the dispersed to the continuous permeability ratio (Pd/Pc) on the
relative permeability (Peff/Pc) of the membrane for one spherical particle centrally
located at the centre of a repeatable cubical element.
Fig. 6 compares the calculated relative effective permeability of ideal MMMs containing spherical and cubical fillers for two different ratios of (Pd/Pc) as a function of the volumetric filler content. Results in this figure clearly show that the relative permeability increases exponentially with the filler volume fraction. In addition, for the same relative ratio of the dispersed to the continuous phase permeabilities, the relative effective permeability of the cubical and spherical particles are identical up to a particle volume fraction of approximately 0.4.
3.4. Effect of the filler size
The effect of the size of the filler particles on the effective permeability of ideal MMMs was investigated using a single cubical element and a homogenous dispersion of spherical particles within the polymeric matrix. Results for different sizes of a single spherical particle and of numerous dispersed smaller spherical particles are presented in Fig. 7. Results clearly show that it is not the size of the spherical particles that matters but rather the total dispersed phase volume fraction. However, by increasing the size of the particles, the probability of particle-particle interaction (e.g. agglomeration) increases in the case of homogeneous or random dispersion which resulted in an important increase on the effective permeability of the membrane especially at higher dispersed to continuous phase permeability ratios (Pd/Pc). This observed increase is due to the creation of highly permeable (low resistance) pathways inside the membrane along the network of agglomerated particles [26]. Results presented in Figure 7 are for non-interacting particles.
The effective permeability of a mixed matrix membrane with a homogenously dispersed particle is independent of the particle size and is identical to the permeability of its repeatable element. However, potential non-ideality such as interface void, rigidification and pore blockage may in practice affect the effective permeability of mixed matrix membranes. It would be possible to investigate the effect of non-idealities provided they can be quantified. Nevertheless, in this study the effect of non-ideality was not considered as it can be neglected in many cases [13,27,28].
Fig. 6. Effect of the dispersed to continuous permeability ratio on the relative permeability of the homogenously-dispersed mixed matrix membrane for cubical and spherical particles.
3.5. Effect of the filler shape
The shape of the filler particle is another parameter which could affect the permeation properties of MMMs. For each geometrical shape and orientation, there exists a maximum filler volume fraction. To investigate the influence of the particle shape on the effective permeability of an ideal mixed matrix membrane with homogenous dispersion of particles, different geometric shapes such as cubical, spherical and cylindrical filler particles were used. Moreover, two different orientations of the cylindrical fillers (horizontal and vertical) were studied while it was assumed that the diffusion and solubility coefficients were identical in all directions. In the numerical solution by finite differences, the repeatable element consisted of a particle of the desired geometry that was centrally located in a cubical polymeric matrix surrounding the particle.
A series of simulations were performed for each particle shape over a wide range of filler volume fraction with a constant dispersed to continuous phase permeability ratio of 500 (Case 1 in Table 1). The calculated effective permeability obtained numerically for the different geometrical shapes and filler volume fractions is presented in Figure 8. Simulation results show that the effect of particle shape and orientation is not significant until a volumetric filler content reaches approximately 0.4. Beyond this volumetric filler content, the difference in the effective permeability for various particle shapes becomes more important. It appears that the cubical and horizontal cylindrical particles have very similar effective permeability over a wide range of volumetric filler content. Spherical particles are limited to smaller maximum dispersed phase volume fraction and have slightly higher effective permeability values than the cubical and horizontal cylindrical particles. Moreover, the relative effective permeability for the vertical cylinder is significantly greater than the relative effective permeability of the horizontal cylinder. A large-size vertical cylinder provides a large surface area, the two edges of the cylinder, that are close to the surfaces of the membrane and a small diffusional pathway within the polymeric membrane exists before the permeant can access the highly permeable dispersed phase. As a result, a large permeation flux occurs through the vertical cylinder and the overall permeation flux over the area of the membrane is significantly greater. For this reason, some researchers have used carbon nanotubes as fillers in mixed matrix membranes and have attempted to vertically align the embedded carbon nanotubes [29].
Fig. 8. Effect of the particle shape on the relative effective permeability of mixed matrix membranes with a constant dispersed to continuous phase permeability ratio (Pd/Pc) of 500 (Case 1 in Table 1).
3.6. Effect of the membrane thickness and mesh independency
A series of numerical simulations were performed to validate the hypothesis that the permeability of a repeatable unit element has an identical permeability of the entire membrane. Mixed matrix membranes of different
thicknesses were simulated for a constant filler volume fraction of =0.17 with a cubical filler particle located at the centre of a cubical repeatable unit element. In all simulations, a constant dispersed to continuous phase permeability ratio (Pd/Pc) of 500 (Case 1 in Table 1). Results obtained confirmed that, as predicted by Eq. (6), the effective permeability remained constant regardless of the thickness of the membrane. A thicker membrane for an identical concentration driving force leads to an equal decrease in the permeation flux such that the product JL in Eq. (6) remains unchanged. An additional series of experiments were performed where a number of repeatable unit elements were stacked one on top of the other to form a thick membrane. As expected, the effective permeability of the stack of repeatable unit elements had an identical effective permeability to a single repeatable unit element. These results imply that it is possible and desirable solving the Fick’s second law of diffusion for a section of the mixed matrix membrane provided that it is representative of all the other sections of the membrane.
Most simulations by finite differences performed in this investigation were performed with 41 mesh points to discretize each of the three dimensions of a repeatable cubical unit element. To confirm that this number of mesh points was sufficient to accurately calculate the effective permeability of mixed matrix membranes, the same problem was solved with three different numbers of mesh points. Fig. 9 presents the variation of the relative effective permeability of the mixed matrix membrane as a function of the volumetric filler content for three different numbers of mesh points. It is obvious that the discretization scheme used in this investigation is sufficient and can predict the effective membrane permeability accurately.
Fig. 9. Effect of the discretization size or number of mesh points on the relative effective permeability of mixed matrix membranes.
3.7. Effect of the sorption isotherm
mesh point in the solution domain will have a different value.
To investigate the effect of nonlinearity for species sorption in the filler material, Langmuir isotherm (Eq. (7)) was used in the numerical solution as the sorption mechanism of species in the filler material. Consequently, an apparent solubility coefficient Si,j,k associated to each mesh point corresponding to a particle was calculated using Eq. (8). The concentration profile was then calculated iteratively while the solubility coefficient of each node within a filler particle was also changing with the changing concentration until reaching steady-state.
1
m
q bC
q
bC
=
+
(7)=
=
1
+
m
q b
q
S
C
bC
(8)In Eqs. (7) and (8), b is the microvoid affinity constant and represents the ratio of sorption and desorption rate constants of the penetrant through the free space and qm is the Langmuir maximum sorption capacity of component in the dispersed filler. Parameter b is a constant related to the energy of adsorption and indicates the adsorption nature to be either unfavourable (low
b values) or favourable (high b values).
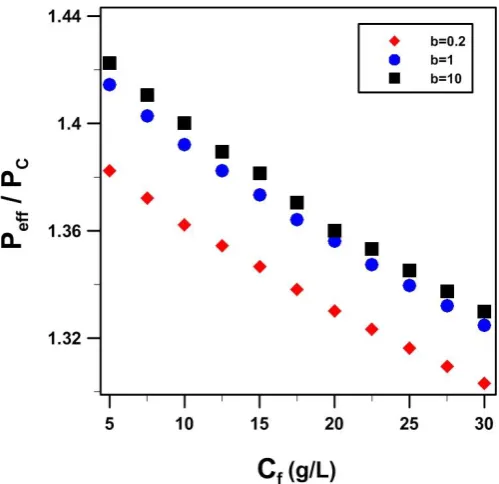
With the presence of filler particles characterized with a nonlinear isotherm, the solubility coefficient becomes a function of the concentration. A series of simulations as a function of the feed solution concentration were performed to calculate the relative effective permeability of a mixed matrix membrane with homogenously dispersed spherical particles for three different values of the Langmuir constant b for a fixed value of qm of 10 (g/L). Results for a filler volume fraction of 0.12 and a diffusion coefficient of 110-10 (m2/s) for the dispersed phase, are presented in Figure 10. The relative effective permeability of the mixed matrix membrane decreases when the isotherm changes from a favorable to a less favorable Langmuir isotherm. Figure 10
also shows the decrease in the relative effective permeability with an increase in the permeant feed concentration. As the feed concentration increases, the average solubility, as expressed by the right hand side of Eq. (8), will decrease and as a result, a decrease in the permeability of the filler material is observed. A decrease in the permeability of the filler material leads to a decrease in the effective permeability of the membrane.
Fig. 10. Effect of the sorption isotherm on the relative effective permeability of mixed matrix membranes as a function of the permeant feed concentration and for three different values of the Langmuir constant b with qm = 10 (g/L).
The average solubility of MMMs was calculated numerically based on the actual isotherm of the filler particle. In another work, Hashemifard et al. introduced an analytical solution based on the Langmuir sorption isotherm, the Darken equation and the Fick’s second law of diffusion to estimate the
average solubility coefficient of the penetrants in particles within the MMMs (Eq. (9)) [31].
(
)
ln 1
m
q
S bC
C
= + + (9)
The model proposed by Hashemifard et al. represents an average solubility coefficient of species in the particles within the MMMs. The average solubility determined numerically for the entire membrane was compared with the prediction of Hashemifard et al. Results of this comparison are presented in Fig. 11. The predictions of Hashemifard et al. model tend to overestimate the average solubility across the membrane. The difference between the average solubility coefficient calculated with two methods increases with the increasing value of Langmuir constant b.
Fig. 11. Comparison of the average solubility of the filler particle as a function of the permeant feed concentration for three values of the Langmuir constant b with qm
= 10 (g/L).
Figure 12 presents the effect of the average solubility on the relative effective permeability of MMMs for three different values of the Langmuir constant b. Results were obtained for a maximum sorption capacity (qm=10 (g/L)), a filler volume fraction of 0.12 and for a spherical particle located at the centre of a cubical unit element. Results show that the highest relative effective permeability is obtained, as expected, for the highest average solubility which is obtained with very favorable isotherm (high values of b). Since the relative effective permeability falls on the same curve for all three values of b, it is really the effect of the average solubility that dictates the effective permeability for a constant diffusion coefficient.
Fig. 12. Effect of the average solubility and Langmuir constant b on the relative effective permeability of mixed matrix membranes for a filler particle having a Langmuir isotherm (qm = 10 (g/L)).
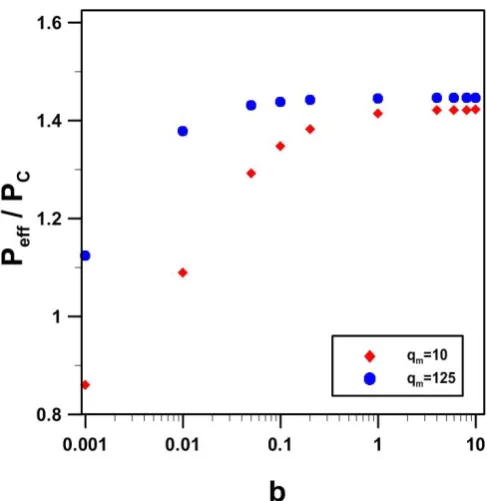
Fig. 13. Relative effective permeability as a function of the Langmuir constant b and the maximum sorption capacity qm of mixed matrix membranes.
4. Conclusions
In this study, a 3D finite difference method was used to model the mass transport of a permeant through ideal mixed matrix membranes comprised of a dispersion of filler particles embedded in the matrix of a continuous phase. The numerical solution was used to investigate the influence of the filler properties (filler volume fraction, size, shape, orientation, and sorption isotherm), the permeability ratio of the dispersed to the continuous phase, and membrane thickness. Results showed that the effective permeability of mixed matrix membranes is a strong function of the particle volume fraction and the ratio of the dispersed phase permeability to the continuous phase permeability. In addition, results revealed that the filler size has no effect on the relative permeability of a homogenous dispersion of particles in the matrix of the membrane. It was shown that the effective permeability of a
repeatable cubical unit element could be used to estimate the effective permeability of a mixed matrix membrane with homogenous dispersion of the filler material. The shape of the filler particles such as cubical, spherical and cylindrical particles had a negligible effect on the relative effective permeability of the membrane when the particle volume fraction in the matrix of the membrane was less than 0.4. Results also showed that the relative effective permeability of MMMs was higher for cylindrical particles with a vertical orientation compared to horizontal cylinders under identical conditions. Finally, numerical simulations revealed that the effective permeability of mixed matrix membranes is favoured with filler particles having a favorable isotherm (high b values) whereas the maximum adsorption capacity qmleads to a large increase in the effective permeability for small values of b but a relatively small increase for higher values of b.
5. Nomenclature
b Microvoid affinity constant (L/g)
C Concentration (g/L)
D Diffusion coefficient (m2/s)
i, j, k Position of a discretization node
J Permeate flux (g/m2h)
L Thickness of the membrane or repeatable unit element (m)
N Number of nodes in one Cartesian coordinate (-)
P Permeability (m2/h)
q Amount adsorbed (g/L)
qm Langmuir maximum sorption capacity (g/L)
R Particle radius (m)
S Solubility coefficient ((g/L)/(g/L))
t Time (s)
x, y, z Direction of Cartesian coordinates
Δt Time step (s)
Volume fraction of the filler (-)
τ Dimensionless time (-)
Subscripts
avg Average
c Continuous
d Dispersed
eff Effective
f Feed solution in contact with membrane
x, y, z Direction of Cartesian coordinates
i, j, k Position of a discretization node
Superscripts
L
m
R
t
Left
Type of component
Right
Time
6. Abbreviations
AC Activated carbon
CMS Carbon molecular sieves
CNTs Carbon nanotubes
FD Finite differences
MMM Mixed matrix membrane
MOFs Metal organics frameworks
7. References
[1] A. Hasanoglu, Y. Salt, S. Keleser, S. Ozkan, S. Dincer, Pervaporation separation of organics from multicomponent aqueous mixtures, Chem. Eng. Process. 46 (2007) 300–306.
[2] E.J. Jeon, A.S. Kim, Y.T. Lee, Pervaporation of butanol/water mixtures using siloxane polymer/ceramic composite membranes, Desalination Water Treat. 48 (2012) 17–26.
[3] F.F. Liu, L. Liu, X.S. Feng, Separation of acetone-butanol-ethanol (ABE) from dilute aqueous solutions by pervaporation, Sep. Purif. Technol. 42 (2005) 273–282.
[4] N. Qureshi, H.P. Blaschek, Butanol recovery from model solution/fermentation broth by pervaporation: evaluation of membrane performance, Biomass Bioenergy. 17 (1999) 175–184.
[5] H. Tan, Y. Wu, T. Li, Pervaporation of n-butanol aqueous solution through ZSM-5-PEBA composite membranes, J. Appl. Polym. Sci. 129 (2013) 105–112.
[6] P. Shao, R.Y.M. Huang, Polymeric membrane pervaporation, J. Membr. Sci. 287 (2007) 162–179.
[7] G.M. Monsalve-Bravo, S.K. Bhatia, Extending effective medium theory to finite size systems: Theory and simulation for permeation in mixed-matrix membranes, J. Membr. Sci. 531 (2017) 148–159.
[8] M. Fang, C. Wu, Z. Yang, T. Wang, Y. Xia, J. Li, ZIF-8/PDMS mixed matrix membranes for propane/nitrogen mixture separation: Experimental result and permeation model validation, J. Membr. Sci. 474 (n.d.) 103–113.
[9] T. Rodenas, I. Luz, G. Prieto, B. Seoane, H. Miro, A. Corma, F. Kapteijn, F.X. Llabrés i Xamena, J. Gascon, Metal–organic framework nanosheets in polymer composite materials for gas separation, Nat. Mater. 14 (2015) 48–55.
[10] P. Peng, B. Shi, Y. Lan, Preparation of PDMS Silica Nanocomposite Membranes with silane coupling for recovering ethanol by pervaporation, Sep. Sci. Technol. 46 (2011) 420–427.
[11] A.J. Bird, D.L. Trimm, Carbon molecular sieves used in gas separation membranes, Carbon. 21 (1983) 177–180.
[12] C.W. Jones, W.J. Koros, Carbon molecular sieve gas separation membranes-I. Preparation and characterization based on polyimide precursors, Carbon. 32 (1994) 1419–1425.
[13] H. Azimi, F.H. Tezel, J. Thibault, Effect of embedded activated carbon nanoparticles on the performance of polydimethylsiloxane (PDMS) membrane for pervaporation separation of butanol, J. Chem. Technol. Biotechnol. 92 (2017) 2901–2911.
[14] C. Xue, G.-Q. Du, L.-J. Chen, J.-G. Ren, J.-X. Sun, F.-W. Bai, S.-T. Yang, A carbon nanotube filled polydimethylsiloxane hybrid membrane for enhanced butanol recovery, Sci. Rep. 4 (2014) 5925–5925.
[15] X. Wang, J. Chen, M. Fang, T. Wang, L. Yu, J. Li, ZIF-7/PDMS mixed matrix membranes for pervaporation recovery of butanol from aqueous solution, Sep. Purif. Technol. 163 (2016) 39–47.
[16] A. Jonquières, A. Fane, Filled and unfilled composite GFT PDMS membranes for the recovery of butanols from dilute aqueous solutions: influence of alcohol polarity, J. Membr. Sci. 125 (1997) 245–255.
[17] O. Bakhtiari, S. Mosleh, T. Khosravi, T. Mohammadi, Preparation, characterization and gas permeation of polyimide mixed matrix membranes, J. Membr. Sci. Technol. 30 (2011) 589–597.
[18] T. Singh, D.-Y. Kang, S. Nair, Rigorous calculations of permeation in mixed-matrix membranes: Evaluation of interfacial equilibrium effects and permeability-based models, J. Membr. Sci. 448 (2013) 160–169.
[19] A.-C. Yang, C.-H. Liu, D.-Y. Kang, Estimations of effective diffusivity of hollow fiber mixed matrix membranes, J. Membr. Sci. 495 (2015) 269–275.
[20] A. Ebneyamini, H. Azimi, F.H. Tezel, J. Thibault, Mixed matrix membranes for pervaporation and gas separation applications: Development of a resistance-based model, J. Membr. Sci., 543 (2017) 351–360.
[21] A. Ebneyamini, H. Azimi, F.H. Tezel, J. Thibault, Modelling of mixed matrix membranes: Validation of the resistance-based model, J. Membr. Sci. 543 (2017) 361–369.
[22] A. Ebneyamini, H. Azimi, J. Thibault, F.H. Tezel, Description of butanol aqueous solution transport through commercial PDMS membrane via pervaporation using extended Maxwell–Stefan model, J. Sep. Sci. Technol. 53 (2017) 1611–1627.
[23] A. Ebneyamini, Modelling of pervaporation separation of butanol from aqueous solutions using polydimethylsiloxane (PDMS) mixed matrix membranes, Thesis, University of Ottawa, 2017.
[24] H. Wu, N. Al-Qasas, B. Kruczek, J. Thibault, Simulation of time-lag permeation experiments using finite differences, J. Fluid Flow Heat Mass Transf. (2015).
[25] R.H.B. Bouma, A. Checchetti, G. Chidichimo, E. Drioli, Permeation through a
heterogeneous membrane: the effect of the dispersed phase, J. Membr. Sci. 128 (1997) 141–149.
[26] M.G. García, J. Marchese, N.A. Ochoa, Effect of the particle size and particle agglomeration on composite membrane performance, J. Appl. Polym. Sci. 118 (2010) 2417–2424.
[27] G. Liu, W.-S. Hung, J. Shen, Q. Li, Y.-H. Huang, W. Jin, K.-R. Lee, J.-Y. Lai, Mixed matrix membranes with molecular-interaction-driven tunable free volumes for efficient bio-fuel recovery, J. Mater. Chem. A. 3 (2015) 4510–4521.
[28] E. Okumus, T. Gurkan, L. Yilmaz, Development of a Mixed-Matrix Membrane for Pervaporation, Sep. Sci. Technol. 29 (1994) 2451–2473.
[29] D.A. Walters, M.J. Casavant, X.C. Qin, C.B. Huffman, P.J. Boul, L.M. Ericson, E.H. Haroz, M.J. O’Connell, K. Smith, D.T. Colbert, R.E. Smalley, In-plane-aligned membranes of carbon nanotubes, Chem. Phys. Lett. 338 (2001) 14–20.
[30] D.M. Aguilar-Valencia, M.Á. Gómez-García, J. Fontalvo, Effect of pH, CO2, and
high glucose concentrations on polydimethylsiloxane pervaporation membranes for ethanol removal, Ind. Eng. Chem. Res. 51 (2012) 9328–9334.