University of New Hampshire
University of New Hampshire Scholars' Repository
Molecular, Cellular and Biomedical Sciences
Scholarship
Molecular, Cellular and Biomedical Sciences
Fall 10-28-2014
Characterization of the transcriptome, nucleotide
sequence polymorphism, and natural selection in
the desert adapted mouse Peromyscus eremicus
Matthew D. MacManes
University of New Hampshire - Main Campus, [email protected]
Michael B. Eisen
University of California - Berkeley, [email protected]
Follow this and additional works at:
https://scholars.unh.edu/mcbs_facpub
Part of the
Bioinformatics Commons
,
Computational Biology Commons
,
Desert Ecology
Commons
,
Evolution Commons
, and the
Genomics Commons
This Article is brought to you for free and open access by the Molecular, Cellular and Biomedical Sciences at University of New Hampshire Scholars' Repository. It has been accepted for inclusion in Molecular, Cellular and Biomedical Sciences Scholarship by an authorized administrator of University of New Hampshire Scholars' Repository. For more information, please [email protected].
Recommended Citation
Submitted15 September 2014 Accepted 9 October 2014 Published28 October 2014
Corresponding author
Matthew D. MacManes, [email protected], Twitter: @PeroMHC
Academic editor
Claus Wilke
Additional Information and Declarations can be found on page 10
DOI10.7717/peerj.642
Copyright
2014 MacManes and Eisen
Distributed under
Creative Commons CC-BY 4.0
OPEN ACCESS
Characterization of the transcriptome,
nucleotide sequence polymorphism, and
natural selection in the desert adapted
mouse
Peromyscus eremicus
Matthew D. MacManes1and Michael B. Eisen2
1Department of Molecular, Cellular and Biomedical Sciences, University of New Hampshire,
Durham, NH, USA
2Howard Hughes Medical Institute, University of California, Berkeley, CA, USA
ABSTRACT
As a direct result of intense heat and aridity, deserts are thought to be among the most harsh of environments, particularly for their mammalian inhabitants. Given that osmoregulation can be challenging for these animals, with failure resulting in death, strong selection should be observed on genes related to the maintenance of water and solute balance. One such animal,Peromyscus eremicus, is native to the desert regions of the southwest United States and may live its entire life without oral fluid intake. As a first step toward understanding the genetics that underlie this phenotype, we present a characterization of theP. eremicustranscriptome. We assay four tissues (kidney, liver, brain, testes) from a single individual and supplement this with population level renal transcriptome sequencing from 15 additional animals. We identified a set of transcripts undergoing both purifying and balancing selection based on estimates of Tajima’s D. In addition, we used the branch-site test to identify a transcript—Slc2a9, likely related to desert osmoregulation—undergoing enhanced selection inP. eremicusrelative to a set of related non-desert rodents.
Subjects Bioinformatics, Genomics, Zoology
Keywords Peromyscus, Solute carrier protein, Desert, Kidney, Transcriptome
INTRODUCTION
live where water is limited. Understanding these mechanisms will significantly enhance our understanding of the physiologic processes underlying osmoregulation in extreme environments, which will have implications for studies of human health, conservation, and climate change.
The genes and structures responsible for the maintenance of water and electrolyte balance are well characterized in model organisms such as mice (Tatum et al., 2009), rats (Romero et al., 2007;Rojek et al., 2006;Nielsen et al., 1995), and humans (Mobasheri et al., 2007;Bedford, Leader & Walker, 2003;Nielsen et al., 1999). These studies, many of which have been enabled by newer sequencing technologies, provide a foundation for studies of renal genomics in non-model organisms. Because researchers have long been interested in desert adaptation, a number of studies have looked at the morphology or expression of single genes in the renal tissues of desert adapted rodentsPhyllotis darwini(Gallardo, Cort´es & Bozinovic, 2005),Psammomys obesus(Kaissling et al., 1975), andPerognathus penicillatus(Altschuler et al., 1979). More recently, full renal transcriptomes have been generated forDipodomys spectabilisandChaetodipus baileyi, (Marra, Romero & DeWoody, 2014) as well asAbrothrix olivacea(Giorello et al., 2014).
These studies provide a rich context for current and future work aimed at developing a synthetic understanding of the genetic and genomic underpinnings of desert adaptation in rodents. As a first step, we have sequenced, assembled, and characterized the transcriptome (using four tissue types—liver, kidney, testes and brain) of a desert adapted cricetid rodent endemic to the southwest United States,Peromyscus eremicus. These animals have a lifespan typical of small mammals (Veal & Caire, 2001), and therefore an individual may live its entire life without ever drinking water. Additionally, they have a distinct advantage over other desert animals (e.g.,Dipodomys) in that they breed readily in captivity, which enables future laboratory studies of the phenotype of interest. In addition, the focal species is positioned in a clade of well known animals (e.g.,P. californicus,P. maniculatus, and P. polionotus) (Feng et al., 2007) with growing genetic and genomic resources (Shorter et al., 2014;Panhuis et al., 2011;Shorter et al., 2012). Together, this suggests that future comparative studies are possible.
While the elucidation of the mechanisms underlying adaptation to desert survival is beyond the scope of this manuscript, we aim to lay the groundwork by characterizing the transcriptome from four distinct tissues (brain, liver, kidney, testes). These data will be included in the current larger effort aimed at sequencing the entire genome.
Further, via sequencing the renal tissue of a total of 15 additional animals, we characterize nucleotide polymorphism and genome-wide patterns of natural selection. Together, these investigations will aid in our overarching goal to understand the genetic basis of adaptation to deserts inP. eremicus.
MATERIALS AND METHODS
Animal collection and study design
period (2012–2013). These individuals were captured in live traps and then euthanized using isoflurane overdose and decapitation. Immediately post-mortem, the abdominal and pelvic organs were removed, cut in half (in the case of the kidneys), placed in RNAlater and flash frozen in liquid nitrogen. Removal of the brain, with similar preservation techniques, followed. Time from euthanasia to removal of all organs never exceeded five minutes. Samples were transferred to a−80C freezer at a later date. These procedures were approved
by the Animal Care and Use Committee located at the University of California Berkeley (protocol number R224) and University of New Hampshire (protocol number 130902) as well as the California Department of Fish and Game (protocol SC-008135) and followed guidelines established by the American Society of Mammalogy for the use of wild animals in research (Sikes et al., 2011).
RNA extraction and sequencing
Total RNA was extracted from each tissue using a TRIzol extraction (Invitrogen) following the manufacturer’s instructions. Because preparation of an RNA library suitable for sequencing is dependent on having high quality, intact RNA, a small aliquot of each total RNA extract was analyzed on a Bioanalyzer 2100 (Agilent, Palo Alto, CA, USA). Following confirmation of sample quality, the reference sequencing libraries were made using the TruSeq stranded RNA prep kit (Illumina), while an unstranded TruSeq kit was used to construct the other sequencing libraries. A unique index was ligated to each sample to allow for multiplexed sequencing. Reference libraries (n=4 tissue types from Peer360,
a male mouse used for generating a genome sequence—not part of the current study) were then pooled to contain equimolar quantities of each individual library and submitted for Illumina sequencing using two lanes of 150nt paired end sequencing employing the rapid-mode of the HiSeq 2500 sequencer at The Hubbard Center for Genome Sciences (University of New Hampshire). The remaining 15 libraries were multiplexed and sequenced in a mixture of 100nt paired and single end sequencing runs across several lanes of an Illumina HiSeq 2000 at the Vincent G. Coates Genome Center (University of California, Berkeley).
Sequence data preprocessing and assembly
The raw sequence reads corresponding to the four tissue types were error corrected using the software bless version 0.17 (Heo et al., 2014) using kmer=25, based on the developer’s
default recommendations (https://github.com/macmanes/pero transcriptome/blob/ master/analyses.md#error-correction). The error-corrected sequence reads were adapter and quality trimmed following recommendations fromMacManes (2014)andMbandi et al. (2014). Specifically, adapter sequence contamination and low quality nucleotides (defined as P<2) were removed using the program Trimmomatic version 0.32
deeply sequenced individual (Peer360, a male) to reduce polymorphism and thus the complexity of the de Bruijn graph, which has important implications for runtime, hardware requirements (Lowe, Swalla & Brown, 2014;Pop, 2009), and assembly contiguity (Vijay et al., 2013). Individual tissues were assembled independently, as we hypothesize that tissue specific isoforms would be reconstructed with higher fidelity than if all tissues were assembled together.
The assembly was conducted on a linux workstation with 64 cores and 512Gb RAM. To filter the raw sequence assembly, we downloadedMus musculuscDNA and ncRNA datasets from Ensembl (ftp://ftp.ensembl.org/pub/release-75/fasta/mus musculus/) and thePeromyscus maniculatusreference transcriptome from NCBI (ftp://ftp.ncbi.nlm. nih.gov/genomes/Peromyscus maniculatus bairdii/RNA/). We used a blastN (version 2.2.29+) procedure (default settings, evalue set to 10−10) to identify contigs in the
P. eremicusdataset likely to be biological in origin (https://github.com/macmanes/pero transcriptome/blob/master/analyses.md#blasting). This procedure, when a reference dataset is available, retains more putative transcripts than a strategy employing expression-based filtering (remove if transcripts per million (TPM)<1 (MacManes & Lacey, 2012)) of the raw assembly. We then concatenated the filtered assemblies from each tissue into a single file and reduced redundancy using the software cd-hit-est version 4.6 (Li & Godzik, 2006) using default settings, except that sequences were clustered based on 95% sequence similarity (https://github.com/macmanes/pero transcriptome/blob/master/analyses.md# cd-hit-est). This multi-fasta file was used for all subsequent analyses, including annotation and mapping.
Assembled sequence annotation
The filtered assemblies were annotated using the default settings of the blastN algorithm (Camacho et al., 2009) against the Ensembl cDNA and ncRNA datasets described above, downloaded on 1 August 2014. Among other things, the Ensemble transcript identifiers were used in the analysis of gene ontology conducted in the PANTHER package (Mi, 2004). Next, because rapidly evolving nucleotide sequences may evade detection by blast algorithms, we used HMMER3 version 3.1b1 (Wheeler & Eddy, 2013) to search for conserved protein domains contained in the dataset using the Pfam database (Punta et al., 2012) (https://github.com/macmanes/pero transcriptome/blob/master/analyses.md# hmmer3pfam). Lastly, we extracted putative coding sequences using Transdecoder version 4 Jul 2014 (http://transdecoder.sourceforge.net/) (https://github.com/macmanes/pero transcriptome/blob/master/analyses.md#transdecoder).
Population genomics
In addition to the reference individual sequenced at four different tissue types, we
sequenced 15 other conspecific individuals from the same population in Palm Desert, California. Sequence data were mapped to the reference transcriptome using bwa-mem. The alignments were sorted and converted to BAM format using the samtools software package (Li et al., 2009), then passed to the program Aversion 0.610, which was used
for calculating the folded site frequency spectrum (SFS) and Tajima’s D (Korneliussen et al., 2013) using instructions found athttp://popgen.dk/angsd/index.php/Tajima.
Natural selection
To characterize natural selection on several genes related to water and ion homeostasis, we identified several of the transcripts identified as experiencing positive selection in a recent work on desert-adapted Heteromyid rodents (Marra, Romero & DeWoody, 2014). The coding sequences corresponding to these genes, Solute Carrier family 2 member 9 (Slc2a9), the Vitamin D3 receptor (Vdr) and several of the Aquaporin genes (Aqp1,2,4,9), were extracted from the dataset, aligned using the software MACSE version 1.01b (Ranwez et al., 2011) to homologous sequences inMus musculus,Rattus norvegicus,Peromyscus maniculatus, andHomo sapiensas identified by the conditional reciprocal best blast procedure (CRBB (Aubry et al., 2014)). An unrooted gene tree with branch lengths was constructed using the online resource ClustalW2-Phylogeny (http://www.ebi.ac.uk/Tools/ phylogeny/clustalw2 phylogeny/), and the tree and alignment were analyzed using the branch-site model (model =2, nsSites=2, fix omega=0 versus model=2, nsSites=2,
fix omega=1, omega=1) implemented in PAML version 4.8 (Yang & dos Reis, 2011;Yang,
2007). Significance was evaluated via the use of the likelihood ratio test.
RESULTS AND DISCUSSION
RNA extraction, sequencing, assembly, mapping
RNA was extracted from the hypothalamus, renal medulla, testes, and liver from each individual using sterile technique. TRIzol extraction resulted in a large amount of high quality (RIN≥8) total RNA, which was then used as input. Libraries were constructed as
per the standard Illumina protocol and sequenced as described above. The number of reads per library varied from 56 million strand-specific paired-end reads in Peer360 kidney, to 9 million single-end reads in Peer321 (Table 1). Adapter sequence contamination and low-quality nucleotides were eliminated which resulted in a loss of<2% of the total number of reads. These trimmed reads served as input for all downstream analyses.
Table 1 The number of sequencing reads per sample, whose identity is indicated by Peer[number].
DATASET NUM. RAWREADS SRA ACCESSION
P360 T 32M PE/SS SRR1575398
P360 L 53M PE/SS SRR1575397
P360 K 56M PE/SS SRR1575396
P360 B 23M PE/SS SRR1575395
P305 19M PE SRR1575434
P308 15M PE SRR1575437
P319 14M PE SRR1575439
P321 9M SE SRR1575441
P340 16M PE SRR1575443
P352 14M PE SRR1575464
P354 9M SE SRR1575466
P359 14M PE SRR1575492
P365 16M PE SRR1575493
P366 16M PE SRR1575494
P368 14M PE SRR1575624
P369 14M PE SRR1575625
P372 17M SE SRR1576070
P373 23M SE SRR1576071
P380 16M SE SRR1576072
P382 14M SE SRR1576073
Notes.
PE, paired end; SS, strand specific; SE, single end sequencing.
reads to these datasets resulted in mapping 94.98% (87.01% properly paired) of the brain-derived reads to the brain transcriptome, 96.07% (88.13% properly paired) of the liver-derived reads to the liver transcriptome, 96.81% (85.10% properly paired) of the testes-derived reads to the testes transcriptome, and 91.87% (83.77% properly paired) of the kidney-derived reads to the kidney transcriptome. Together, these statistics suggest that the tissue-specific transcriptomes are of extremely high quality. All tissue-specific assemblies are available on Dryad (10.5061/dryad.qf1dp).
We then estimated gene expression on each of these tissue-specific datasets, which allowed us to understand expression patterns in the multiple tissues (Pero.tissue.xprs, available on Dryad (10.5061/dryad.qf1dp)). Specifically, we constructed a Venn diagram (Fig. 1) that allowed us to visualize the proportion of genes whose expression was limited to a single tissue and those whose expression was ubiquitous. 66,324 transcripts are expressed in all tissue types, while 13,086 are uniquely expressed in the kidney, 2,222 in the testes, 3,580 in the brain, and 2,798 in the liver. The kidney appears to an outlier in the number of unique sequences, though this could be the result of the recovery of more lowly expressed transcripts or isoforms.
Figure 1 The Venn Diagram, which provides a visual representation of the overlap of expression of the four tissue types.The majority of transcripts (66,324) are expressed in all studied tissue types.
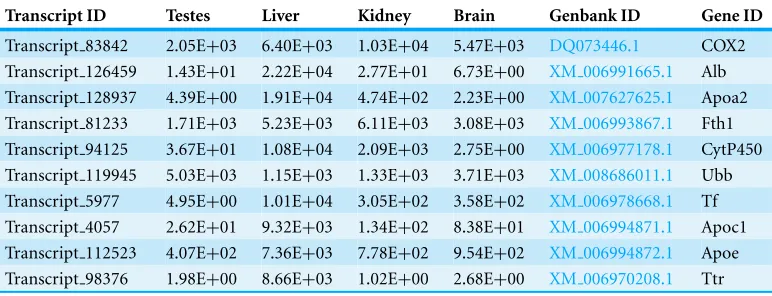
Table 2 The 10 transcripts with the highest mean TPM (transcripts per million).
Transcript ID Testes Liver Kidney Brain Genbank ID Gene ID
Transcript 83842 2.05E+03 6.40E+03 1.03E+04 5.47E+03 DQ073446.1 COX2 Transcript 126459 1.43E+01 2.22E+04 2.77E+01 6.73E+00 XM 006991665.1 Alb
Transcript 128937 4.39E+00 1.91E+04 4.74E+02 2.23E+00 XM 007627625.1 Apoa2 Transcript 81233 1.71E+03 5.23E+03 6.11E+03 3.08E+03 XM 006993867.1 Fth1
Transcript 94125 3.67E+01 1.08E+04 2.09E+03 2.75E+00 XM 006977178.1 CytP450 Transcript 119945 5.03E+03 1.15E+03 1.33E+03 3.71E+03 XM 008686011.1 Ubb Transcript 5977 4.95E+00 1.01E+04 3.05E+02 3.58E+02 XM 006978668.1 Tf
Transcript 4057 2.62E+01 9.32E+03 1.34E+02 8.38E+01 XM 006994871.1 Apoc1 Transcript 112523 4.07E+02 7.36E+03 7.78E+02 9.54E+02 XM 006994872.1 Apoe
Transcript 98376 1.98E+00 8.66E+03 1.02E+00 2.68E+00 XM 006970208.1 Ttr
Transcript 126459, Albumin is very highly expressed in the liver, but less so in the other tissues. It should be noted, however, that making inference based on uncorrected values for TPM is not warranted. Statistical testing for differential expression was not implemented
due to the fact that no replicates are available.
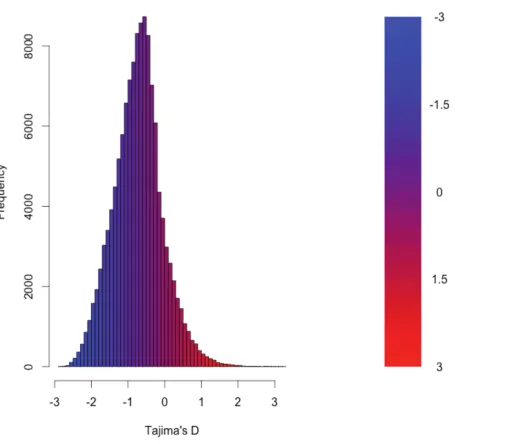
Figure 2 The distribution of Tajima’s D for all putative transcripts.
Population genomics
As detailed above, RNAseq data from 15 individuals were mapped to the reference transcriptome with the resulting BAM files being used as input to the software package ANGSD. The Tajima’s D statistic was calculated for all transcripts covered by at least 14 of the 15 individuals. In brief, a negative Tajima’s D—a result of lower than expected average heterozygosity—is often associated with purifying or directional selection, recent selective sweep or recent population expansion, or a complex combination of these forces. In contrast, a positive value for Tajima’s D represents higher than expected average heterozygosity, often associated with balancing selection.
The distribution of the estimates of Tajima’s D for all of the assembled transcripts is shown inFig. 2. Although Tajima’s D is known to be sensitive to demographic history, which is largely unknown for this population, the estimates may also be drive by patterns of selection. In general, the distribution is skewed toward negative values (mean= −0.89,
variance=0.58), which may be the result of purifying selection, a model of evolution
commonly invoked for coding DNA sequences (Chamary, Parmley & Hurst, 2006).Table 3
presents the 10 transcripts whose estimate of Tajima’s D is the greatest, whileTable 4
Table 3 The 10 transcripts with the highest values for Tajima’s D, which suggests balancing selection.
Transcript ID GenBank ID Description Tajima’s D
Transcript 49049 XM 006533884.1 heterogeneous nuclear ribonucleoprotein H1 (Hnrnph1)
3.26
Transcript 38378 XM 006522973.1 Son DNA binding protein (Son) 3.19 Transcript 126187 NM 133739.2 transmembrane protein 123 (Tmem123) 3.02 Transcript 70953 XM 006539066.1 chloride channel Kb (Clcnkb) 2.96 Transcript 37736 XM 006997718.1 h-2 class I histocompatibility antigen 2.92 Transcript 21448 XM 006986148.1 zinc finger protein 624-like 2.84 Transcript 47450 NM 009560.2 zinc finger protein 60 (Zfp60) 2.82 Transcript 122250 XM 006539068.1 chloride channel Kb (Clcnkb) 2.81 Transcript 78367 XM 006496814.1 CDC42 binding protein kinase alpha
(Cdc42bpa)
2.78
Transcript 96470 XM 006987129.1 interferon-inducible GTPase 1-like 2.77
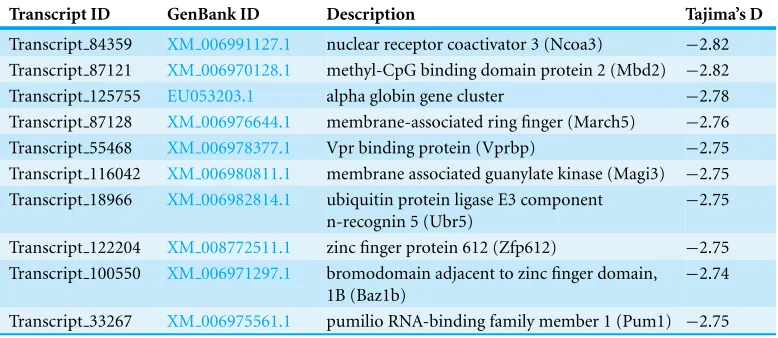
Table 4 The 10 transcripts with the lowest values for Tajima’s D, which suggests purifying or direc-tional selection.
Transcript ID GenBank ID Description Tajima’s D
Transcript 84359 XM 006991127.1 nuclear receptor coactivator 3 (Ncoa3) −2.82 Transcript 87121 XM 006970128.1 methyl-CpG binding domain protein 2 (Mbd2) −2.82
Transcript 125755 EU053203.1 alpha globin gene cluster −2.78 Transcript 87128 XM 006976644.1 membrane-associated ring finger (March5) −2.76
Transcript 55468 XM 006978377.1 Vpr binding protein (Vprbp) −2.75 Transcript 116042 XM 006980811.1 membrane associated guanylate kinase (Magi3) −2.75 Transcript 18966 XM 006982814.1 ubiquitin protein ligase E3 component
n-recognin 5 (Ubr5)
−2.75
Transcript 122204 XM 008772511.1 zinc finger protein 612 (Zfp612) −2.75
Transcript 100550 XM 006971297.1 bromodomain adjacent to zinc finger domain, 1B (Baz1b)
−2.74
Transcript 33267 XM 006975561.1 pumilio RNA-binding family member 1 (Pum1) −2.75
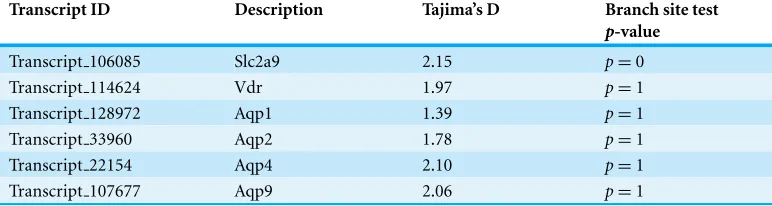
Natural selection
To begin to test the hypothesis that selection on transcripts related to osmoregulation is enhanced in the desert adaptedP. eremicus, we calculated Tajima’s D as described above, and implemented the branch-site test using alignments produced in MACSE. These alignments were manually inspected, and were relatively free from indels and internal stop codons. We set the sequence corresponding toP. eremicusfor Slc2a9, Vdr, and several of the Aquaporin genes (Aqp1,2,4,9) as the foreground lineages in six distinct program executions. The transcripts Slc2a9 and Vdr were chosen specifically because they—the former significantly—were recently linked to osmoregulation in a desert rodent (Marra, Romero & DeWoody, 2014). The test for Slc2a9 was highly significant (2ΔLnl=51.4,
Table 5 Several candidate genes were evaluated using Tajima’s D and the branch site test implemented in PAML.
Transcript ID Description Tajima’s D Branch site test
p-value
Transcript 106085 Slc2a9 2.15 p=0
Transcript 114624 Vdr 1.97 p=1
Transcript 128972 Aqp1 1.39 p=1
Transcript 33960 Aqp2 1.78 p=1
Transcript 22154 Aqp4 2.10 p=1
Transcript 107677 Aqp9 2.06 p=1
lineages. The branch site tests for positive selection conducted on the Vdr and Aquaporin genes were non-significant. While the branch site test of positive selection is largely non-significant, estimating Tajima’s D for these few candidate loci demonstrates that either a selective or demographic process may be influencing the genome at these functionally relevant sites.
CONCLUSIONS
As a direct result of intense heat and aridity, deserts are thought to be amongst the harshest environments, particularly for mammalian inhabitants. Given that osmoregulation can be challenging for these animals—with failure resulting in death—strong selection should be observed on genes related to the maintenance of water and solute balance. This study aimed to characterize the transcriptome of a desert-adapted rodent species,P. eremicus. Specifically, we characterized the transcriptome of four tissue types (liver, kidney, brain, and testes) from a single individual and supplemented this with population-level renal transcriptome sequencing from 15 additional animals. We identified a set of transcripts undergoing both purifying and balancing selection based on Tajima’s D. In addition, we used a branch site test to identify a transcript, likely related to desert osmoregulation, undergoing enhanced selection inP. eremicusrelative to a set of non-desert rodents.
ACKNOWLEDGEMENTS
This manuscript was greatly improved by careful review from C Titus Brown, Elijah Lowe, and an anonymous reviewer, as well as by Matthew Hahn, who provided feedback on an earlier version of the manuscript posted on bioRxiv.
ADDITIONAL INFORMATION AND DECLARATIONS
Funding
Grant Disclosures
The following grant information was disclosed by the authors: NIH NRSA postdoctoral fellowship: 5 F32 DK093227-03.
Competing Interests
The authors declare there are no competing interests.
Author Contributions
• Matthew D. MacManes conceived and designed the experiments, performed the
experiments, analyzed the data, contributed reagents/materials/analysis tools, wrote the paper, prepared figures and/or tables, reviewed drafts of the paper.
• Michael B. Eisen contributed reagents/materials/analysis tools, reviewed drafts of the
paper.
Animal Ethics
The following information was supplied relating to ethical approvals (i.e., approving body and any reference numbers):
The work was approved by the University of New Hampshire IACUC under protocol number 130902 and University of California IACUC protocol number R224.
Field Study Permissions
The following information was supplied relating to field study approvals (i.e., approving body and any reference numbers):
The work was approved by the California Department of Fish and Game protocol number SC-008135.
DNA Deposition
The following information was supplied regarding the deposition of DNA sequences: NCBI SRA BioProject:PRJNA242486.
Data Deposition
The following information was supplied regarding the deposition of related data: Dryad repo:http://dx.doi.org/10.5061/dryad.qf1dp.
REFERENCES
Altschuler EM, Nagle RB, Braun EJ, Lindstedt SL, Krutzsch PH. 1979.Morphological study of the desert heteromyid kidney with emphasis on the genusPerognathus.The Anatomical Record
194(3):461–468DOI 10.1002/ar.1091940311.
Aubry S, Kelly S, K¨umpers BMC, Smith-Unna RD, Hibberd JM. 2014.Deep evolutionary comparison of gene expression identifies parallel recruitment of trans-factors in two independent origins of C4 photosynthesis.PLoS Genetics 10(6):e1004365 DOI 10.1371/journal.pgen.1004365.
Bolger AM, Lohse M, Usadel B. 2014.Trimmomatic: a flexible trimmer for Illumina sequence data.Bioinformatics30(15):2114–2120DOI 10.1093/bioinformatics/btu170.
Camacho C, Coulouris G, Avagyan V, Ma N, Papadopoulos J, Bealer K, Madden TL. 2009. BLAST+: architecture and applications.BMC Bioinformatics10(1):421
DOI 10.1186/1471-2105-10-421.
Chamary JV, Parmley JL, Hurst LD. 2006.Hearing silence: non-neutral evolution at synonymous sites in mammals.Nature Reviews Genetics7(2):98–108DOI 10.1038/nrg1770.
Feng B-J, Sun L-D, Soltani-Arabshahi R, Bowcock AM, Nair RP, Stuart P, Elder JT, Schrodi SJ, Begovich AB, Abecasis GR, Zhang X-J, Callis-Duffin KP, Krueger GG, Goldgar DE. 2007. Toward a molecular phylogeny forPeromyscus: evidence from mitochondrial cytochrome-b Sequences.Journal of Mammalogy88(5):1146–1159DOI 10.1644/06-MAMM-A-342R.1. Gallardo PA, Cort´es A, Bozinovic F. 2005.Phenotypic flexibility at the molecular and organismal
level allows desert-dwelling rodents to cope with seasonal water availability.Physiological and Biochemical Zoology78(2):145–152DOI 10.1086/425203.
Giorello FM, Feijoo M, D’El´ıa G, Valdez L, Opazo JC, Varas V, Naya DE, Lessa EP. 2014. Characterization of the kidney transcriptome of the South American olive mouseAbrothrix olivacea.BMC Genomics15(1):446DOI 10.1186/1471-2164-15-446.
Haas BJ, Papanicolaou A, Yassour M, Grabherr M, Blood PD, Bowden J, Couger MB, Eccles D, Li B, Lieber M, MacManes MD, Ott M, Orvis J, Pochet N, Strozzi F, Weeks N, Westerman R, William T, Dewey CN, Henschel R, Leduc RD, Friedman N, Regev A. 2013.De novotranscript sequence reconstruction from RNA-seq using the Trinity platform for reference generation and analysis.Nature Protocols8(8):1494–1512DOI 10.1038/nprot.2013.084.
Heo Y, Wu X-L, Chen D, Ma J, Hwu W-M. 2014.BLESS: bloom filter-based error correction solution for high-throughput sequencing reads. Bioinformatics 30(10):1354–1362 DOI 10.1093/bioinformatics/btu030.
Kaissling B, De Rouffignac C, Barrett JM, Kriz W. 1975.The structural organization of the kidney of the desert rodentPsammomys obesus.Anatomy and Embryology148(2):121–143 DOI 10.1007/BF00315265.
Korneliussen TS, Moltke I, Albrechtsen A, Nielsen R. 2013.Calculation of Tajima’s D and other neutrality test statistics from low depth next-generation sequencing data.BMC Bioinformatics
14(1):289DOI 10.1186/1471-2105-14-289.
Li H. 2013.Aligning sequence reads, clone sequences and assembly contigs with BWA-MEM. ArXiv preprint.arXiv:1303.3997[q-bio.GN].
Li W, Godzik A. 2006.Cd-hit: a fast program for clustering and comparing large sets of protein or nucleotide sequences.Bioinformatics22(13):1658–1659DOI 10.1093/bioinformatics/btl158. Li H, Handsaker B, Wysoker A, Fennell T, Ruan J, Homer N, Marth G, Abecasis G, Durbin R,
1000 Genome Project Data Processing Subgroup. 2009.The sequence alignment/map format and SAMtools.Bioinformatics25(16):2078–2079DOI 10.1093/bioinformatics/btp352. Lowe EK, Swalla BJ, Brown CT. 2014. Evaluating a lightweight transcriptome
as-sembly pipeline on two closely related Ascidian species.PeerJ Preprints 2:e505v1 DOI 10.7287/peerj.preprints.505v1.
MacManes MD. 2014.On the optimal trimming of high-throughput mRNA sequence data.
Frontiers in Genetics5:1–13DOI 10.3389/fgene.2014.00013.
Marra NJ, Romero A, DeWoody JA. 2014. Natural selection and the genetic basis of osmoregulation in heteromyid rodents as revealed by RNA-seq. Molecular Ecology
23(11):2699–2711DOI 10.1111/mec.12764.
Mbandi SK, Hesse U, Rees DJG, Christoffels A. 2014.A glance at quality score: implication forde novotranscriptome reconstruction of Illumina reads. Frontiers in Genetics5:1–17 DOI 10.3389/fgene.2014.00017.
Mi H. 2004.The PANTHER database of protein families, subfamilies, functions and pathways.
Nucleic Acids Research33(1):D284–D288DOI 10.1093/nar/gki078.
Mobasheri A, Marples D, Young IS, Floyd RV, Moskaluk CA, Frigeri A. 2007.Distribution of the AQP4 water channel in normal human tissues: protein and tissue microarrays reveal expression in several new anatomical locations, including the prostate gland seminal vesicles.Channels
1(1):30–39DOI 10.4161/chan.3735.
Nielsen S, Chou C, Marples D, Christensen E, Kishore B, Knepper M. 1995.Vasopressin increases water permeability of kidney collecting duct by inducing translocation of Aquaporin-CD water channels to plasma-membrane.Proceedings of the National Academy of Sciences of the United States of America92(4):1013–1017DOI 10.1073/pnas.92.4.1013.
Nielsen S, Kwon TH, Christensen BM, Promeneur D, Frøkiaer J, Marples D. 1999.Physiology and pathophysiology of renal aquaporins.Journal of the American Society of Nephrology
10(3):647–663.
Panhuis TM, Broitman-Maduro G, Uhrig J, Maduro M, Reznick DN. 2011.Analysis of expressed sequence tags from the placenta of the live-bearing fishPoeciliopsis(Poeciliidae).Journal of Heredity102(3):352–361DOI 10.1093/jhered/esr002.
Pop M. 2009.Genome assembly reborn: recent computational challenges. Briefings in Bioinformatics10(4):354–366DOI 10.1093/bib/bbp026.
Punta M, Coggill PC, Eberhardt RY, Mistry J, Tate J, Boursnell C, Pang N, Forslund K, Ceric G, Clements J, Heger A, Holm L, Sonnhammer ELL, Eddy SR, Bateman A, Finn RD. 2012. The Pfam protein families database.Nucleic Acids Research40:D290–D301
DOI 10.1093/nar/gkr1065.
Ranwez V, Harispe S, Delsuc F, Douzery EJP. 2011. MACSE: multiple alignment of coding sequences accounting for frameshifts and stop codons. PLoS ONE
6(9):e22594DOI 10.1371/journal.pone.0022594.
Roberts A, Pachter L. 2013.Streaming fragment assignment for real-time analysis of sequencing experiments.Nature Methods10(1):71–73DOI 10.1038/nmeth.2251.
Rojek A, Fuchtbauer E, Kwon T, Frokiaer J, Nielsen S. 2006.Severe urinary concentrating defect in renal collecting duct-selective AQP2 conditional-knockout mice.Proceedings of the National Academy of Sciences of the United States of America 103(15):6037–6042 DOI 10.1073/pnas.0511324103.
Romero DG, Plonczynski MW, Welsh BL, Gomez-Sanchez CE, Zhou MY, Gomez-Sanchez EP. 2007.Gene expression profile in rat adrenal zona glomerulosa cells stimulated with aldosterone secretagogues.Physiological Genomics32(1):117–127
DOI 10.1152/physiolgenomics.00145.2007.
Shorter KR, Crossland JP, Webb D, Szalai G, Felder MR, Vrana PB. 2012. Peromyscus
as a mammalian epigenetic model. Genetics Research International 2012:1–11 DOI 10.1155/2012/179159.
underlying differences inPeromyscusrepetitive and social/aggressive behaviors.Behavior
Genetics44(2):126–135DOI 10.1007/s10519-013-9640-8.
Sikes RS, Gannon WL, Animal Care and Use Committee of the American Society of
Mammalogists. 2011.Guidelines of the American society of mammalogists for the use of wild mammals in research.Journal of Mammalogy92(1):235–253DOI 10.1644/10-MAMM-F-355.1. Tatum R, Zhang Y, Salleng K, Lu Z, Lin JJ, Lu Q, Jeansonne BG, Ding L, Chen YH. 2009.Renal
salt wasting and chronic dehydration in claudin-7-deficient mice.AJP: Renal Physiology
298(1):F24–F34.
Veal R, Caire W. 2001.Peromyscus eremicus.Mammalian Species(118):1–6.Available athttp:// www.science.smith.edu/msi/pdf/i0076-3519-118-01-0001.pdf.
Vijay N, Poelstra JW, K¨unstner A, Wolf JBW. 2013.Challenges and strategies in transcriptome assembly and differential gene expression quantification. A comprehensivein silicoassessment of RNA-seq experiments.Molecular Ecology22(3):620–634DOI 10.1111/mec.12014.
Walsberg G. 2000.Small mammals in hot deserts: some generalizations revisited.Bioscience
50(2):109–120DOI 10.1641/0006-3568(2000)050[0109:SMIHDS]2.3.CO;2.
Wheeler TJ, Eddy SR. 2013.nhmmer: DNA homology search with profile HMMs.Bioinformatics
29(19):2487–2489DOI 10.1093/bioinformatics/btt403.
Yang Z. 2007.PAML 4: phylogenetic analysis by maximum likelihood.Molecular Biology and Evolution24(8):1586–1591DOI 10.1093/molbev/msm088.
Yang Z, dos Reis M. 2011.Statistical properties of the branch-site test of positive selection.
![Table 1 The number of sequencing reads per sample, whose identity is indicated by Peer[number].](https://thumb-us.123doks.com/thumbv2/123dok_us/9610352.1489366/7.612.186.576.115.394/table-number-sequencing-reads-sample-identity-indicated-number.webp)