*Corresponding author
HIGH TEMPERATURE EFFECT AT TERMINAL STAGE IN MUSTARD GENOTYPES
LALLU* AND R.K. DIXIT
Oilseed Section, C.S. Azad University of Agriculture & Technology, Kanpur-208 002, U.P. Received on 30 Jan., 2008, Revised on 22 Apr., 2008
SUMMARY
Twenty two promising mustard (Brassica juncea (L.) Czern & Coss) genotypes were sown in October and November of rabi 2005-06. Late sowing was done to allow high temperature exposure on mustard genotypes at seed development stage. Late sowing at terminal stage caused significant and drastic reduction in number of branches, number of siliquae, seed yield, harvest index and test weight. Maximum reduction in dry matter production at 50% flowering (64.3%), at harvest (73.7%) and in seed yield (90.3%) on secondary branches occurred in RGN-48 while number of siliquae on secondary branches in Kranti (77.7%) over normal sown plants. Significant genotypic variations were also observed for these characters. Genotypes PCR-7, SKM-9927, SKM-9928 and NPJ-93 were found tolerant to high temperature at terminal stage as these showed value of heat susceptibility index < 0.5 and yield stability ratio > 70.0%. Dry matter accumulation at harvest (r=0.836) showed positive association with seed yield in mustard genotypes under late sown condition.
Key words: Heat susceptibility index, high temperature tolerance, mustard, seed yield, yield stability ratio.
INTRODUCTION
In the northern belt, the recommended sowing time of Indian mustard is the middle of October, when the mean daily temperature is about 25°C. Earlier and later sowing results reduction in the potential yield. High temperature during reproduction has been reported to cause a reduction in fertility and seed yield in wheat (Saini et al. 1983), cowpea (Ahmed and Hall 1993) and in pea (Guilioni et al. 1997). Babu (1985) reported that delay of 20 days beyond October 21 results 40% yield reduction in mustard. Delay in planting resulting in high temperature during flowering caused pod abortion and lower yield in rapeseed (McGregor 1981). Delay in sowing shortens vegetative phase, advances flowering time and reduce dry matter accumulation (Thurling and Das 1980). High temperature and long photoperiods are also detrimental for siliquae and seed development of mustard (Munshi and Kumari 1994).
Growing Indian mustard under late sown condition in northern belt is getting importance under multiple cropping system. Hence, there is need to screen mustard genotypes that can yield better under late sown condition and how does high temperature exposure at terminal stage affects the total performance including biomass production, seed yield and other related traits of mustard cultivars was the main objective of the investigation.
MATERIALS AND METHODS
to expose the seed development stage of mustard genotypes to high temperature condition in randomized block design with three replications at Oilseed Research Farm, Kalyanpur of the C.S. Azad University of Agriculture & Technology, Kanpur. The plot size was 11.25 m2 (5.0mx2.25m). The average maximum and
minimum temperature during this stage was 23.7, 15.4 under normal and 30.0 and 21.9°C late sown conditions, respectively. The distance between rows and plant to plant within rows were kept at 45cm and 15cm respectively. A basal dose of 60 kg N, 40 kg P2O5 and 40 kg K2O per ha was applied in the form of urea, DAP and Muriate of Potash, respectively. The remaining 60 kg N/ha was top dressed after 35 days of sowing. Two irrigations (5 ha. cm) were given on 28 November, 23 December 2005 under normal and 25 December 2005 and 20 January 2006 late sown conditions, respectively. At maturity, three plants were harvested randomly for recording yield and yield attributes. Branches per plant and siliquae from different branches were separated, threshed and the seeds were cleaned and weighed. The harvest index was calculated using the formula of Donald and Hambline (1976). Heat susceptibility index (S) was calculated for seed yield as Fisher and Maurer (1978).
S = (1-Y/Yp) / (1-X/Xp)
Where Y = mean seed weight of a genotype in a stress environment (D2), Yp = mean seed weight of a genotype in a stress free environment (D1), X = mean Y of all genotype, Xp = mean Yp of all genotypes. S is the relative heat stress tolerance (S < 0.5 stress tolerant, S>0.5 - 1.0 moderately stress tolerant and S > 1.0 susceptible). Yield stability ratio (YS) was calculated by taking the ratio of seed yield under D2 (late) and D1 (normal) conditions as per Lewis (1954).
YS = (Seed yield under D2 / Seed yield under D1)x100
RESULTS AND DISCUSSION
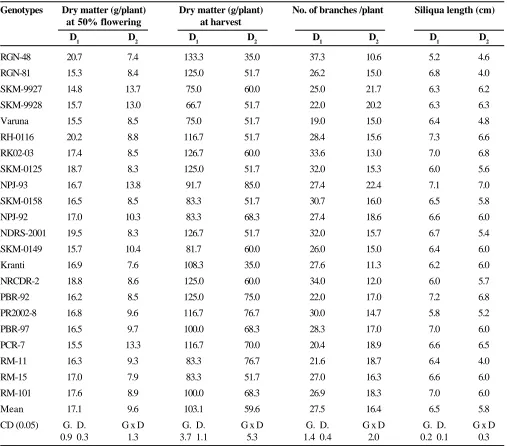
Significant reduction in dry matter accumulation at different stages, number of branches and siliqua length were recorded under late sown (D2) compared to normal sown (D1) sown plants (Table 1). Maximum reduction in dry matter production at 50% flowering, harvest stage and number of branches occurred in RGN-48 to the tune
of 64.3, 73.7 and 71.6%, respectively while minimum reduction in these characters were recorded in SKM-9927 (7.4%), NPJ-93 (7.3%) and in SKM-9928 (8.2%) under late sown over normal sown plants. This may be because of an increasing proportion of available solar radiation is not intercepted by the reduced crop canopy (reduced green area) due to late sowing. Results of the present study are in agreement with the earlier findings of Panda et al. (2004) in mustard.
Among different mustard genotypes dry matter production per plant at 50% flowering and at harvest, ranged between 14.8 (SKM-9927) to 20.7g (RGN-48) and 66.7 (SKM-9928) to 133.3g (RGN-48) respectively. Likewise number of branches and siliqua length ranged from 19.0 (Varuna) to 37.3 48) and 5.2 (RGN-48) to 7.3cm (RH-0116), respectively under D1 condition. Under D2 condition genotypic variation in above recorded characters varied between 7.4 (RGN-48) to 13.8g (NPJ-93), 35.0 (RGN-48, Kranti) to 85.0g (NPJ-(NPJ-93), 10.6 (RGN-48) to 22.4 (NPJ-93) and 4.0 (RGN-81, RM-11) to 7.0 cm (NPJ-93) respectively (Table 1). The significant variations in these characters were obviously due to their genetic potential and the environmental response under normal and late sown conditions.
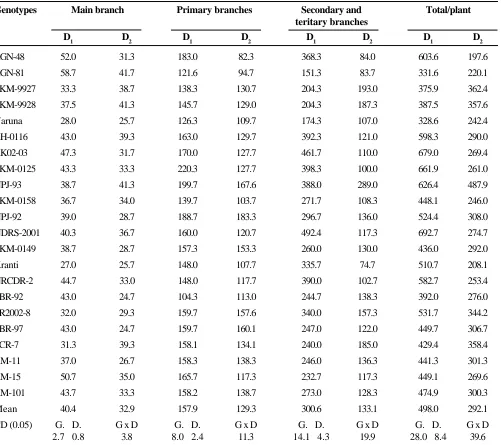
Amongst the mustard genotypes number of siliquae borne on main branch, primary branches, secondary and tertiary branches and total per plant ranged between 27.0 (Kranti) to 58.7 (RGN-81), 104.3 (PBR-92) to 220.3 (SKM-0125), 151.3 (RGN-81) to 492.4 (NDRS-2001) and 328.6 (Varuna) to 692.7 (NDRS-2001) respectively under D1 condition (Table 2). The number of siliquae on different branches stated above among different genotypes varied between 24.7 (PBR-97) to 41.7 (RGN-81), 82.3 (RGN-48) to 183.3 (NPJ-92), 74.7 (Kranti) to 289.0 (NPJ-93) and 197.6 (RGN-48) to 487.9 (NPJ-93) respectively under D2 condition. Genotypic variations in siliquae production were also observed earlier among mustard genotypes (Kurmi 2002).
Table 1. Dry matter accumulation, number of branches and siliqua length among mustard genotypes under normal (D1) and late (D2) sown conditions.
Genotypes Dry matter (g/plant) Dry matter (g/plant) No. of branches /plant Siliqua length (cm)
at 50% flowering at harvest
D1 D2 D1 D2 D1 D2 D1 D2
RGN-48 20.7 7.4 133.3 35.0 37.3 10.6 5.2 4.6
RGN-81 15.3 8.4 125.0 51.7 26.2 15.0 6.8 4.0
SKM-9927 14.8 13.7 75.0 60.0 25.0 21.7 6.3 6.2
SKM-9928 15.7 13.0 66.7 51.7 22.0 20.2 6.3 6.3
Varuna 15.5 8.5 75.0 51.7 19.0 15.0 6.4 4.8
RH-0116 20.2 8.8 116.7 51.7 28.4 15.6 7.3 6.6
RK02-03 17.4 8.5 126.7 60.0 33.6 13.0 7.0 6.8
SKM-0125 18.7 8.3 125.0 51.7 32.0 15.3 6.0 5.6
NPJ-93 16.7 13.8 91.7 85.0 27.4 22.4 7.1 7.0
SKM-0158 16.5 8.5 83.3 51.7 30.7 16.0 6.5 5.8
NPJ-92 17.0 10.3 83.3 68.3 27.4 18.6 6.6 6.0
NDRS-2001 19.5 8.3 126.7 51.7 32.0 15.7 6.7 5.4
SKM-0149 15.7 10.4 81.7 60.0 26.0 15.0 6.4 6.0
Kranti 16.9 7.6 108.3 35.0 27.6 11.3 6.2 6.0
NRCDR-2 18.8 8.6 125.0 60.0 34.0 12.0 6.0 5.7
PBR-92 16.2 8.5 125.0 75.0 22.0 17.0 7.2 6.8
PR2002-8 16.8 9.6 116.7 76.7 30.0 14.7 5.8 5.2
PBR-97 16.5 9.7 100.0 68.3 28.3 17.0 7.0 6.0
PCR-7 15.5 13.3 116.7 70.0 20.4 18.9 6.6 6.5
RM-11 16.3 9.3 83.3 76.7 21.6 18.7 6.4 4.0
RM-15 17.0 7.9 83.3 51.7 27.0 16.3 6.6 6.0
RM-101 17.6 8.9 100.0 68.3 26.9 18.3 7.0 6.0
Mean 17.1 9.6 103.1 59.6 27.5 16.4 6.5 5.8
CD (0.05) G. D. G x D G. D. G x D G. D. G x D G. D. G x D
0.9 0.3 1.3 3.7 1.1 5.3 1.4 0.4 2.0 0.2 0.1 0.3
between 5.5 (SKM-9927) to 77.7% (Kranti) while on per plant basis reduction varied between 3.6 (SKM-9927) to 67.3% (RGN-48). Maximum per cent reduction in siliquae number on main branch was observed in PBR-92 and PBR-97 (42.6%), while the RGN-48 showed the highest reduction (55.1%) in siliquae number on primary branches. Interestingly PBR-92 and PBR-97 did not show any reduction in siliquae number on the primary branches. The reduction in siliquae production may be due to floral stertility
caused due to high temperature exposure as this was indicated in B. napus by Morrison and Stewert (2002).
Table 2. Number of siliquae on different branches and total per plant among mustard genotypes under normal (D1) and late (D2) sown conditions.
Genotypes Main branch Primary branches Secondary and Total/plant
teritary branches
D1 D2 D1 D2 D1 D2 D1 D2
RGN-48 52.0 31.3 183.0 82.3 368.3 84.0 603.6 197.6
RGN-81 58.7 41.7 121.6 94.7 151.3 83.7 331.6 220.1
SKM-9927 33.3 38.7 138.3 130.7 204.3 193.0 375.9 362.4
SKM-9928 37.5 41.3 145.7 129.0 204.3 187.3 387.5 357.6
Varuna 28.0 25.7 126.3 109.7 174.3 107.0 328.6 242.4
RH-0116 43.0 39.3 163.0 129.7 392.3 121.0 598.3 290.0
RK02-03 47.3 31.7 170.0 127.7 461.7 110.0 679.0 269.4
SKM-0125 43.3 33.3 220.3 127.7 398.3 100.0 661.9 261.0
NPJ-93 38.7 41.3 199.7 167.6 388.0 289.0 626.4 487.9
SKM-0158 36.7 34.0 139.7 103.7 271.7 108.3 448.1 246.0
NPJ-92 39.0 28.7 188.7 183.3 296.7 136.0 524.4 308.0
NDRS-2001 40.3 36.7 160.0 120.7 492.4 117.3 692.7 274.7
SKM-0149 38.7 28.7 157.3 153.3 260.0 130.0 436.0 292.0
Kranti 27.0 25.7 148.0 107.7 335.7 74.7 510.7 208.1
NRCDR-2 44.7 33.0 148.0 117.7 390.0 102.7 582.7 253.4
PBR-92 43.0 24.7 104.3 113.0 244.7 138.3 392.0 276.0
PR2002-8 32.0 29.3 159.7 157.6 340.0 157.3 531.7 344.2
PBR-97 43.0 24.7 159.7 160.1 247.0 122.0 449.7 306.7
PCR-7 31.3 39.3 158.1 134.1 240.0 185.0 429.4 358.4
RM-11 37.0 26.7 158.3 138.3 246.0 136.3 441.3 301.3
RM-15 50.7 35.0 165.7 117.3 232.7 117.3 449.1 269.6
RM-101 43.7 33.3 158.2 138.7 273.0 128.3 474.9 300.3
Mean 40.4 32.9 157.9 129.3 300.6 133.1 498.0 292.1
CD (0.05) G. D. G x D G. D. G x D G. D. G x D G. D. G x D
2.7 0.8 3.8 8.0 2.4 11.3 14.1 4.3 19.9 28.0 8.4 39.6
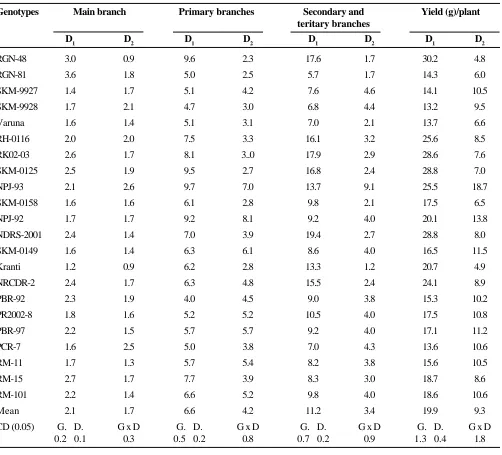
recorded in RGN-48, Kranti, SKM-0125, RK-02-03 and NDRS-2001 while minimum (less than 30%) was recorded in SKM-9927, SKM-9928, NPJ-93 and PCR-7 under high temperature experienced at terminal stage in late sown as compared to normal sown plants (Table 3). Earlier reports of Singh et al. (2001) and Srivastava and Balkrishna (2003) support finding of present study.
Table 3. Seed yield (g) of different branches and total seed weight per plant among mustard genotypes grown under normal (D1) and late (D2) sown conditions.
Genotypes Main branch Primary branches Secondary and Yield (g)/plant
teritary branches
D1 D2 D1 D2 D1 D2 D1 D2
RGN-48 3.0 0.9 9.6 2.3 17.6 1.7 30.2 4.8
RGN-81 3.6 1.8 5.0 2.5 5.7 1.7 14.3 6.0
SKM-9927 1.4 1.7 5.1 4.2 7.6 4.6 14.1 10.5
SKM-9928 1.7 2.1 4.7 3.0 6.8 4.4 13.2 9.5
Varuna 1.6 1.4 5.1 3.1 7.0 2.1 13.7 6.6
RH-0116 2.0 2.0 7.5 3.3 16.1 3.2 25.6 8.5
RK02-03 2.6 1.7 8.1 3..0 17.9 2.9 28.6 7.6
SKM-0125 2.5 1.9 9.5 2.7 16.8 2.4 28.8 7.0
NPJ-93 2.1 2.6 9.7 7.0 13.7 9.1 25.5 18.7
SKM-0158 1.6 1.6 6.1 2.8 9.8 2.1 17.5 6.5
NPJ-92 1.7 1.7 9.2 8.1 9.2 4.0 20.1 13.8
NDRS-2001 2.4 1.4 7.0 3.9 19.4 2.7 28.8 8.0
SKM-0149 1.6 1.4 6.3 6.1 8.6 4.0 16.5 11.5
Kranti 1.2 0.9 6.2 2.8 13.3 1.2 20.7 4.9
NRCDR-2 2.4 1.7 6.3 4.8 15.5 2.4 24.1 8.9
PBR-92 2.3 1.9 4.0 4.5 9.0 3.8 15.3 10.2
PR2002-8 1.8 1.6 5.2 5.2 10.5 4.0 17.5 10.8
PBR-97 2.2 1.5 5.7 5.7 9.2 4.0 17.1 11.2
PCR-7 1.6 2.5 5.0 3.8 7.0 4.3 13.6 10.6
RM-11 1.7 1.3 5.7 5.4 8.2 3.8 15.6 10.5
RM-15 2.7 1.7 7.7 3.9 8.3 3.0 18.7 8.6
RM-101 2.2 1.4 6.6 5.2 9.8 4.0 18.6 10.6
Mean 2.1 1.7 6.6 4.2 11.2 3.4 19.9 9.3
CD (0.05) G. D. G x D G. D. G x D G. D. G x D G. D. G x D
0.2 0.1 0.3 0.5 0.2 0.8 0.7 0.2 0.9 1.3 0.4 1.8
(RGN-48) to 7.0g (NPJ-93), 1.2 (Kranti) to 9.1g (NPJ-93) and 4.0 (RGN-48, Kranti) to 18.7g (NPJ-93), respectively (Table 3). Genotypic differences in seed yield were also reported among mustard genotypes (Kurmi 2002).
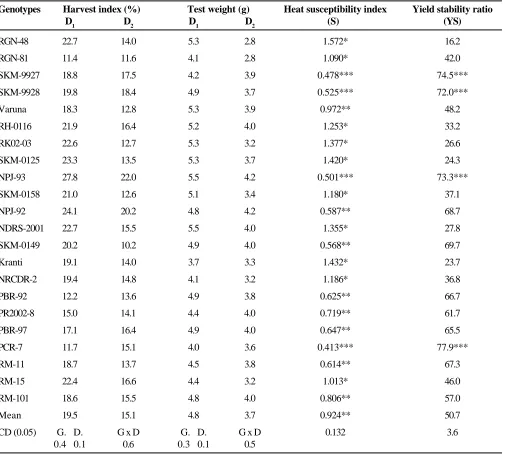
In general, significant reduction in harvest index (HI) and test weight occurred irrespective of genotypes under D2 over D1 condition (Table 4). Amongst the mustard
Table 4. Harvest index, test weight, heat susceptibility index and yield stability ratio among mustard genotypes under normal (D1) and late (D2) sown conditions.
Genotypes Harvest index (%) Test weight (g) Heat susceptibility index Yield stability ratio
D1 D2 D1 D2 (S) (YS)
RGN-48 22.7 14.0 5.3 2.8 1.572* 16.2
RGN-81 11.4 11.6 4.1 2.8 1.090* 42.0
SKM-9927 18.8 17.5 4.2 3.9 0.478*** 74.5***
SKM-9928 19.8 18.4 4.9 3.7 0.525*** 72.0***
Varuna 18.3 12.8 5.3 3.9 0.972** 48.2
RH-0116 21.9 16.4 5.2 4.0 1.253* 33.2
RK02-03 22.6 12.7 5.3 3.2 1.377* 26.6
SKM-0125 23.3 13.5 5.3 3.7 1.420* 24.3
NPJ-93 27.8 22.0 5.5 4.2 0.501*** 73.3***
SKM-0158 21.0 12.6 5.1 3.4 1.180* 37.1
NPJ-92 24.1 20.2 4.8 4.2 0.587** 68.7
NDRS-2001 22.7 15.5 5.5 4.0 1.355* 27.8
SKM-0149 20.2 10.2 4.9 4.0 0.568** 69.7
Kranti 19.1 14.0 3.7 3.3 1.432* 23.7
NRCDR-2 19.4 14.8 4.1 3.2 1.186* 36.8
PBR-92 12.2 13.6 4.9 3.8 0.625** 66.7
PR2002-8 15.0 14.1 4.4 4.0 0.719** 61.7
PBR-97 17.1 16.4 4.9 4.0 0.647** 65.5
PCR-7 11.7 15.1 4.0 3.6 0.413*** 77.9***
RM-11 18.7 13.7 4.5 3.8 0.614** 67.3
RM-15 22.4 16.6 4.4 3.2 1.013* 46.0
RM-101 18.6 15.5 4.8 4.0 0.806** 57.0
Mean 19.5 15.1 4.8 3.7 0.924** 50.7
CD (0.05) G. D. G x D G. D. G x D 0.132 3.6
0.4 0.1 0.6 0.3 0.1 0.5
* Temperature sensitive genotypes having high (S) low (YS) ** Moderately temperature tolerant *** Temperature tolerant genotypes having low (S) high (YS)
Heat susceptibility index (S) and yield stability ratio (YS) among different mustard genotypes ranged from 0.413 (PCR-7) to 1.572 (RGN-48) and 16.2 (RGN-48) to 77.9% (PCR-7) respectively (Table 4). Genotypes SKM-9927, SKM-9928, NPJ-93 and PCR-7 showed their high temperature tolerance at terminal stage as
these genotypes showed value of heat susceptibility index < 0.5 and yield stability ratio >70.0%.
Babu, L.C. (1985). Physiological analysis of growth and development with reference to planting date in rapeseed-mustard. Ph.D. Thesis, Indian Agricultural Research Institute, New Delhi.
Chauhan, Y.S. and Singh, D. (1980). Inheritance of seed weight in Indian mustard (Brasica juncea L.). Indian J. Genet.
& Pl. Breed. 40: 597.
Donald, C.M. and Hambline, J. (1976). Biological yield and harvest index of cereals as agronomic and plant breeding criteria. Advan. Agron. 28: 361-405.
Fischer, R.A. and Maurer, R. (1978). Drought resistance in spring wheat cultivars. I. Grain yield response. Aust. J.
Agric. Res. 29: 897-907.
Guilioni, I. Wery, J. and Tardieu, F. (1997). Heat stress induced abortion of buds and flowers in pea. Is sensitivity linked to organ age or in relation between reproductive organs.
Ann. Bot. 80: 159-168.
Kurmi, K. (2002). Influence of sowing date on the performance of rapeseed and mustard varieties under rainfed situation of southern Assam. J. Oilseeds Res. 19: 197-198.
Lewis, E.B. (1954). Gene-environment interaction. Heridity. 8: 333-356.
McGregor, D.I. (1981). Pattern of flower and pod development in rapeseed. Can. J. Plant Sci. 61: 275-282.
Morrison, M.J. and Stewart, D.W. (2002). Heat stress during flowering in summer Brassica. Crop Sci. 42: 797-803.
Munshi, S.K. and Kumari, A. (1994). Physiological characteristics of siliquae and lipid composition of seeds located at different position in mature mustard inflorescence. J. Sci. Food Agric. 64: 289-293.
Panda, B.B., Shivay, Y.S. and Bandyopadhyay, S.K. (2004). Growth and development of Indian Mustard (Brassica
juncea) under different levels of irrigation and dates of
sowing. Indian J. Plant Physiol. 9: 419-425.
Saini, H.S. Sedgley, M. and Aspinall, D. (1983). Effect of heat stress during floral development on pollen tube growth and ovary anatomy. Aust. J. Plant physiol. 11: 243-253.
Singh, Raj, Patidar, M. and Singh, B. (2001). Response of Indian mustard (Brassica juncea) cultivars to different sowing time. Indian J. Agron. 46: 292-295.
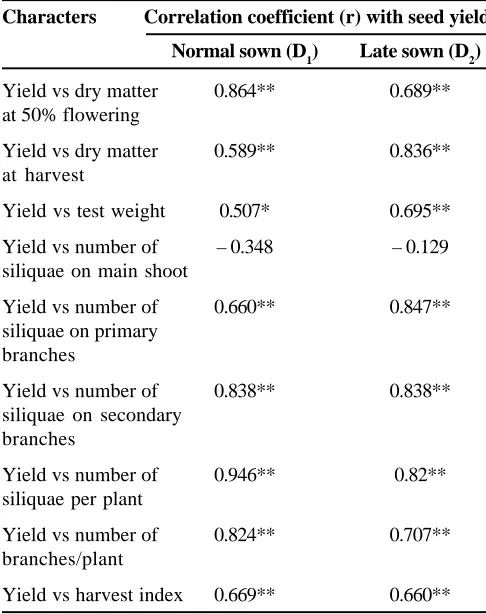
(r=0.847) under D2 condition while dry matter production at 50% flowering (r=0.864), number of siliquae per plant (r=0.946) and number of branches per plant (r=0.824) showed positive association with seed yield under D1 condition. HI and number of siliquae borne on secondary branches exhibited positive while number of siliquae on main branch showed negative association with seed yield under both the conditions. Our results are more close to Chauhan and Singh (1980).
REFERENCES
Ahmed, F.F. and Hall, A.F. (1993). Heat injury during early floral bud development in cowpea. Crop Sci. 33: 761-767.
Table 5. Relationship between seed yield and following characters in mustard sown under normal (D1) and late (D2) sown conditions.
Characters Correlation coefficient (r) with seed yield
Normal sown (D1) Late sown (D2)
Yield vs dry matter 0.864** 0.689** at 50% flowering
Yield vs dry matter 0.589** 0.836** at harvest
Yield vs test weight 0.507* 0.695**
Yield vs number of – 0.348 – 0.129 siliquae on main shoot
Yield vs number of 0.660** 0.847** siliquae on primary
branches
Yield vs number of 0.838** 0.838** siliquae on secondary
branches
Yield vs number of 0.946** 0.82** siliquae per plant
Yield vs number of 0.824** 0.707** branches/plant
Yield vs harvest index 0.669** 0.660**
Singh, Raj, Rao, V.U.M. Singh, D. and Kant, S. (2002). Effect of sowing date and plant density on phenological behaviour, yield and its attributes in oilseed brassicae.
J. Oilseeds Res. 19: 119-121.
Srivastava, J.P. and Balkrishna (2003). Environmental parameters influencing phenological development of
mustard in relation to yield. Indian J. Plant Physiol. 8: 349-353.