Lincoln
University
Digital
Thesis
Copyright
Statement
The
digital
copy
of
this
thesis
is
protected
by
the
Copyright
Act
1994
(New
Zealand).
This
thesis
may
be
consulted
by
you,
provided
you
comply
with
the
provisions
of
the
Act
and
the
following
conditions
of
use:
you
will
use
the
copy
only
for
the
purposes
of
research
or
private
study
you
will
recognise
the
author's
right
to
be
identified
as
the
author
of
the
thesis
and
due
acknowledgement
will
be
made
to
the
author
where
appropriate
you
will
obtain
the
author's
permission
before
publishing
any
material
from
the
thesis.
DIFFERENT CROPPING SYSTEMS
A thesis
submitted in partial fulfilment
of the requiranents for the degree
of
Doctor of Philosophy
in the
University of Canterbury
by
R
J
Gibbs
accept them as unalterable facts. They then become labelled as 'conceptual necessities', 'a priori situations', etc. The road of
scientific progress is frequently blocked for long periods by such
errors. It is therefore not just an idle game to exercise our ability
to analyse familiar concepts, and to demonstrate the conditions on which their justification and usefulness depend, and the way in which these
developed, little by little, from the data of experience."
the requirements for the degree of Doctor of Philosophy
CHANGES IN SOIL STRUCTURE UNDER DIFFERENT CROPPING SYSTEMS
by
R J Gibbs
Despite a large number of experimental investigations, it remains
difficult to predict, or even interpret, changes in soil structure under
different cropping systems. The principal objective of this
investigation was to devise and test a conceptual model which could
provide a framework for the design and interpretation of experiments
concerning the effects of cropping systems on soil structure. The model
concentrates on processes that change E100 (the volume of pores> 100 ~m
in effective diameter per unit volume rif total soil). The processes
identified are tillage, slaking and slumping, earthworm activity as well
as root growth and decomposition.
A glasshouse experiment demonstrated that root growth and
d:~omposition could significantly change E
100 and soil transmission
properties, but attempts to mathematically model these changes were
unsuccessful. In addition, the presence of living roots of wheat and
perennial ryegrass both helped to maintain pore stability, as indicated
by the way in which saturated hydraulic conductivity changed with time.
New Zealand to provide sufficient data to apply the conceptual model in
the form of a budget equation for the 5-15 cm soil depth. In one
experiment, perennial ryegrass and winter wheat were managed identically
within two cultivation systems (conventional cultivation and
direct-drilling) on a silt loam initially in long. term pasture. Many of the
soil measurements indicated a deterioration in soil structure over the
two years of the experiment, regardless of treatment. There was little
indication of differences between the effects of winter wheat or
perennial ryegrass on soil structure. Nevertheless, as in the
glasshouse experiment, the presence of living roots helped to arrest the
•
decline in soil structure.
In another field experiment using rhizotrons, it was found that an
instantaneous measurement of the maximum amount of root material present
in the soil could underestimate the real amount returned over one season
by as much as 60% of the harvested root dry weight. Visual observations
indicated a half-life of 254 days for perennial ryegrass root
decomposition under Canterbury conditions.
Analysis of the field experiment results using the conceptual
model suggested that tillage and slumping were primarily responsible for
changes in E
100' whereas the actions of roots and earthworms themselves
were insufficient for causing appreciable short-term increases in E 100.
Tillage appears the only practical way to achieve a rapid increase in
E
100• This increase may be best achieved if tillage is carried out when
a crop is established so that the effect of living roots on macropore
stability will be utilised to its fullest extent. Development and
application of the conceptual model has emphasised a major need for
ryegrass; cropping systems; root growth; root decomposition;
earthworms; slumping; infiltration; macroporosity; macropore
stability; hydraulic conductivity; aggregate stability;
CHAPTER
List of Tables List of Figures . List of Plates
List of Appendices
List of Symbols and Abbreviations
Declaration of Originality
Certif~cate of Supervision
1 INTRODUCTION 1.1 Background
1.2 A brief perspective of the measurement of soil
structure
2 CHANGES IN SOIL STRUCTURE UNDER DIFFERENT CROPPING
PAGE
i
iii
v
vi vii ix
x
1 1
3
SYSTEHS - A REVIEW 7
2.1 Introduction 7
2.2 Reported changes in soil structure 7
2.3 Reasons for changes in soil structure 21 2.4 The need for prediction of changes in soil structure 23
2.5 Conclusions 26
2.6 Statement of objectives 27
3 DEVELOPMENT OF A CONCEPTUAL HODEL OF CHANGES IN SOIL
STRUCTURE UNDER DIFFERENT CROPPING SYSTEHS 29
3.1 Introduction 29
3.2 General approach 31
3.3 Model assumptions 33
3.4 Model structure 33
3.4.1 Crop growth and death 35
3.4.2 Root effects on macroporosity 36
3.4.2.1 Living roots 36
3.4.2.2 Dead roots 39
3.4.3 Tillage 41
3.4.7 Macropore stability 3.5 General discussion
4 EFFECTS OF ROOT GROVTH AND DECOMPOSITION ON KACROPOROSITY AND RELATED FACTORS
4.1 Introduction
4.2 Materials and methods 4.2.1
4.2.2
4.2.3 4.2.4
Experimental plan
Soil
Crops and growing conditions
Sampling procedure
4.2.4.1 Porosity measurements
4.2.4.2 Saturated hydraulic conductivity
4.2.4.3 Wet-sieving analyses 4.2.4.4 Root analyses
4.2.5 Pore size distribution
4.3 Results and discussion 4.3.1 Root characteristics
4.3.2 Soil characteristics
4.3.2.1 Macroporosity and hydraulic
conductivity
4.3.2.2 Mean weight diameter 4.4 General discussion
4.4.1 Root growth and decomposition 4.4.2 Predictive methods
4.4.2.1 Pore stability 4.4.2.2 Pore continuity
4.5 Summary and conclusions
5 FIELD STUDIES OF SOIL STRUCTURAL CHANGES UNDER VHEAT
49 52 57 57 57 57 59 61 62 ,64 64 65 66 67 68 68 70 70 72 74 74 75 80 83 85
AND RYEGRASS I. AGRONOMIC ASPECTS OF THE EXPERIMENT 88
5.1 Introduction 88
5.2 Materials and methods 90
5.2.1 Soil requirements and site characteristics 90 5.2.2 Site preparation and experimental design 93
5.2.3 Treatments 94
5.2.4 Transition between seasons 96
5.2.6.2 Interception of photosynthetically active radiation
5.2.6.3 Root growth
5.2.6.4 Root diameter measurement
5.2.7 Statistical analysis 5.3 Results and discussion
5.3.1 Shoot growth
5.3.1.1 Plant establishment
5.3.1.2 Yield and yield components
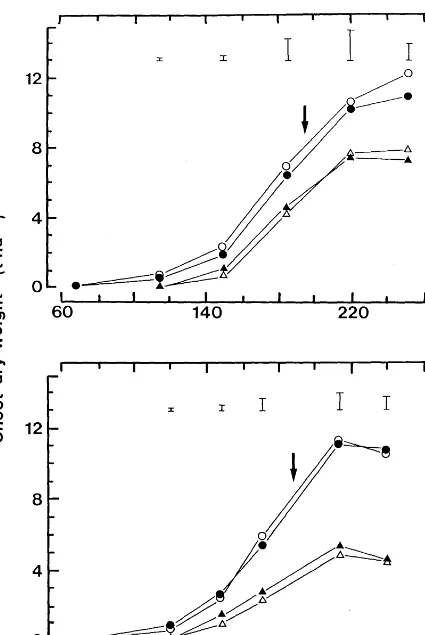
5.3.1.3 Total above-ground dry matter production 98
99
103 103 103 104 104 104 1045.3.1.4 Crop canopy development 107
5.3.2 Root growth 109
5.3.2.1 Calibration of the root measurement techniques
5.3.2.2 Total root production
5.3.2.3 Rooting depth
5.3.2.4 Root diameters
110 113 116 118
5.4 General discussion 120
5.4.1 Validity of the root measurement techniques 120
5.4.2 Total root production 122
5.4.3 Rooting depth and root distribution
5.4.4 Yields of winter wheat
127 129
5.5 Summary and conclusions 132
6 FIELD STUDIES OF SOIL STRUCTURAL CHANGES UNDER WEAT
AND RYEGRASS II. ROOT DEHOGRAPHY 135
6.1 Introduction 135
6.2 Materials and methods 136
6.2.1 Rhizotron construction and installation 136
6.2.2 Root growth and death 138
6.2.3 Root decomposition 139
6.3 Results 140
6.3.1 Instantaneous and cumulative living root lengths 140
6.3.2 Individual root longevity 140
6.3.3 Root decomposition rate
6.4 Discussion
6.5 Summary and conclusions
142 145
7.1 Introduction
7.2 Materials and methods
7.2.1 Sampling procedure
7.2.1.1 Infiltration rate
7.2.1.2 Air permeability 7.2.1.3 Soil cores
7.2.1.4 Yet-sieving analyses 7.2.2 Estimation of earthworm population
7.2.3 Grass reference area 7.2.4 Statistical analysis
7.3 Results and discussion
7.3.1 Infiltration rate and air permeability
7.3.2 Soil water content
7.3.3 Soil dry bulk density and total porosity
7.3.4 Macroporosity and saturated hydraulic conductivity 150 151 151 151 153 154 158 158 158 159 159 160 163 165 168
7.3.5 Earthworm channelling 170
7.3.6 Earthworm population 172
7.3.7 Mean weight diameter of wet-sieved aggregates 174 7.4 General discussion
7.4.1 Effects of cultivation 7.4.2 Effects of crop
7.4.3 Significance of macroporosity 7.5 Summary and conclusions
8 FIELD STUDIES OF SOIL STRUCTURAL CHANGES UNDER VHEAT
AND RYEGRASS IV. INTERPRETATION OF RESULTS USING
CONCEPTUAL HODEL
8.1 Introduction 8.2 Methods
8.2.1 8.2.2 8.2.3 8.2.4 8.2.5 8.2.6
General approach Net change in E
100 Changes in E
100 due to root decomposition 8.2.3.1 Original pasture roots
8.2.3.2 Yheat and ryegrass roots
Decrease in E
100 due to root growth Change in E
100 due to earthworm channelling Statistical analysis
8.3.2 Fallow period 206
8.3.3 Second season 208
8.4 Discussion 210
8.5 Summary and conclusions 217
9 GENERAL SUHKARYAND CONCLUSIONS 220
Suggestions for future work 229
ACKNOVLEDGEHENTS 232
LITERATURE CITED 234
LIST OF TABLES
TABLE TITLE
2.1 Differences in soil structural and related parameters under various temperate crops and management
4.1 Some physical and chemical properties of the Wakanui silt
PAGE
8
loam (5-15 cm soil depth) used in this study 60
4.2 Results of root measurements made on ryegrass and wheat plants grown in soil cores
4.3 Effect of different treatments on macroporosity and saturated hydraulic conductivity.
4.4 Effect of different treatments on the mean weight diameter of soil wet-sieved under fresh, tension-wet
and immersion-wet conditions
4.5 Comparison of observed and predicted saturated hydraulic conductivities
4.6 Effect of different treatments on the ratio of steady-state to initial saturated hydraulic conductivity
69
71
73
79
82
5.1 Details of agronomic practice 95
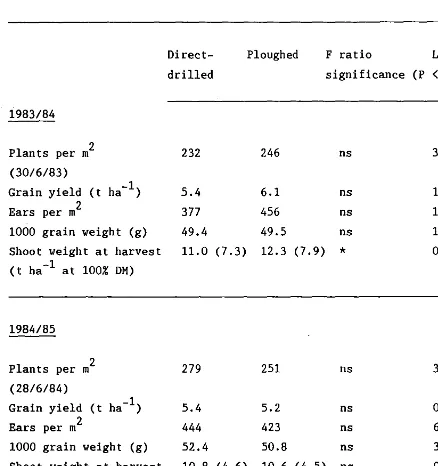
5.2 Plant populations, grain yields and yield components of
winter wheat in 1983/84 and 1984/85 105
5.3 Root diameters of winter wheat and perennial ryegrass 119
5.4 Maximum measured root length and ash-free root dry weight per unit area of ground surface of winter wheat and
perennial ryegrass in 1983/84 and 1984/85
5.5 A comparison of root growth measurements of winter wheat
124
6.1 Estimates of the longevity of winter wheat and perennial ryegrass roots
6.2 Estimated total returns of root organic matter (as ash-free root dry weight) from winter wheat and perennial
143
ryegrass in 1983/84 and 1984/85 148
7.1 Effect of different cropping systems on earthworm
populations after 16 months
7.2 Changes in saturated hydraulic conductivity, number of
earthworm channels per m2 and macroporosity with soil depth
8.1 Estimated changes in E100 in the 5-15 cm soil depth during the first season
8.2 Estimated changes in E100 in the 5-15 cm soil depth during the fallow period
8.3 Estimated changes in E100 in the 5-15 cm soil depth during the second season
173
192
204
207
FIGURE
3.1
4.1
4.2
4.3
5.1
LIST OF FIGURES
TITLE
Conceptual model of changes in soil structure under
different cropping systems
Summary of glasshouse experimental plan
Pore size distribution of a Wakanui silt loam
Cumulative infiltration into the soil cores
Soil textural variability of a Wakanui silt loam
5.2 Weekly totals of rainfall and Penman potential evaporation at Lincoln College from May 1983 to
January 1985
5.3 Total above-ground dry matter yields of winter wheat and perennial ryegrass
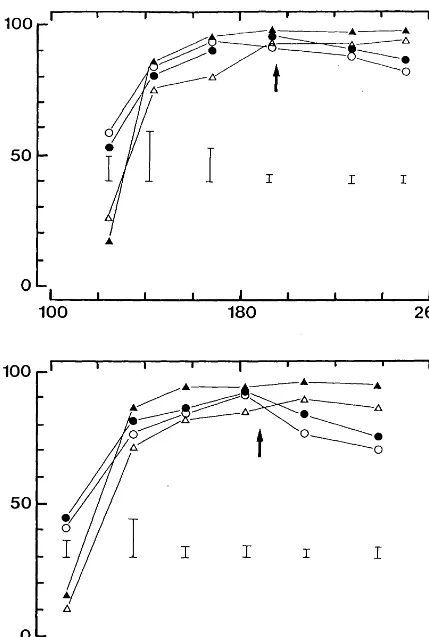
5.4 Interception of photosynthetically active radiation
by winter wheat and perennial ryegrass
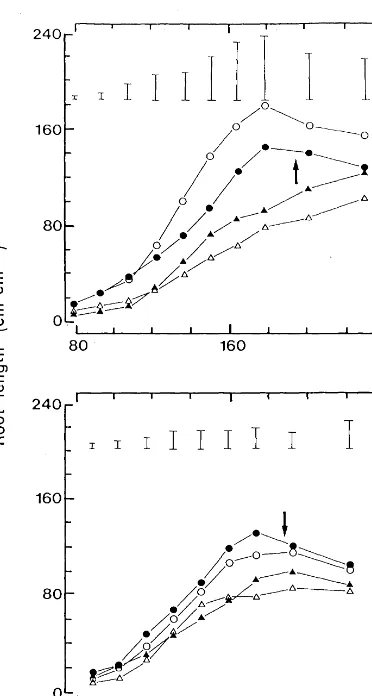
5.5 Total root lengths per unit area of ground surface
of winter wheat and perennial ryegrass
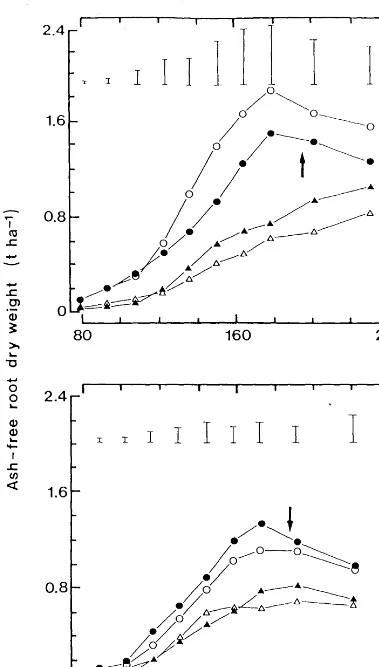
5.6 Total ash-free root dry weight per unit area of
PAGE
34
58
77
81
92
97
106
108
114
ground surface of winter wheat and perennial ryegrass 115
5.7 Maximum rooting depths of winter wheat and perennial ryegrass
5.8 Distribution of root length of winter wheat and
perennial ryegrass for 1983/84 and 1984/85 at the time
of maximum root input
117
5.9 Distribution of ash-free root dry weight of winter wheat and perennial ryegrass for 1983/84 and 1984/85
at the time of maximum root input
6.1 Comparison of instantaneous and cumulative living root 131
lengths of winter wheat and perennial ryegrass 141
6.2 Rate of decomposition of perennial ryegrass roots in
the 0-10 cm soil depth of a ~akanui silt loam 144
7.1 Schematic diagram of apparatus used to measure
saturated hydraulic conductivity 157
7.2 Changes in the steady-state infiltration rate and
air permeability after infiltration over two seasons 161
7.3 Changes in soil water content in the 5-15 cm soil depth over two seasons
7.4 Changes in soil dry bulk density and total porosity in the 5-15 cm soil depth over two seasons
164
166
7.5 Changes in macroporosity and saturated hydraulic
conductivity in the 5-15 cm soil depth over two seasons 169
7.6 Changes in the number of earthworm channels (> 1-2 mm diameter) at 10 cm soil depth over two seasons
7.7 Changes in the mean weight diameter of soil aggregates in the 5-15 cm soil depth over one season
7.8 Relationship between macroporosity and total porosity
in the 5-15 cm soil depth
7.9 Relationship between macroporosity and saturated
171
175
186
hydraulic conductivity in the 5-15 cm soil depth 188
7.10 Relationship between macroporosity and steady-state
LIST OF PLATES
PLATE TITLE PAGE
4.1 Layout of glasshouse experiment 63
6.1 Rhizotron pit before insertion of glass panel 137
LIST OF APPENDICES
APPENDIX TITLE PAGE
1 Particle size analysis of a Wakanui silt loam profile 262
2 . Estimations of permanent wilting point and field
capacity soil water contents and soil dry bulk density of the Wakanui silt loam used in this study
3
4
5
6
MAF soil quick tests for the experimental site
(0-15 cm soil depth)
Layout of the field experiment
Cumulative infiltration against time for four individual plots (31/5/83)
Soil water content before and 24 hours after infiltration on two plots on 29/1/85
263
264
265
266
LIST OF SYMBOLS AND ABBREVIATIONS
Some of the units in this thesis are not in SI units. Conversion factors to SI units are given where appropriate.
SYMBOL OR
ABBREVIATION
a. L
A Db D P DOF DOW DOR E 100 E o EC fsl F r GAl GRA g Ld. IR DEFINITION
active ingredient
cross-sectional area (cm2) -3 soil dry bulk density (g cm )
-3 soil particle density (g cm )
direct-drilled fallow treatment
direct-drilled wheat treatment
direct-drilled ryegrass treatment
pores
>
100 ~m in diameter 3 -3(cm cm )
. 3 -3)
total poroslty (cm cm actual evapotranspiration (mm d-1 )
potential evapotranspiration
-1
(mm d )
change in E
100 due to earthworm channelling (%)
fine sandy loam
root fresh weight (mg cm-3)
. d (2 -2) green area ln ex m m
grass reference area
. . 1 ( - 2 )
gravltatlona constant cm s
inside diameter (mm)
steady-state infiltration rate (cm h- 1)
saturated hydraulic conductivity (cm h-1 )
1 1
1
1
CONVERSION TO
SI UNITS
2
5 10-4 m2
em
g em -3 5 103 kg m
g em -3 5 103 kg m
3 -3 1 3 em em 5 m m
3 -3 3 -3
-3
-3
-3 1 em cm 5 1 m m
1 mm d-1 5
1.2 x 10⁻⁸ m s -1 -1
1 mm d 5
1.2 x 10 -8 m s -1
-3 -3
1 mg cm
= 1
kg m1 em s-2 5 10-2
-3 1 mm 5 10 m 1 em h- 1 5
-6 -1 2.8 x 10 m s
-1
1 em h 5
-6 -1 2.8 x 10 m s
-2
m s
K
air air permeability (m 2
)
1 length (m)
Is loamy sand
-2 -2
root length per unit area (em em ) 1 em em
. d . ( - 3 ) 1 -3
rootlng enslty em em em em least significant difference
5 102 m m- 2
MS macropore stability
MWD mean weight diameter (mm) 1 mm 51! 10-3 m
N number of exposed living roots cm-2
o.d. outside diameter (mm) 1 mm
=
10-3 mP pressure difference (N m-2)
PAR photosynthetically active radiation
PPFD photosynthetic photon flux density -2 -1
(m mole m s )
PF ploughed fallow treatment
PW ploughed wheat treatment
PR
r
ploughed ryegrass treatment radius (cm)
change in E
100 due to root
decomposition (%)
1 cm 51! 10-2 m
change in E
100 due to root growth
root length of whole sample (cm)
root length of dead subsample (cm)
root length of living subsample
(cm)
(%)
sl
SS
t
t 1
2" Ti V W r WSA z zl p y
length of dead root in whole
sample (cm)
sandy loam
change in E
100 due to slaking and
slumpling (%)
time (days) half-life (days)
change in E100 due to tillage (%)
flow rate (m3 s-l)
ash-free root dry weight
-3
(J,lg cm )
water-stable aggregates
number of root intersects in a 5 cm root tube increment
sil t loam
density of water (g cm-3)
coefficient of surface tension of
1 cm 51! 10-2 m
1 cm 51! 10-2 m
1 cm 51! 10-2 m
1 cm 51! 10-2 m
1 day 51! 86400 s
1 day 51! 86400 s
-3
1 J,lg cm -10-3 kg m-3
1 g cm -3
-2
water (g s ) 1 g s-2 51! 10-3 kg s-2
3 -3)
soil water content (cm cm
matric potential (cm)
-1 -1
viscosity (g cm s )
3 -3 3 - 3
1 cm cm 51! 1 m m
2 -2
1 cm 51! 10 N m
-1 -1
1 g cm s 51!
Lincoln College Canterbury
1~111~§ New Zealand
~ ---UNIVERSITy COLLEGE OF AGRICULTURE---
--~--Telephone: Christchurch 252 811
3rd January 1986
DECLARATION OF ORIGINALITY
This thesis reports the original work of the author except where
otherwise stated.
Lincoln College Canterbury
If1jil~~~I£'_____
New Zealand~ UNIVERSITY COLLEGE OF A G R I C U L T U R E -Telephone: Christchurch 252 811
3rd January 1986
CERTIFICATE OF SUPERVISION
R J Gibbs has conducted the work described in this thesis under
my immediate supervision.
Dr J B Reid
CHAPTER ONE
INTRODUCTION
1.1 BACKGROUND
Soil structure has been defined as "the physical constitution of a soil material as expressed by the size, shape and arrangement of solid particles and voids, including both the primary particles to form compound particles and the compound particles themselves" (Brewer, 1964). Marshall (1962) used a similar definition. To some workers the definition of soil structure has been primarily concerned with the shape and arrangement of individual soil particles into aggregates (Emerson, 1977), whilst to others it has been more associated with the soil pore size distribution (Russell, E.W., 1971). For the purpose of this
thesis, soil structure is broadly defined as the size and arrangement of soil particles and voids.
The structural condition of a soil is well known to be important for successful crop growth. Root growth, seedling emergence and
retention and transmission of air, water and nutrients are all affected by soil structure. There are two physical attributes which soil should possess to help crop growth remain successful:
2. Sufficient pores narrow enough to resist gravitational drainage but wide enough to release water to crop roots (Cary and Hayden, 1973; Russell, R.S., 1977; Greenland, 1981; Oades, 1984).
Most soils will only begin to possess the above physical
attributes when the primary particles of sand, silt and clay are bound into water-stable aggregates (Martin et aI, 1955). Factors which alter the stability and arrangement of soil aggregates are therefore very important.
It is unfortunate that many aspects of soil structure (e.g. ease of cultivation) are often assessed only qualitatively and their effects are difficult to evaluate in terms of crop yield (Cooke, 1967). Even in situations where crop yields seem clearly related to one particular soil structural measurement, the effect may be indirect (Marshall, 1962).
Nevertheless, many situations have existed where improved crop yields have been directly attributed to changes in the physical
condition of the soil (Page and Willard, 1946; Low, 1973; O'Sullivan and Ball, 1982; Braim et aI, 1984; Ide et aI, 1984). However, attempts to make direct correlations between crop yields and soil structural
measurements seem unconvincing (see for example, Baver and Farnsworth, 1940; Doyle and Hamlyn, 1960; Osborne et aI, 1978); it does not
necessarily follow that a large root system, attained because of favourable soil structure, will automatically produce a large crop yield. In many instances, restriction of root growth in poorly
structured soils can be compensated by the addition of extra fertilisers (Clement, 1961). Crop yields may be influenced by such a complex
difficult to attribute any of the differences in recorded yields to specific changes in soil properties (Ross and Hughes, 1985).
The effect of soil structure on crop growth is therefore not only very important, but also complicated. Despite what is already known about the subject, we still have a general inability to quantitatively describe the physical environment of the soil and to evaluate the relationships between plant roots and soil physical conditions (Greenland, 1977; Ehlers, 1984; Schafer, 1984). Moreover, in some situations, the structural condition of a soil may even be the most frequent limiting factor in crop production (Sequi, 1978; Cooke, 1979).
1.2 A BRIEF PERSPECTIVE OF THE MEASUREMENT OF SOIL STRUCTURE
The scope of soil structure definitions and the variety of ways in which it influences crop growth makes it difficult to decide how best to measure the structural condition of a soil. The importance of a given factor may vary from day to day and from season to season (Low, 1975) and this can complicate the choice of measurement technique. No single measurement or value can adequately describe all the physical properties of soil structure.
A common method of assessing soil structure has been to measure the percentage of soil that remains stable when sieved under water in a standardised way (Yoder, 1936; Low, 1954,1955; Pannabokke and Quirk, 1957; Greacen, 1958; Clement and Williams, 1958; Robinson and Jaques, 1958; Low et aI, 1963; Williams et aI, 1966; Kemper and Koch, 1966; Clarke et aI, 1967; Luk, 1979; Adem and Tisdall, 1984; Stengel et aI, 1984; Chaney and Swift, 1984). These sorts of laboratory measurements are inherently arbitrary due to the complex nature of aggregate
breakdown in the field (Douglas, 1977). Furthermore, the results obtained may depend critically upon the treatment of the aggregates before and during sieving (Allison, 1968; Russell, E.W., 1971; North, 1976; Douglas and Goss, 1982). Low (1954) illustrated the variations in results caused by different variants of the same basic wet-sieving
technique, and also by different individuals using the same technique.
The wet-sieving method measures aggregate stability, although many of its earlier advocates considered it to measure aggregation. Neither aggregate stability nor aggregation are synonymous with soil structure (Allison, 1973; Sequi, 1978), even though some authors have used the terms interchangeably (Andrew, 1965; Agricultural Advisory Council, 1970).
There are several other methods of measuring aggregate stability in water. Assessment has been attempted using visual observation
(Emerson, 1967), turbidimetry (Davidson and Evans, 1960; Williams et aI, 1966), water release curves or permeability tests from columns of
In recent y~ars there has been a move away from relying upon measurements of aggregate stability to characterise soil structure. This has been because some workers have considered that properties of
the pore space give the best guide to a soil's structural condition (Russell E.W., 1971; Cary and Hayden, 1973; Greenland, 1981; Osborne, 1984). The amounts and stability of soil pore space indicate~ the degree to which management has succeeded in holding the constituent primary particles apart (Currie, 1966).
Total porosity and pore size distribution measurements are usually made by indirect methods; water release curves are commonly used for measuring pores of a certain size, although a variety of techniques exist (Lawrence, 1977). Direct optical methods have recently been successfully used (Dexter, 1976; Bullock and Thomasson, 1979, Ringrose-Voase and Bullock, 1984).
Transmission properties that are directly influenced by the porosity of a soil are being used more frequently in soil structure research (Baker, 1979; Hamblin and Tennant, 1981; Negi et aI, 1981; McKeague et aI, 1982; Allmaras et aI, 1982; Hamblin 1982; Kanchanasut and Scotter, 1982; Wang et aI, 1985). For example, the concept of assessing pore geometry by using air permeability and hydraulic
conductivity is well known (Ehlers, 1977; Hillel, 1980a; Ball, 1981a,b; Groenevelt et all 1984).
, Soil strength is another important property frequently used in studies of soil structure to help explain or predict differences in seedling emergence and root growth. Methods of soil strength
et aI, 1977; Ball and O'Sullivan, 1982; O'Sullivan and Ball, 1982;
Ehlers et aI, 1983; Groenevelt et aI, 1984; Braim et aI, 1984).
There are several comprehensive texts available on methods of soil
structure measurement (Black, 1965; De Boodt et aI, 1967; Archer and
Marks, 1977; Revut and Rode, 1981) as well as a great many scientific
papers. However in 1979, Cooke stated that as yet "we cannot give a
quantitative account of soil structure that can be used by other crop
scientists". He concluded "that the ultimate aim (for future research
in soil science) must be to predict the effects of inputs in dynamic
production systems, whose soil and plant components have been
quantified". In terms of soil structure research, this must mean that
attention should concentrate more on pores rather than aggregates as
such, since porosity is the most relevant soil physical property
CHAPTER TWO
CHANGES IN SOIL STRUCTURE UNDER DIFFERENT CROPPING SYSTEMS - A REVIEV
2.1 INTRODUCTION
The choice of cropping system is often an important factor
influencing the type and stability of soil structure. The aim of this chapter is to outline and summarise some of the reported changes in soil structure under different cropping systems. The literature cited has also been chosen to illustrate the range of methods used to characterise soil structure and to act as a basis for discussion on further research work needed in soil structure.
2.2 REPORTED CHANGES IN SOIL STRUCTURE
It was decided to summarise many reported changes in soil
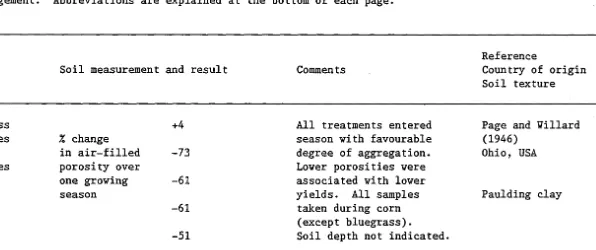
structure under different cropping systems in the form of a table. This was done not only for brevity, but also to make it easy to compare the results from different references. Although the table is detailed and long, it is by no means exhaustive (Table 2.1). Many uncited but relevant references did not contain information that was in an
Cropping system Soil measurement and result
1. Continuous bluegrass +4
2. Corn, oats (residues % change
removed) in air-filled -73 3. Corn, oats (residues porosity over
returned) one growing -61
4. Continuous corn season
(stalks removed) -61
5. Continuous corn
(stalks returned) -51
Comments
All treatments entered season with favourable degree of aggregation. Lower porosities were associated with lower yields. All samples
taken during corn (except bluegrass).
Soil depth not indicated.
Reference
Country of origIn Soil texture
Page and Villard (1946)
Ohio, USA
Paulding clay
1. 100 yrs grassland
2. Continuous arable cultivation
3. 4 yrs arable cultivation after 25 yrs grass
4. Continuous arable cultivation
5. 1 yr ley followed by
4 yrs arable cultivation
6. 3 yrs ley followed by
2 yrs arable cultivation
Effect of 3.5 yr ley (ryegrass/clover) on arable soil
Total porosity
(%)
% of soil
<
2 mm in YSA>
2 mm% YSA
>
0.5 mmYSA water-stable aggregates (wet-sieving).
61 43 49 1 4 10
0.5 yrs 3.5 yrs Drayton 42 45
Hurley 3 7
Measurement made on 0-5 em soil cores.
Measured on first arable crop after ley period.
3-5 mm air-dry aggregates used, immersed directly in water. Samples taken from plough layer.
Increases similar for both soils despite initial greater stabili ty of Drayton soil. Yhole air-dry samples used,
(0-15 em soil depth)
immersed directly in water.
Low (1954)
Jealott's Hill England
clay loam
(see also Low, 1976)
Clement and Yilliams
(1958)
Hurley, England
Drayton: clay loam Hurley : sandy loam
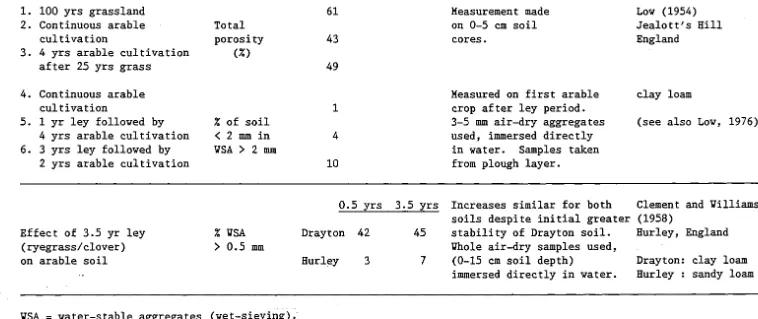
3 yrs cropping of kale and maize followed by: 1. Ryegrass 2. Yhite clover 3. Bare ground
1. Continuous arable cultivation
2. 3 yrs pasture (ryegrass/clover) 3. Ploughing 3 yr pasture
to 15 cm
1,2 or 3 yr ley (ryegrass/clover) in arable rotation
YSA water-stable aggregates.
% YSA
>
1.676 mm% YSA
>
2 mm("aggregation")
1. "aggregation"
2. seedbed preparation
Months after sowing
4 12 20
64 86 90
61 81 86
57 69 79
2
40
22
"Best" structure and easiest seed-bed preparation after 3 yr ley
3-6 mm air-dry aggregates used, (0-10 cm soil depth) immersed directly in water.
2-5 mm air-dry aggregates used, (0-2.5 cm soil depth) immersed directly in water.
Continuous arable
cultivation led to poor crumb structure, difficult seedbed preparation and soil panned after heavy rain.
Robinson and Jaques (1958)
Palmers on North, . New Zealand
Tokomaru silt loam
Greacen (1958) Adelaide, Australia
clay loam/loam
Lewis et al (1960) Jealott's Hill, England
sandy loam
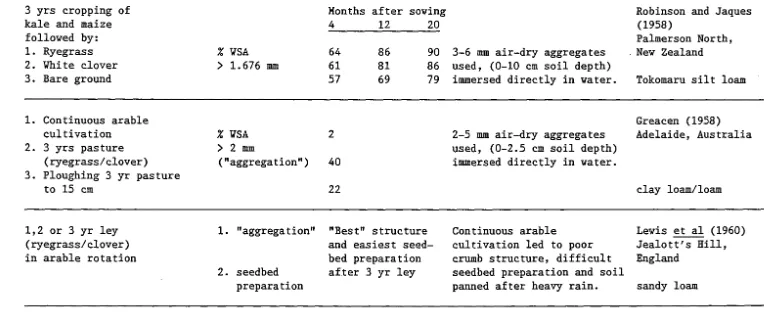
~
1. Continuous grass 2. Potatoes for 26 yrs 3. Potatoes fJ)~ 26 yrs
+ 16
t -
ha -1 yr ':':1~YM! 4. Potato/grain/clover1. Continuous arable cultivation
2. Arable after
i
yrs grass 3. FYM (37 t ha- ) once in5 yrs
4. 6 months grass 5. 3 yrs grass
3 yr ley (ryegrass/clover) in arable rotation after long period of arable cultivation
FYM farmyard manure.
% VSA % pores % total % organic
>
0.25 mm>
50 pm porosity matter57 30
31 14
38 19
30 17
Loss in pore space on slaking (%)
45 39
41 22 4
Soil organic matter
67 4.6 52 2.1
57 3.5 59 2.9
Permeability after slaking
20 25
25 35 800
Increase of
-1
10 t ha in top 15 cm of ley soil
Doy Ie and Hamlyn Vhole air-dry soil ~amples (1960)
used, immersed directly in New Brunswick water (first measurement). Canada
Soil depth not specifically
indicated. sandy loam
Sampling made at least one
year after ploughing grass Villiams and Cooke or applying FYM (2. and 3.) (1961)
4-6 mm air-dry aggregates Voburn, England used (from topsoil) packed
into columns. Grass was
considered more effective sandy soil than FYM. Units of
permeability are cm h-1
Benefit of ley for subsequent Clement (1961) arable crop thought to be Hurley, England nutritional. sandy loam
...
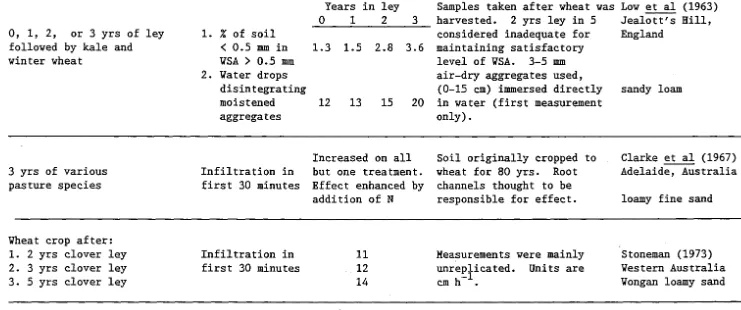
0, 1, 2, or 3 yrs of ley followed by kale and winter wheat
3 yrs of various pasture species
llheat crop after: 1. 2 yrs clover ley 2. 3 yrs clover ley
3. 5 yrs clover ley
llSA
=
water-stable aggregates.1. % of soil
<
0.5 mm in llSA>
0.5 mm 2. llater dropsdisintegrating moistened aggregates
Infiltration in first 30 minutes
Infiltration in first 30 minutes
Years in ley 0 1 2 3
1.3 1.5 2.8 3.6
12 13 15 20
Increased on all but one treatment. Effect enhanced by addition of N
11 12
14
Samples taken after wheat was Low et al (1963) harvested. 2 yrs ley in 5
considered inadequate for maintaining satisfactory level of llSA. 3-5 mm air-dry aggregates used, (0-15 cm) immersed directly in water (first measurement only) •
Soil originally cropped to wheat for 80 yrs. Root channels thought to be responsible for effect.
Measurements were mainly unreplicated. Units are
-1
cm h
Jealott's Hill, England
sandy loam
Clarke et al (1967) Adelaide, Australia
loamy fine sand
Stoneman (1973) Vestern Australia llongan loamy sand
...~\
· N ~
1. Newly ploughed buffalo grass
2. sorghum/wheat/sugar beet/ corn rotation
1. Prolonged arable cultivation
2. 17 yrs grass after arable cultivation 3. Old pasture
Continuous maize cropping
Infiltration after 6 hrs
0.95
0.13
Organic C (%)
0.9
1.7 4.8
Bulk ~jnsity
(g cm )
Available water
(v/v %)
% VSA
>
2 mmK
(~~th-1) % YSA
2.32 33
0.02 4
Light fraction (%)
8.5
20-23 20-23
Years under maize 0 3 6 9
0.72 0.75 0.71 0.79
0.84-2.00 mm air-dry
aggregates used from plough layer (third measurement), immersed directly in water. Units of infiltration are
h-1 d .
cm • K measure In sal
cores from pough layer.
Light fraction defined as partly decomposed material with specific gravity
<
2.06. 0-15 cm soil depth.Values are means of 3 sampling depths (0-35 cm).
25 26 23 79 64 56
2-8 mm air-dry aggregates 23 used, immersed directly in 55 water (third measurement).
VSA = water-stable aggregates; K t = saturated hydraulic conductivity. sa
Skidmore et al (1975)
Kansas, USA
silt loam
Yhitehead et al (1975)
Hurley, England
sandy loam
Cotching et al (1979)
Vaikato district, New Zealand
Horotiu silt loam
Yheat grown under:
1. Disk ploughing 2. Minimum tillage 3. Zero tillage
Rotation of oats/wheat/ oats/wheat grown for 4 yrs under:
1. Direct-drilling
2. Conventional cultivation
Oats grown for 6 yrs under:
1. Direct-drilling
2. Conventional cultivation
K. Infiltraiion 2 a1i 8 -(m x 0 (ml s )
Yater contjnt Measured 1 week after (cm3 cm-) planting wheat following 5.5 2.6 0.117 1 yr of lupins and long 3.9 2.1 0.122 period in pasture. 2.9 0.7 0.137 (0-10 cm soil depth).
Bulk density (g cm-3) K t (em h-1) Measurements made during 4th sa
0-25 cm year. K t samples taken at 1.05
1.01
Bulk ~jnsity (g cm )
1.44 1.30
36 15
topsoil/~~bsoil
interface. Earthworm activity was prime cause of difference in K sa t.Yater content K All measurements made in
(~m3 cm-3 ) (cm d~1) 0-10 cm soil depth, during
the summer of the 6th yr. 35 0.21 Yater content and K
32 0.17 measured at ~ of -100cm.
K t
=
saturated hydraulic conductivity; ~=
matricpotential. saHamblin and Tennant (1979)
Vestern Australia
loamy sand
Douglas et al (1980/81)
Yantage, England Denchworth soil
(clay)
Ehlers et al (1980/81)
Goettingen, Germany
silty soil
...
T45 (%) % VSA % organic C
>
0.5 mm (w/w)1. Grass reference area 68 90 10.0 Arable crops grown for 5 yrs
under:
2. Direct-drilling 50 70 8.4
3. Conventional cultivation 45 43 6.9
Arable crops grown for 4 yrs T45 % organic C
under: (w/w)
1. Direct-drilling 36 3.9
2. Conventional cultivation 42 3.5
T45 (%) % VSA % organic C
>
0.5 mm (w/w)1. Grass reference area 65 90 7.7 Arable crops grown for 5 yrs
under:
2. Direct-drilling 54 71 5.0
3. Conventional cultivation 58 35 4.2
VSA
=
water-stable aggregates.Crops grown not specifically mentioned. T45 is the %
stability as measured by a turbidimeter. 0-2.5 cm soil depth. 1.4-2.8 mm air-dry aggregates used for both stability tests, immersed directly in water.
0-2.5 em soil depth.
Note that direct-drilled soil is less stable than cult-iva ted. Crops grown not specifically mentioned.
0-2.5 cm soil depth. Note how results can be interpreted differently depending on type of stab-ility measurement. Crops grown not specifically mentioned.
•
Douglas and Goss (1982)
Vantage, England
Denchworth soil (silty clay loam)
Reference as above
Andover soil (silt loam)
Reference as above
Lawford soil (silt loam)
Spring barley grown for 4 yrs under:
1. Direct-drilling
2. Conventional cultivation
1. Yheat/peas rotation for 50 yrs
2. Yheat and summer fallow in rotation for 50 yrs
3. Abandoned churchyard, idle since 1913
1. Soil tilled annually for 35 yrs (mainly corn) 2. Adjacent untilled soil
(grassland)
Vane shear strength after sowing (kPa)
36 14
in SitU_I at (J,lm s
~
0.2
0.8
K •
alr 2 (log J,lm )
2.2 2.8
Organic matter
(% w/w)
1.9
1.8
2.5
Bulk ~jnsity Air-filled % organic (g cm ) porosity (%) carbon
1.35 16 2.6
1.30 19 3.1
K. air permeability; K t
=
saturated hydraulic conductivity.alr sa
Strength measured at 20-48 mm O'Sullivan and Ball soil depth. K. measured (1982)
in 10-60 mm soIirdepth after Edinburgh, Scotland sowing. MacMerry sandy loam
K t measured at
1~acm soil depth.
Organic matter measured in 0-15 cm soil depth
All measurements made in 0-10 cm soil depth
Allmaras et al (1982)
Oregon, USA
Yalla Yalla silt loam
Coote and Ramsey . (1983)
Ontario, Canada Ironside loamy sand see also Unger (1982)
I - '
Spring barley grown for Bulk ~~nsity Mean weight % pores All measurements made in Chaney et al 7 yrs under: (g cm ) diameter
>
60 llm 0-5 cm soil depth, collected (1985)1. Direct-drilling 1.38 99 13.3 in the autumn of the 7th year Yorkshire, England 2. Direct-drilling after Mean weight diameter made on
deep tine cultivation 1.46 102 9.8 2.0-2.8 mm pre-wetted Vothersome soil 3. Conventional cultivation 1.34 91 15.7 air-dry aggregates. (fine sany loam)
Continuous maize/oats forage Bulk de~~ity % pores
rotation grown under: (g em )
>
60 llm Ross and Hughesyrl yr2 yr3 yr1 yr2 yr3 (1985)
1. Conventional cultivation 1.10 1.24 1.33 17 18 12 Measurements carried out at Palmers on North, 2. Direct-drilling 1.27 1.44 1.37 6 5 9 harvest over a three year New Zealand
3. Permanent pasture 1.31 7 period, 0-10 cm soil depth. Tokomaru silt loam
VSA water-stable aggregates mean weight diameter E(% aggregates on each-sIeve x mean in tersieve vahlE!).
For simplicity, the references are displayed in chronological order from 1946 to 1985. The references can be broadly divided into
those that compare arable cropping systems (using tillage/cultivation) with grassland, and those that compare different tillage techniques within an arable cropping system. Results from many countries are represented although the majority are English.
Table 2.1 shows general trends. These are:
1. Perennial crops seem more effective in maintaining a desirable soil structure than arable crops grown in soil that is tilled annually.
2. Additions of organic manures seem to be able to partially offset the deleterious effects of continuous tillage.
3. Some form of soil structural deterioration always seems to result under arable crops when tillage is practised.
4. When a grass and/or legume crop is included in an arable rotation, the longer the grass and/or legume crop is grown within that
rotation, the less deterioration the arable part seems to cause.
structure may be founp in the reviews of Osborne (1984) and Cannell (1985).
These trends are similar to those that were shown by Harris et al (1966), who conducted a similar review exercise. However, in the
pres en t case, it is possi ble to ~E!~uc;tda!e_,--aTit_tle._mo~-a' the effec ts of different management systems on soil structure due to the large amount of research conducted on reduced or minimal tillage systems since the review of Harris et al (1966).
There may be an advantage in examining some of the references in Table 2.1 individually for the merits of a particular cropping system, but there is little advantage in quantitatively comparing the results from different references; many of the results presented are not directly comparable because of the variety of methods used. Even results of similar methods (especially those involving water-stable aggregates) are expressed in many different ways. Moreover, there is no indication of how small (or large) a particular value must be before soil structure becomes a problem.
Most of the cited references reveal only instantaneous differences between areas rather than changes due to cropping systems. Whilst this approach may reveal some of the characteristics of soil structure under a specific cropping system, prediction of changes in soil structure is difficult because the published results reveal little about the dynamics of the parameters measured. Often potentially poor soil structure can only be identified once it has become a significant problem (see Page and Willard, 1946; Cooke and Williams, 1972; Low, 1972,1976 for
Those references that show how the result of a particular measurement changed with time stand out as being the most useful for forming advice or predictions about the benefits or disadvantages of particular cropping systems (see Page and Willard, 1946; Clement and Williams, 1958; Robinson and Jaques, 1958; Low et aI, 1963; Cotching et aI, 1979; Ross and Hughes, 1985). However, it is difficult to draw specific predictions or advice from most of the other references.
Some authors have offered specific advice on the basis of their results; for example, Low et al (1963) suggested that a two year ley in five may not be adequate to maintain a satisfactory level of water-stable aggregates on the unwater-stable sandy soil at Jealott's Hill, England. In an earlier paper, Low (1955) remarked that in general, three to four years were insufficient to restore old arable land to the structural condition of old grassland. He thought that up to 50 years would be required on some clay soils with five to ten years being necessary on coarse sandy soils. However, Clement and Williams (1958) found little evidence of any interaction between soil texture and the stabilising influence of a ley. Whatever the case, there is no indication that arable soils need to be restored to the structural condition of old· grassland before conditions for intensive cropping are once again at an optimum.
It must be noted that non-structural benefits from grass and/or legume crops have also been reported (Lewis et aI, 1960; Agricultural Advisory Council, 1970; Russell, E.W., 1973). Williams (1959) showed
c~ops has been shown to be largely due to changes in available soil nitrogen (Williams, 1960; Clement, 1975).
2.3 REASONS FOR CHANGES IN SOIL STRUCTURE
Whilst the precise causes of changes in soil structure remain~
unclear, the changes sometimes (but not always) correlate with changes in soil organic matter content (Hamblin and Davies, 1977). Grass and/or legume cropping systems have been known to return larger quantities of organic matter to the soil than arable cropping systems (Garwood et aI, 1972; Whitehead et aI, 1975). There is also much evidence to suggest
that the stability and formation of soil aggregates is influenced by certain components of the soil organic matter and their interaction with specific inorganic components (Martin et aI, 1955; Harris et aI, 1966; Kemper and Koch, 1966; Swincer et aI, 1969; Greenland, 1971; Giovannini and Sequi, 1976; Hamblin and Greenland, 1977; Tisdall and Oades, 1980b; Douglas and Goss, 1982; Chaney and Swift, 1984; Stengel et aI, 1984; Cheshire et aI, 1984).
However, differences in soil structure under contrasting cropping systems probably do not come about simply through changes in the
addition of organic matter. Different crops may require different management and the many other factors (such as tillage and earthworm activity etc.) that are known to change soil structure are themselves affected by changes in management. It is not easy to assess or
A major limitation of the references in Table 2.1 is that very few
field experiments were specifically designed to isolate and characterise
the effects of the major processes known to change soil structure. Most
field experiments measured the integrated result of many interacting
processes such as tillage, crop and soil type and various climatic
factors; little is known about the relative importance of these factors
or the complex interactions between them.
One of the possible outcomes of the points raised in the above
paragraph is the conflict that appears in the literature as to the
relative restorative properties of individual grass species. For
example, some workers have shown that perennial ryegrass is associated
with highest percentages of water-stable aggregates (Clement and
Williams, 1958; Troughton, 1961b). Others have found the percentage of
water-stable aggregates under perennial ryegrass to be inferior to that
under timothy (Pringle and Coutts, 1956) or under cocksfoot (Barley,
1953). Still others have found little difference between the
restorative properties of cocksfoot or perennial ryegrass (Robinson and
Jaques, 1958). Perhaps what was being treated as an effect on soil
structure of one crop species was actually an effect of a grass/clover
mixture (see for example, Barley, 1953; Clement and Williams, 1958). In
any case, the difference between the effects of individual grass species
may be small compared to the effects of continuous arable tillage/
cultivation on soil structure.
Arable cropping is generally considered to be harmful to soil
structure and it has been suggested that arable crops themselves are
responsible for this (Page and Willard, 1946; Reid and Goss, 1981). A
further disadvantage in having field experiment results expressed as an
have masked any effect of an arable crop itself. Allison (1973) pointed out that an improvement in aggregation was not a benefit realised
exclusively from sod crops (like grass leys), but that aggregation tended to reach a maximum under such crops. In Australian cereal growing areas, cereal roots have actually been thought to promote a moderate degree of aggregation (Clarke and Russell, 1977). It does not seem to have been conclusively shown that arable crops themselves are detrimental to soil structure in the field.
The only direct way of comparing the effects on soil structure of a grass and/or legume crop with those of other crops is to design field experiments where different crops are grown on the same soil, in the same season and with identical management.
2.4 THE NEED FOR PREDICTION OF CHANGES IN SOIL STRUCTURE
Farmers in particular need to know whether continued arable
cropping of their land may lead to difficulties caused by deteriorating soil structure and whether they must improve soil structure by adding more organic matter than is left by the normal crop residues (Cooke, 1967). They need to know how much soil damage will be done by
During the last 30 years, there have been many attempts to increase the efficiency of farming in temperate areas, including New Zealand. This has intensified the need for prediction of changes in soil structure. Mixed livestock and arable farming systems have now seen a greater separation because they have become economically less viable in combination (Johnston, 1982). Increases in the use of heavier and more powerful machinery have also saved both labour and time.
Whilst these developments may be improvements in the short-term
economical sense, there is little doubt that they are related to major causes of soil structural deterioration (Boekel, 1982).
The recent breaking away from the traditional method of tillage is of great importance. It is only since the second world war that these traditions have been seriously questioned (Allen, 1981). The
development of modern methods of management such as chemically-assisted minimal tillage for cereals and reduced cultivations for many other crops has enhanced the importance of soil compaction and methods of avoiding it. However, when these modern methods of management are introduced, the level of some soil physical conditions may be close to values that can be considered near the threshold for satisfactory plant growth. There is therefore a further need to be able to predict changes in soil structure under different cropping systems.
deteriorating soil structure (Packard and Raeside, 1952; Gradwell and Arlidge, 1971; Hughes and Baker, 1977; Cotching et aI, 1979). Despite these reports, some cultivation practices have maintained a suitable structure for intensive cropping (Marshall, 1972; Ross and Cox, 1981; Ross and Hughes, 1985).
Whilst there has been a trend for farms with structurally sound soils to move towards specialised intensive cropping systems (Collie and Dougherty, 1973), mixed crop and livestock farming is also extensively practised in certain areas of New Zealand like Canterbury (Frengley, 1983). The introduction of minimal tillage systems (with the absence of any agronomic yield disadvantages) has also favoured mixed crop and livestock farming and might be expected to be beneficial to soil structure. However, in the long term, only in rare cases should land with the potential for crop production be used for animal-based
agriculture (Dunbier, 1983). Soil structure might become an important limiting factor in crop production on some of the more poorly structured soils in New Zealand.
It could be argued that one of the reasons why soil structure has been infrequently reported as being limiting to crop production in New Zealand is simply because it is not. Although many of New Zealand's farming systems are the result of direct technological transfers from the Northern Hemisphere, this does not mean that identical soil
structural problems will occur. Great caution should be taken in assuming that 'most of the structural differences reported in Table 2.1
To assist prediction, there is a need for experimental work which
examines critically how soil physical factors and processes are changed
under different cropping systems and how crops respond to these changes.
As Ehlers (1984) suggests "we have to adopt and apply much more the
mathematical-quantitative approach which characterises modern soil
physics. We have to quantify not only the static properties of the soil
but also the dynamic processes which in turn influence the dynamics of
root growth and plant development".
2.5 CONCLUSIONS
The overall objective of using a particular cropping system is to
ensure that viable, economic yields from crops are obtained. The
production of these crops must not lead' to soil changes which prevent
yields from continuing to be viable and economic. To help meet this
objective, it is becoming increasingly necessary to be able to predict
the effects of various cropping systems on soil physical properties and
ultimately crop yield.
At present, there is much empirical information available
concerning qualitative aspects of changes in soil structure under
different cropping systems. It is difficult to arrange this information
into an overall pattern to facilitate specific predictions or advice.
Much of the available information also has its origins outside New
Zealand and may not be appropriate to this country.
A model of changes in soil structure potentially has two main
1. It could be useful to farmers and their advisors when they are
choosing a production system for a given site.
2. It could help in the identification of priority areas of soil
structure research, so that the uncertainties associated with new
systems of management could be more easily assessed (see also
Larson and Osborne, 1982).
In order to progress towards a mathematical model of changes in
soil structure, firstly it is necessary to arrange in a systematic way,
what is known about the processes that influence such changes. Such an
arrangement may be termed a 'conceptual model'. Secondly, it is
necessary to set up field experiments with appropriate treatments that
can help to isolate and assess the relative importance of the many
possible processes influencing changes in soil structure under different
cropping systems. The results from such experiments might suggest the
most profitable direction and intensity of the further research needed
to develop the conceptual model into a mathematical model which can
eventually be used for prediction.
2.6 STATEMENT OF OBJECTIVES
On the basis of the preceeding discussion, the following
objectives were defined:
1. To devise and test a conceptual model to help understand the
I
i nat.ure and causes of changes in soil structure under different
:cropping systems used on Canterbury soils with small shrink/swell
2. To conduct field experiments to observe whether an effect of
different crops per se on soil structure can be distinguished from
the effects of management.
3. To use the conceptual model to isolate and assess the relative
importance of several processes influencing changes in soil
CHAPTER THREE
DEVELOPMENT OF A CONCEPTUAL MODEL OF CHANGES IN SOIL STRUCTURE UNDER DIFFERENT CROPPING SYSTEMS
3.1 INTRODUCTION
In Chapter Two, it was concluded that prediction of changes in
soil structure would be desirable for efficient management of cropping
systems. There is already a great amount of published information on
differences in soil structure under many different cropping systems;
even so, it is still not possible to use this information to predict
changes in soil structure that will occur under the many different
combinations of soil type, crop, management and climate. Accurate
prediction of changes in soil structure may only be possible if models
can be used to describe the soil/plant system. Osborne (1984) suggested
that an 'agrophysical index' for soil management could even be developed
which could be derived from simple measurements made by farmers.
Models of varying degrees of complexity already exist for many
soil physical processes, such as water movement in soil (Clothier et aI,
1977; Ehlers, 1977; Hillel, 1980b; Germann and Bevan, 1981b; Bouma et
aI, 1982), air movement in soil (Ball, 1981a) and infiltration of water
as governed by the pore size distribution (Baker, 1979). Other models
have been devised to statistically describe the distribution of
aggregates and voids (Dexter, 1976; Ringrose-Voase and Bullock, 1984).
A modelling approach has also been used to quantify the turnover of soil
organic matter (Jenkinson and Rayner, 1977; Hart, 1984). In addition,
water-stable aggregates have been presented by Emerson (1959), Edwards
and Bremner (1967) and Tisdall and Oades (1982).
Some soil physical processes have been incorporated into models
which help to describe root growth (Dexter, 1978a; Gerard et aI, 1982;
Hewitt and Dexter, 1984b). Other empirical models have been used to
describe root systems in relation to water usage and nutrient
availability (see Nye and Tinker (1977) for review). However, models
which describe structure-related effects on the soil (such as tillage)
have been rarely incorporated into combined models involving soil
physical properties and plant growth (Larson and Osborne, 1982). Only
recently has progress been made in this direction (Whisler et aI, 1982;
Huck and Hillel, 1983). Moreover, there is a lack of models which
predict changes in soil structure, although modelling approaches have
been used to predict the consequences of deliberately-imposed structural
differences (Kral and Hawkins, 1982).
The aim of this chapter is to describe a conceptual model of
changes in soil structure under different cropping systems. The model
is mechanistic and uses the state-variable approach (De Wit, 1982). This
approach assumes that the state of each system at any moment can be
quantified and that changes in the state can eventually be described
mathematically. The present intention is for the model to provide a
satisfactory framework for interpretation of experimental results and
the assessment and characterisation of processes that change soil
structure. It is realised that the model must not be so complicated