1.1
38
0
0
Full text
(2) Start-Up Activities. LAUNCH Lab How can you form layers of liquids? You know that ice floats in water, whereas a rock sinks. Not surprisingly, water and other liquids sometimes form distinct layers when poured together.. Types of Graphs Make the following Foldable to organize information about types of graphs. STEP 1 Collect two sheets of paper, and layer them about 2 cm apart vertically. Keep the left and right edges even. STEP 2 Fold up the bottom edges of the paper to form three equal tabs. Crease the fold to hold the tabs in place.. Procedure 1. Read and complete the lab safety form. 2. Observe 5-mL samples of alcohol (dyed red), glycerol (dyed blue), corn oil, and water. Plan the order in which to add the liquids to a graduated cylinder to form four layers. WARNING: Keep alcohol away from open flames. 3. Test your plan by adding the liquids, one at a time, to the graduated cylinder. When adding each liquid, tilt the graduated cylinder, and slowly pour the liquid so it runs down the inside. When adding the glycerol, allow it to settle before adding the next liquid. 4. Did the liquids form four distinct layers? If not, rinse out the graduated cylinder and repeat Steps 2 and 3 using a different order. Analysis 1. Identify the order, from top to bottom, of the layers in the graduated cylinder. 2. Hypothesize what property of the liquids is responsible for the arrangement of the layers. Inquiry What do you think would happen if small pieces of metal, plastic, and wood were added to the layers of liquids in the graduated cylinder?. STEP 3 Staple along the fold. Label as follows: Types of Graphs, Circle Graphs, Bar Graphs, and Line Graphs.. Line Graphs Bar Graphs Circle Graphs Types of Graphs. &/,$!",%3 Use this Foldable with Section 2.4 As you. read this section, summarize what you learn about the three types of graphs. Include the types of information that can be graphed on each. Be sure to include examples.. Visit glencoe.com to: ▶ study the entire chapter online ▶. explore. ▶. take Self-Check Quizzes. ▶. use the Personal Tutor to work Example Problems step-by-step. ▶. access Web Links for more information, projects, and activities. ▶. find the Try at Home Lab, SI Measurement Around the Home. Chapter 2 • Analyzing Data 31 Matt Meadows.
(3) Section 2.1 Objectives ◗ Define SI base units for time, length, mass, and temperature. ◗ Explain how adding a prefix changes a unit. ◗ Compare the derived units for volume and density.. Units and Measurements MAIN Idea Chemists use an internationally recognized system of units to communicate their findings.. Review Vocabulary. Real-World Reading Link Have you ever noticed that a large drink varies in volume depending on where it is purchased? Wouldn’t it be better if you always knew how much drink you would get when you ordered the large size? Chemists use standard units to ensure the consistent measurement of a given quantity.. mass: a measurement that reflects the amount of matter an object contains. Units. New Vocabulary base unit second meter kilogram kelvin derived unit liter density. Figure 2.1 The label gives the volume of water in the bottle in three different units: fluid ounces, pints, and milliliters. Notice that each volume includes a number and a unit. Infer Which is the larger unit of volume: a fluid ounce or a milliliter? ■. 32. Chapter 2 • Analyzing Data. (l)©Rhoda Peacher, (r)©Janet Horton Photography. You use measurements almost every day. For example, reading the bottled water label in Figure 2.1 helps you decide what size bottle to buy. Notice that the label uses a number and a unit, such as 500 mL, to give the volume. The label also gives the volume as 16.9 fluid ounces. Fluid ounces, pints, and milliliters are units used to measure volume. Système Internationale d’Unités For centuries, units of measurement were not exact. A person might measure distance by counting steps, or measure time using a sundial or an hourglass filled with sand. Such estimates worked for ordinary tasks. Because scientists need to report data that can be reproduced by other scientists, they need standard units of measurement. In 1960, an international committee of scientists met to update the existing metric system. The revised international unit system is called the Système Internationale d’Unités, which is abbreviated SI..
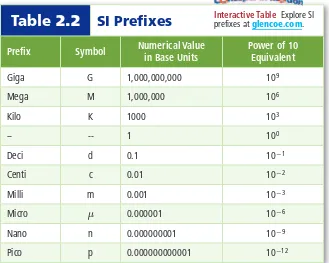
(4) Base Units and SI Prefixes There are seven base units in SI. A base unit is a defined unit in a system of measurement that is based on an object or event in the physical world. A base unit is independent of other units. Table 2.1 lists the seven SI base units, the quantities they measure, and their abbreviations. Some familiar quantities that are expressed in base units are time, length, mass, and temperature. To better describe the range of possible measurements, scientists add prefixes to the base units. This task is made easier because the metric system is a decimal system—a system based on units of 10. The prefixes in Table 2.2 are based on factors of ten and can be used with all SI units. For example, the prefix kilo- means one thousand; therefore, 1 km equals 1000 m. Similarly, the prefix milli- means one-thousandth; therfore, 1 mm equals 0.001 m. Many mechanical pencils use lead that is 0.5 mm in diameter. How much of a meter is 0.5 mm? Time The SI base unit for time is the second (s). The physical standard used to define the second is the frequency of the radiation given off by a cesium-133 atom. Cesium-based clocks are used when highly accurate timekeeping is required. For everyday tasks, a second seems like a short amount of time. In chemistry, however, many chemical reactions take place within a fraction of a second. Length The SI base unit for length is the meter (m). A meter is the distance that light travels in a vacuum in 1/299,792,458 of a second. A vacuum exists where space contains no matter. A meter is close in length to a yard and is useful for measuring the length and width of a small area, such as a room. For larger distances, such as between cities, you would use kilometers. Smaller lengths, such as the diameter of a pencil, are likely to be given in millimeters. Use Table 2.2 to determine how many centimeters are in a meter and how many centimeters are in a kilometer.. Table 2.2 Prefix. SI Prefixes Numerical Value in Base Units. Symbol. Table 2.1. SI Base Units. Quantity. Base Unit. Time. second (s). Length. meter (m). Mass. kilogram (kg). Temperature. kelvin (K). Amount of a substance. mole (mol). Electric current. ampere (A). Luminous intensity. candela (cd). VOCABULARY SCIENCE USAGE V. COMMON USAGE Meter Science usage: the SI base unit of length The metal rod was 1 m in length. Common usage: a device used to measure The time ran out on the parking meter.. Interactive Table Explore SI prefixes at glencoe.com.. Power of 10 Equivalent. Giga. G. 1,000,000,000. 10 9. Mega. M. 1,000,000. 10 6. Kilo. K. 1000. 10 3. --. --. 1. 10 0. Deci. d. 0.1. 10 -1. Centi. c. 0.01. 10 -2. Milli. m. 0.001. 10 -3. Micro. µ. 0.000001. 10 -6. Nano. n. 0.000000001. 10 -9. Pico. p. 0.000000000001. 10 -12 Section 2.1 • Units and Measurements 33.
(5) Mass Recall that mass is a measure of the amount of matter an object contains. The SI base unit for mass is the kilogram (kg). Currently, a platinum and iridium cylinder kept in France defines the kilogram. The cylinder is stored in a vacuum under a triple bell jar to prevent the cylinder from oxidizing. As shown in Figure 2.2, scientists are working to redefine the kilogram using basic properties of nature. A kilogram is equal to about 2.2 pounds. Because the masses measured in most laboratories are much smaller than a kilogram, scientists often measure quantities in grams (g) or milligrams (mg). For example, a laboratory experiment might ask you to add 35 mg of an unknown substance to 350 g of water. When working with mass values, it is helpful to remember that there are 1000 g in a kilogram. How many milligrams are in a gram?. Figure 2.2 Scientists at the National Institute of Standards and Technology are experimenting with redefining the kilogram using an apparatus known as a watt balance. The watt balance uses electric current and a magnetic field to measure the force required to balance a one-kilogram mass against the force of gravity. Other scientists are counting the number of atoms in a one-kilogram mass to redefine the kilogram.. ■. Temperature People often use qualitative descriptions, such as hot and cold, when describing the weather or the water in a swimming pool. Temperature, however, is a quantitative measurement of the average kinetic energy of the particles that make up an object. As the particle motion in an object increases, so does the temperature of the object. Measuring temperature requires a thermometer or a temperature probe. A thermometer consists of a narrow tube that contains a liquid. The height of the liquid indicates the temperature. A change in temperature causes a change in the volume of the liquid, which results in a change in the height of the liquid in the tube. Electronic temperature probes make use of thermocouples. A thermocouple produces an electric current that can be calibrated to indicate temperature. Several different temperature scales have been developed. Three temperature scales—Kelvin, Celsius, and Fahrenheit—are commonly used to describe how hot or cold an object is. Fahrenheit In the United States, the Fahrenheit scale is used to. measure temperature. German scientist Gabriel Daniel Fahrenheit devised the scale in 1724. On the Fahrenheit scale, water freezes at 32°F and boils at 212°F.. Personal Tutor For an online tutorial on conversions, visit glencoe.com.. Celsius Another temperature scale, the Celsius scale, is used throughout much of the rest of the world. Anders Celsius, a Swedish astronomer, devised the Celsius scale. The scale is based on the freezing and boiling points of water. He defined the freezing point of water as 0 and the boiling point of water as 100. He then divided the distance between these two fixed points into 100 equal units, or degrees. To convert from degrees Celsius (°C) to degrees Fahrenheit (°F), you can use the following equation.. °F = 1.8(°C) + 32 Imagine a friend from Canada calls you and says that it is 35°C outside. What is the temperature in degrees Fahrenheit? To convert to degrees Fahrenheit, substitute 35°C into the above equation and solve. 1.8(35) + 32 = 95°F If it is 35°F outside, what is the temperature in degrees Celsius? 35°F - 32 _ = 1.7 °C 1.8. Reading Check Infer Which is warmer, 25°F or 25°C? 34. Chapter 2 • Analyzing Data. ©Robert Rathe.
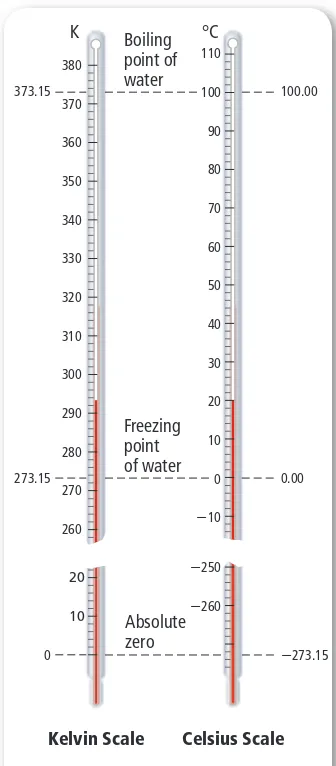
(6) Kelvin The SI base unit for temperature is the kelvin (K). The Kelvin. scale was devised by a Scottish physicist and mathematician, William Thomson, who was known as Lord Kelvin. Zero kelvin is a point where all particles are at their lowest possible energy state. On the Kelvin scale, water freezes at 273.15 K and boils at 373.15 K. In Chapter 13, you will learn why scientists use the Kelvin scale to describe properties of a gas. Figure 2.3 compares the Celsius and Kelvin scales. It is easy to convert between the Celsius scale and the Kelvin scale using the following equation.. K 380 373.15. °C. Boiling point of water. 110 100. 370. 90. 360. 80. 350. 70. 340. 60. 330. Kelvin-Celsius Conversion Equation. K = °C + 273. 40. 310. 30. 300. Temperature in kelvins is equal to temperature in degrees Celsius plus 273.. 290. As shown by the equation above, to convert temperatures reported in degrees Celsius to kelvins, you simply add 273. For example, consider the element mercury, which melts at -39°C. What is this temperature in kelvins?. 50. 320. K represents temperature in kelvins. °C represents temperature in degrees Celsius.. 280 273.15. 20. Freezing point of water. 10 0. 270. -250. 20. To convert from kelvins to degrees Celsius, just subtract 273. For example, consider the element bromine, which melts at 266 K. What is this temperature in degrees Celsius?. 10 0. 0.00. -10. 260. -39°C + 273 = 234 K. 100.00. Absolute zero. -260 -273.15. 266 K - 273 = -7°C You will use these conversions frequently throughout chemistry, especially when you study how gases behave. The gas laws you will learn are based on kelvin temperatures.. Derived Units Not all quantities can be measured with SI base units. For example, the SI unit for speed is meters per second (m/s). Notice that meters per second includes two SI base units—the meter and the second. A unit that is defined by a combination of base units is called a derived unit. Two other quantities that are measured in derived units are volume (cm 3) and density (g/cm 3).. Kelvin Scale. Celsius Scale. Figure 2.3 A change of 1 K on the Kelvin scale is equal in size to a change of 1°C on the Celsius scale. Notice also that the degree sign ( ° ) is not used with the Kelvin scale.. ■. Volume Volume is the space occupied by an object. The volume of an object with a cubic or rectangular shape can be determined by multiplying its length, width, and height dimensions. When each dimension is given in meters, the calculated volume has units of cubic meters (m 3). In fact, the derived SI unit for volume is the cubic meter. It is easy to visualize a cubic meter; imagine a large cube whose sides are each 1 m in length. The volume of an irregularly shaped solid can be determined using the water displacement method, a method used in the MiniLab in this section. The cubic meter is a large volume that is difficult to work with. For everyday use, a more useful unit of volume is the liter. A liter (L) is equal to one cubic decimeter (dm 3), that is, 1 L equals 1 dm 3. Liters are commonly used to measure the volume of water and beverage containers. One liter has about the same volume as one quart. Section 2.1 • Units and Measurements 35.
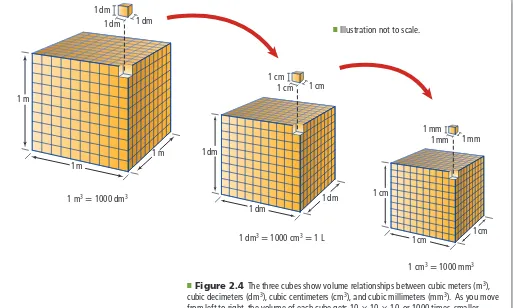
(7) 1 dm 1 dm. 1 dm O. 1 cm 1 cm. Illustration not to scale.. 1 cm. 1m 1 mm 1 mm 1m. 1mm. 1 dm. 1m 1 m3 = 1000 dm3. 1 dm. 1 cm. 1 dm 1 dm3 = 1000 cm3 = 1 L. 1cm. 1cm. 1 cm3 = 1000 mm3 ■ Figure 2.4 The three cubes show volume relationships between cubic meters (m 3), cubic decimeters (dm 3), cubic centimeters (cm 3), and cubic millimeters (mm 3). As you move from left to right, the volume of each cube gets 10 × 10 × 10, or 1000 times, smaller. Interpret How many cubic centimeters (cm 3) are in 1 L?. For smaller quantities of liquids in the laboratory, volume is often measured in cubic centimeters (cm 3) or milliliters (mL). A milliliter and a cubic centimeter are equal in size. 1 mL = 1 cm 3 Recall that the prefix milli- means one-thousandth. Therefore, one milliliter is equal to one-thousandth of a liter. In other words, there are 1000 ml in 1 L. 1 L = 1000 mL Figure 2.4 shows the relationships among several different SI units of. volume. Density Why is it easier to lift a backpack filled with gym clothes than the same backpack filled with books? The answer can be thought of in terms of density—the book-filled backpack contains more mass in the same volume. Density is a physical property of matter and is defined as the amount of mass per unit volume. Common units of density are grams per cubic centimeter (g/cm 3) for solids and grams per milliliter (g/mL) for liquids and gases. Consider the grape and the piece of foam in Figure 2.5. Although both have the same mass, they clearly occupy different amounts of space. Because the grape occupies less volume for the same amount of mass, its density must be greater than that of the foam. 36 Chapter 2 • Analyzing Data.
(8) Figure 2.5 The grape and the foam have the same mass but different volumes because the grape is more dense. Interpret How would the masses compare if the volumes were equal? ■. The density of a substance usually cannot be measured directly. Rather, it is calculated using mass and volume measurements. You can calculate density using the following equation.. Real-World Chemistry Liquid Density Measurement. Density Equation mass density = _ volume. The density of an object or a sample of matter is equal to its mass divided by its volume.. Because density is a physical property of matter, it can sometimes be used to identify an unknown element. For example, imagine you are given the following data for a piece of an unknown metallic element. volume = 5.0 cm 3 mass = 13.5 g Substituting these values into the equation for density yields: 13.5 g 5.0 cm. density = _3 = 2.7 g/cm 3 Now turn to Table R–7 on page 971, and scan through the given density values until you find one that closely matches the calculated value of 2.7 g/cm 3. What is the identity of the unknown element? Connection. Earth Science. As air at the equator is warmed, the particles in the air move farther apart and the air density decreases. At the poles, the air cools and its density increases as the particles move closer together. When a cooler, denser air mass sinks beneath a rising warm air mass, winds are produced. Weather patterns are created by moving air masses of different densities. to. Hydrometers A hydrometer is a device that measures the specific gravity (the ratio of the fluid’s density to that of water) of a fluid. Fluids of different densities result in different readings. Hydrometers are often used at service stations to diagnose problems with an automobile’s battery.. Reading Check State the quantities that must be known in order to. calculate density. Section 2.1 • Units and Measurements 37 (t)Matt Meadows, (b)©B. RUNK/S. SCHOENBERGER/Grant Heilman Photography..
(9) Your textbook includes many Example Problems, each of which is solved using a three-step process. Read Example Problem 2.1 and follow the steps to calculate the mass of an object using density and volume.. THE PROBLEM 1. Read the problem carefully. 2. Be sure that you understand what is being asked. ANALYZE THE PROBLEM 1. Read the problem again. 2. Identify what you are given, and list the known data. If needed, gather information from graphs, tables, or figures. 3. Identify and list the unknowns. 4. Plan the steps you will follow to find the answer. SOLVE FOR THE UNKNOWN 1. Determine whether you need a sketch to solve the problem. 2. If the solution is mathematical, write the equation and isolate the unknown factor. 3. Substitute the known quantities into the equation. 4. Solve the equation. 5. Continue the solution process until you solve the problem. EVALUATE THE ANSWER 1. Reread the problem. Is the answer reasonable? 2. Check your math. Are the units and the significant figures correct? (Refer to Section 2.3.). EXAMPLE Problem 2.1 Using Density and Volume to Find Mass When a piece of aluminum is placed in a 25-mL graduated cylinder that contains 10.5 mL of water, the water level rises to 13.5 mL. What is the mass of the aluminum? 1. Analyze the Problem The mass of aluminum is unknown. The known values include the initial and final volumes and the density of aluminum. The volume of the sample equals the volume of water displaced in the graduated cylinder. The density of aluminum is 2.7 g/mL. Use the density equation to solve for the mass of the aluminum sample. Known density = 2.7 g/mL initial volume = 10.5 mL final volume = 13.5 mL. 2. Unknown mass = ? g. Solve for the Unknown volume of sample = final volume initial volume volume of sample = 13.5 mL 10.5 mL volume of sample = 3.0 mL. State the equation for volume. Substitute final volume = 13.5 mL and initial volume = 10.5 mL.. mass density = _. State the equation for density.. volume. 3. mass = volume × density mass = 3.0 mL × 2.7 g/mL. Solve the density equation for mass.. mass = 3.0 mL × 2.7 g/mL = 8.1 g. Multiply, and cancel units.. Substitute volume = 3.0mL and density = 2.7 g/mL.. Evaluate the Answer Check your answer by using it to calculate the density of aluminum. 8.1 g mass density = _ = _ = 2.7 g/mL volume. 3.0 mL. Because the calculated density for aluminum is correct, the mass value must also be correct.. PRACTICE Problems. Extra Practice Page 976 and glencoe.com. 1. Is the cube pictured at right made of pure aluminum? Explain your answer. 2. What is the volume of a sample that has a mass of 20 g and a density of 4 g/mL? 3. Challenge A 147-g piece of metal has a density of 7.00 g/mL. A 50-mL graduated cylinder contains 20.0 mL of water. What is the final volume after the metal is added to the graduated cylinder?. 38 Chapter 2 • Analyzing Data. Mass = 20 g Volume = 5 cm3.
(10) Determine Density What is the density of an unknown and irregularly shaped solid? To calculate the density of an object, you need to know its mass and volume. The volume of an irregularly shaped solid can be determined by measuring the amount of water it displaces.. Meniscus. Procedure. 1. Read and complete the lab safety form. 2. Obtain several unknown objects from your. 3. 4.. 5.. 6.. teacher. Note: Your teacher will identify each object as A, B, C, and so on. Create a data table to record your observations. Measure the mass of the object using a balance. Record the mass and the identity of the object in your data table. Add about 15 mL of water to a graduated cylinder. Measure and record the initial volume in your data table. Because the surface of the water in the cylinder is curved, make volume readings at eye level and at the lowest point on the curve, as shown in the figure. The curved surface is called a meniscus. Tilt the graduated cylinder, and carefully slide the object down the inside of the cylinder. Be sure not to cause a splash. Measure and record the final volume in your data table.. Section 2.1. Analysis. 1. Calculate Use the initial and final volume readings to calculate the volume of each mystery object. 2. Calculate Use the calculated volume and the measured mass to calculate the density of each unknown object. 3. Explain Why can’t you use the water displacement method to find the volume of a sugar cube? 4. Describe how you can determine a washer’s volume without using the water displacement method. Note, that a washer is similar to a short cylinder with a hole through it.. Assessment. Section Summary. 4.. ◗ SI measurement units allow scientists to report data to other scientists.. 5. Describe how adding the prefix mega- to a unit affects the quantity being described.. ◗ Adding prefixes to SI units extends the range of possible measurements.. 6. Compare a base unit and a derived unit, and list the derived units used for density and volume.. ◗ To convert to Kelvin temperature, add 273 to the Celsius temperature.. 7. Define the relationships among the mass, volume, and density of a material.. ◗ Volume and density have derived units. Density, which is a ratio of mass to volume, can be used to identify an unknown sample of matter.. 9. Calculate Samples A, B, and C have masses of 80 g, 12 g, and 33 g, and volumes of 20 mL, 4 cm 3, and 11 mL, respectively. Which of the samples have the same density?. MAIN Idea. Define the SI units for length, mass, time, and temperature.. 8. Apply Why does oil float on water?. 10. Design a concept map that shows the relationships among the following terms: volume, derived unit, mass, base unit, time, and length.. Self-Check Quiz glencoe.com. Section 2.1 • Units and Measurements 39.
(11) Section 2.2 Objectives ◗ Express numbers in scientific notation. ◗ Convert between units using dimensional analysis.. Review Vocabulary. Scientific Notation and Dimensional Analysis MAIN Idea Scientists often express numbers in scientific notation and solve problems using dimensional analysis.. quantitative data: numerical information describing how much, how little, how big, how tall, how fast, and so on. Real-World Reading Link If you have ever had a job, one of the first things you probably did was figure out how much you would earn per week. If you make 10 dollars per hour and work 20 hours per week, how much money will you make? Performing this calculation is an example of dimensional analysis.. New Vocabulary. Scientific Notation. scientific notation dimensional analysis conversion factor. The Hope Diamond, which is shown in Figure 2.6, contains approximately 460,000,000,000,000,000,000,000 atoms of carbon. Each of these carbon atoms has a mass of 0.00000000000000000000002 g. If you were to use these numbers to calculate the mass of the Hope Diamond, you would find that the zeros would get in your way. Using a calculator offers no help, as it won’t let you enter numbers this large or this small. Numbers such as these are best expressed in scientific notation. Scientists use this method to conveniently restate a number without changing its value. Scientific notation can be used to express any number as a number between 1 and 10 (known as the coefficient) multiplied by 10 raised to a power (known as the exponent). When written in scientific notation, the two numbers above appear as follows. Coefficient. carbon atoms in the Hope Diamond = 4.6 × 10 23 mass of one carbon atom = 2 × 10 -23 g. Figure 2.6 At more than 45 carats, the Hope Diamond is the world’s largest deep-blue diamond. Originally mined in India, the diamond’s brilliant blue color is due to trace amounts of boron within the diamond. Diamonds are formed from a unique structure of carbon atoms, creating one of nature’s hardest known substances. Note that a carat is a unit of measure used for gemstones (1 carat = 200 mg).. ■. 40. Chapter 2 • Analyzing Data. ©The Hope Diamond, NO_DATA/Smithsonian Institution, Washington DC, USA,/The Bridgeman Art Library. Exponent.
(12) Let’s look at these two numbers more closely. In each case, the number 10 raised to an exponent replaced the zeros that preceded or followed the nonzero numbers. For numbers greater than 1, a positive exponent is used to indicate how many times the coefficient must be multiplied by 10 in order to obtain the original number. Similarly, for numbers less than 1, a negative exponent indicates how many times the coefficient must be divided by 10 in order to obtain the original number. Determining the exponent to use when writing a number in scientific notation is easy: simply count the number of places the decimal point must be moved to give a coefficient between 1 and 10. The number of places moved equals the value of the exponent. The exponent is positive when the decimal moves to the left and the exponent is negative when the decimal moves to the right.. Personal Tutor For an online tutorial on scientific notation, visit glencoe.com.. 460,000,000,000,000,000,000,000. → 4.6 × 10 23 Because the decimal point moves 23 places to the left, the exponent is 23.. 0.00000000000000000000002 → 2 × 10 -23 Because the decimal point moves 23 places to the right, the exponent is -23.. EXAMPLE Problem 2.2. Math Handbook. Scientific Notation Write the following data in scientific notation. a. The diameter of the Sun is 1,392,000 km. b. The density of the Sun’s lower atmosphere is 0.000000028 g/cm 3. 1. Scientific Notation page 946. Analyze the Problem You are given two values, one much larger than 1 and the other much smaller than 1. In both cases, the answers will have a coefficient between 1 and 10 multiplied by a power of 10.. 2. Solve for the Unknown Move the decimal point to give a coefficient between 1 and 10. Count the number of places the decimal point moves, and note the direction. 1,392,000.. Move the decimal point six places to the left.. 0.000000028. Move the decimal point eight places to the right.. a. 1.392 × 10 6 km b. 2.8 × 10 -8 g/cm 3 3. Write the coefficients, and multiply them by 10 n where n equals the number of places moved. When the decimal point moves to the left, n is positive; when the decimal point moves to the right, n is negative. Add units to the answers.. Evaluate the Answer The answers are correctly written as a coefficient between 1 and 10 multiplied by a power of 10. Because the diameter of the Sun is a number greater than 1, its exponent is positive. Because the density of the Sun’s lower atmosphere is a number less than 1, its exponent is negative.. PRACTICE Problems. Extra Practice Page 976 and glencoe.com. 11. Express each number in scientific notation. a. 700 c. 4,500,000 e. 0.0054 g. 0.000000076 b. 38,000 d. 685,000,000,000 f. 0.00000687 h. 0.0000000008 12. Challenge Express each quantity in regular notation along with its appropriate unit. a. 3.60 × 10 5 s b. 5.4 × 10 -5 g/cm 3 c. 5.060 × 10 3 km d. 8.9 × 10 10 Hz. Section 2.2 • Scientific Notation and Dimensional Analysis 41.
(13) Addition and subtraction In order to add or subtract numbers written in scientific notation, the exponents must be the same. Suppose you need to add 7.35 × 10 2 m and 2.43 × 10 2 m. Because the exponents are the same, you can simply add the coefficients.. (7.35 × 10 2 m) + (2.43 × 10 2 m) = 9.78 × 10 2 m How do you add numbers in scientific notation when the exponents are not the same? To answer this question, consider the amounts of energy produced by renewable energy sources in the United States. Wind-powered turbines, shown in Figure 2.7, are one of several forms of renewable energy used in the United States. Other sources of renewable energy include hydroelectric, biomass, geothermal, and solar power. In 2004, the energy production amounts from renewable sources were as follows.. VOCABULARY ACADEMIC VOCABULARY Sum the whole amount; the result of adding numbers At the checkout counter, all of the items came to a sizable sum.. Hydroelectric Biomass Geothermal Wind Solar. 2.840 × 10 18 J* 3.146 × 10 18 J 3.60 × 10 17 J 1.50 × 10 17 J 6.9 × 10 16 J. * J stands for joules, a unit of energy.. To determine the sum of these values, they must be rewritten with the same exponent. Because the two largest values have an exponent of 10 18, it makes sense to convert the other numbers to values with this exponent. These other exponents must increase to become 10 18. As you learned earlier, each place the decimal shifts to the left decreases the exponent by 1. Rewriting the values with exponents of 10 18 and adding yields the following.. Figure 2.7 The uneven heating of Earth’s surface causes wind, which powers these turbines and generates electricity.. ■. Hydroelectric 2.840 × 10 18 J Biomass 3.146 × 10 18 J Geothermal 0.360 × 10 18 J Wind 0.150 × 10 18 J Solar 0.069 × 10 18 J _________________ Total 6.565 × 10 18 J Reading Check Restate the process used to add two numbers that are expressed in scientific notation.. PRACTICE Problems. Extra Practice Page 976 and glencoe.com. 13. Solve each problem, and express the answer in scientific notation. a. (5 × 10 -5) + (2 × 10 -5) c. (9 × 10 2) - (7 × 10 2) b. (7 × 10 8) - (4 × 10 8) d. (4 × 10 -12) + (1 × 10 -12) 14. Challenge Express each answer in scientific notation in the units indicated. a. (1.26 × 10 4 kg) + (2.5 × 10 6 g) in kg b. (7.06 g) + (1.2 × 10 -4 kg) in kg c. (4.39 × 10 5 kg) - (2.8 × 10 7 g) in kg d. (5.36 × 10 -1 kg) - (7.40 × 10 -2 kg) in g. 42. Chapter 2 • Analyzing Data. ©Ed Young/CORBIS.
(14) Multiplication and division Multiplying and dividing numbers in scientific notation is a two-step process, but it does not require the exponents to be the same. For multiplication, multiply the coefficients and then add the exponents. For division, divide the coefficients, then subtract the exponent of the divisor from the exponent of the dividend. To calculate the mass of the Hope Diamond, multiply the number of carbon atoms by the mass of a single carbon atom.. (4.6 × 10 23 atoms)(2 ×10 -23 g/atom) = 9.2 × 10 0 g = 9.2 g Note that any number raised to a power of 0 is equal to 1; thus, 9.2 × 10 0 g is equal to 9.2 g.. EXAMPLE Problem 2.3. Math Handbook. Multiplying and Dividing Numbers in Scientific Notation Solve the following problems. a. (2 × 10 3) × (3 × 10 2) b. (9 × 10 8) ÷ (3 × 10 -4) 1. Operations with Scientific Notation page 948. Analyze the Problem You are given numbers written in scientific notation to multiply and divide. For the multiplication problem, multiply the coefficients and add the exponents. For the division problem, divide the coefficients and subtract the exponent of the divisor from the exponent of the dividend. 9 × 10 8 _ 3 × 10 -4. 2. The exponent of the dividend is 8. The exponent of the divisor is -4.. Solve for the Unknown a. (2 × 10 3) × (3 × 10 2) 2×3=6 3+2=5 6 × 10 5 b. (9 × 10 8) ÷ (3 × 10 -4) 9÷3=3 8 - (-4) = 8 + 4 = 12 3 × 10 12. 3. State the problem. Multiply the coefficients. Add the exponents. Combine the parts. State the problem. Divide the coefficients. Subtract the exponents. Combine the parts.. Evaluate the Answer To test the answers, write out the original data and carry out the arithmetic. For example, Problem a becomes 2000 × 300 = 600,000, which is the same as 6 × 10 5.. PRACTICE Problems. Extra Practice Page 976 and glencoe.com. 15. Solve each problem, and express the answer in scientific notation. a. (4 × 10 2) × (1 × 10 8) c. (6 × 10 2) ÷ (2 × 10 1) b. (2 × 10 -4) × (3 × 10 2) d. (8 × 10 4) ÷ (4 × 10 1) 16. Challenge Calculate the areas and densities. Report the answers in the correct units. a. the area of a rectangle with sides measuring 3 × 10 1 cm and 3 × 10 -2 cm b. the area of a rectangle with sides measuring 1 × 10 3 cm and 5 × 10 -1 cm c. the density of a substance having a mass of 9 × 10 5 g and a volume of 3 × 10 -1 cm 3 d. the density of a substance having a mass of 4 × 10 -3 g and a volume of 2 × 10 -2 cm 3 Section 2.2 • Scientific Notation and Dimensional Analysis 43.
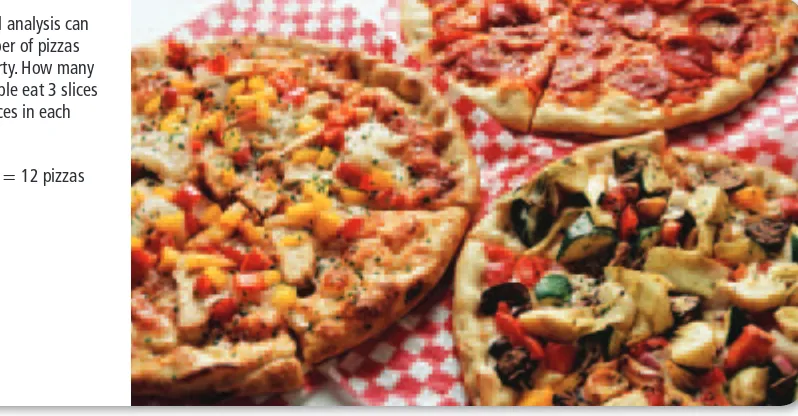
(15) Figure 2.8 Dimensional analysis can be used to calculate the number of pizzas that must be ordered for a party. How many pizzas will you need if 32 people eat 3 slices per person and there are 8 slices in each pizza?. ■. )( 8 slices ). 1 pizza 3 slices _ (32 people) _ = 12 pizzas person. (. Dimensional Analysis When planning a pizza party for a group of people, you might want to use dimensional analysis to figure out how many pizzas to order. Dimensional analysis is a systematic approach to problem solving that uses conversion factors to move, or convert, from one unit to another. A conversion factor is a ratio of equivalent values having different units. How many pizzas do you need to order if 32 people will attend a party, each person eats 3 slices of pizza, and each pizza has 8 slices? Figure 2.8 shows how conversion factors are used to calculate the number of pizzas needed for the party. Writing conversion factors As you just read, conversion factors are ratios of equivalent values. Not surprisingly, these conversion factors are derived from equality relationships, such as 12 eggs = 1 dozen eggs, or 12 inches = 1 foot. Multiplying a quantity by a conversion factor changes the units of the quantity without changing its value. Most conversion factors are written from relationships between units. For example, the prefixes in Table 2.2 on page 33 are the source of many conversion factors. From the relationship 1000 m = 1 km, the following conversion factors can be written. 1 km _ 1000 m. and. 1000 m _ 1 km. A derived unit, such as a density of 2.5 g/mL, can also be used as a conversion factor. The value shows that 1 mL of the substance has a mass of 2.5 g. The following two conversion factors can be written. 2.5 g _ 1 mL. and. 1 mL _ 2.5 g. Percentages can also be used as conversion factors. A percentage is a ratio; it relates the number of parts of one component to 100 total parts. For example, a fruit drink containing 10% sugar by mass contains 10 g of sugar in every 100 g of fruit drink. The conversion factors for the fruit drink are as follows. 10 g sugar __ 100 g fruit drink 44. Chapter 2 • Analyzing Data. ©Royalty-Free/Corbis. and. 100 g fruit drink __ 10 g sugar.
(16) PRACTICE Problems. Extra Practice Page 976 and glencoe.com. 17. Write two conversion factors for each of the following. a. a 16% (by mass) salt solution b. a density of 1.25 g/mL c. a speed of 25 m/s 18. Challenge What conversion factors are needed to convert: a. nanometers to meters? b. density given in g/cm 3 to a value in kg/m 3?. Using conversion factors A conversion factor used in dimensional analysis must accomplish two things: it must cancel one unit and introduce a new one. While working through a solution, all of the units except the desired unit must cancel. Suppose you want to know how many meters there are in 48 km. The relationship between kilometers and meters is 1 km = 1000 m. The conversion factors are as follows. 1 km _ 1000 m. and. 1000 m _ 1 km. Because you need to convert km to m, you should use the conversion factor that causes the km unit to cancel. 1000 m 48 km × _ = 48,000 m 1 km. When converting a value with a large unit, such as km, to a value with a smaller unit, such as m, the numerical value increases. For example, 48 km (a value with a large unit) converts to 48,000 m (a larger numerical value with a smaller unit). Figure 2.9 illustrates the connection between the numerical value and the size of the unit for a conversion factor. Now consider this question: How many eight-packs of water would you need if the 32 people attending your party each had two bottles of water? To solve the problem, identify the given quantities and the desired result. There are 32 people and each of them drinks two bottles of water. The desired result is the number of eight-packs. Using dimensional analysis yields the following.. 1 km __ 1000 m Figure 2.9 The two quantities shown above are equivalent; that is, 1 km = 1000 m. Note that a smaller numerical value (1) accompanies the larger unit (km), and a larger numerical value (1000) accompanies the smaller unit (m).. ■. 1 eight-pack 8 bottles. 2 bottles _ = 8 eight-packs 32 people × _ person ×. PRACTICE Problems. Extra Practice Page 976 and glencoe.com. Use Table 2.2 on page 33 to solve each of the following.. 19. a. Convert 360 s to ms. e. Convert 2.45 × 10 2 ms to s. b. Convert 4800 g to kg. f. Convert 5 µm to km. c. Convert 5600 dm to m. g. Convert 6.800 × 10 3 cm to km. d. Convert 72 g to mg. h. Convert 2.5 × 10 1 kg to Mg. 20. Challenge Write the conversion factors needed to determine the number of seconds in one year.. Section 2.2 • Scientific Notation and Dimensional Analysis 45.
(17) EXAMPLE Problem 2.4 Using Conversion Factors In ancient Egypt, small distances were measured in Egyptian cubits. An Egyptian cubit was equal to 7 palms, and 1 palm was equal to 4 fingers. If 1 finger was equal to 18.75 mm, convert 6 Egyptian cubits to meters. 1. Math Handbook Unit Conversion pages 957–958. Analyze the Problem A length of 6 Egyptian cubits needs to be converted to meters. Known length = 6 Egyptian cubits 7 palms = 1 cubit. 2. 1 palm = 4 fingers 1 finger = 18.75 mm. Unknown length = ? m. 1 m = 0.001 mm. Solve for the Unknown Use dimensional analysis to convert the units in the following order. cubits → palms → fingers → millimeters → meters 4 fingers 7 palms 1 meter 18.75 mm 6 cubits × _ × _ × _ × _ = ? m 1 cubit. 1 palm. 1 finger. 1000 m. 4 fingers 7 palms 1 meter 18.75 mm 6 cubits × _ × _ × _ × _ = 3.150 m 1 cubit. 3. 1 palm. 1 finger. 1000 mm. Multiply by a series of conversion factors that cancels all the units except meter, the desired unit. Multiply and divide the numbers as indicated, and cancel the units.. Evaluate the Answer Each conversion factor is a correct restatement of the original relationship, and all units except for the desired unit meters cancel.. PRACTICE Problems. Extra Practice Page 976 and glencoe.com. 21. The speedometer at right displays a car’s speed in miles per hour. What is the car’s speed in km/h? (1 km = 0.62 mile) 22. How many seconds are in 24 h? 23. Challenge Vinegar is 5% acetic acid by mass and has a density of 1.02 g/mL. What mass of acetic acid, in grams, is present in 185 mL of vinegar?. Section 2.2. Assessment. Section Summary ◗ A number expressed in scientific notation is written as a coefficient between 1 and 10 multiplied by 10 raised to a power.. 24.. MAIN Idea Describe how scientific notation makes it easier to work with very large or very small numbers.. 25. Express the numbers 0.00087 and 54,200,000 in scientific notation. 26. Write the measured distance quantities 3 × 10 -4 cm and 3 × 10 4 km in regular notation.. ◗ To add or subtract numbers in scientific notation, the numbers must have the same exponent.. 27. Write a conversion factor relating cubic centimeters and milliliters.. ◗ To multiply or divide numbers in scientific notation, multiply or divide the coefficients and then add or subtract the exponents, respectively.. 29. Explain how dimensional analysis is used to solve problems.. ◗ Dimensional analysis uses conversion factors to solve problems.. 31. Organize Create a flowchart that outlines when to use dimensional analysis and when to use scientific notation.. 46. Chapter 2 • Analyzing Data. 28. Solve How many millimeters are there in 2.5 × 10 2 km? 30. Apply Concepts A classmate converts 68 km to meters and gets 0.068 m as the answer. Explain why this answer is incorrect, and identify the likely source of the error.. Self-Check Quiz glencoe.com.
(18) Section 2.3 Objectives. Uncertainty in Data. ◗ Define and compare accuracy and precision. ◗ Describe the accuracy of experimental data using error and percent error. ◗ Apply rules for significant figures to express uncertainty in measured and calculated values.. Real-World Reading Link When making cookies from a recipe, amounts are measured in cups, tablespoons, and teaspoons. Would a batch of cookies turn out well if you measured all of the ingredients using only a teaspoon? Most likely not, because measurement errors would build up.. Review Vocabulary. Accuracy and Precision. experiment: a set of controlled observations that test a hypothesis. Just as each teaspoon you measure in the kitchen contains some amount of error, so does every scientific measurement made in a laboratory. When scientists make measurements, they evaluate both the accuracy and the precision of the measurements. Although you might think that the terms accuracy and precision basically mean the same thing, to a scientist, they have very different meanings. Accuracy refers to how close a measured value is to an accepted value. Precision refers to how close a series of measurements are to one another. The archery target in Figure 2.10 illustrates the difference between accuracy and precision. For this example, the center of the target is the accepted value.. New Vocabulary accuracy precision error percent error significant figure. MAIN Idea Measurements contain uncertainties that affect how a calculated result is presented.. ■ Figure 2.10 An archery target illustrates the difference between accuracy and precision. An accurate shot is located near the bull’s-eye; precise shots are grouped closely together. Apply Why doesn’t it make sense to discuss the precision of the arrow location in the drawing labeled Accurate?. Interactive Figure To see an animation of precision and accuracy, visit glencoe.com.. Accurate and precise. Accurate. Precise but not accurate. Not accurate or precise. Arrows in the center indicate high accuracy. Arrows close together indicate high precision.. An arrow in the center indicates high accuracy.. Arrows far from the center indicate low accuracy. Arrows close together indicate high precision.. Arrows far from the center indicate low accuracy. Arrows far apart indicate low precision.. Section 2.3 • Uncertainty in Data 47.
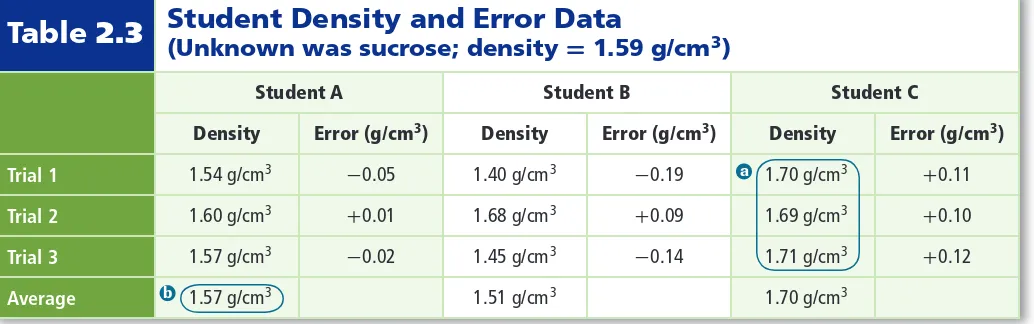
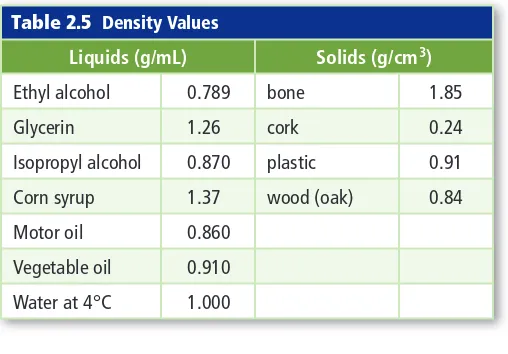
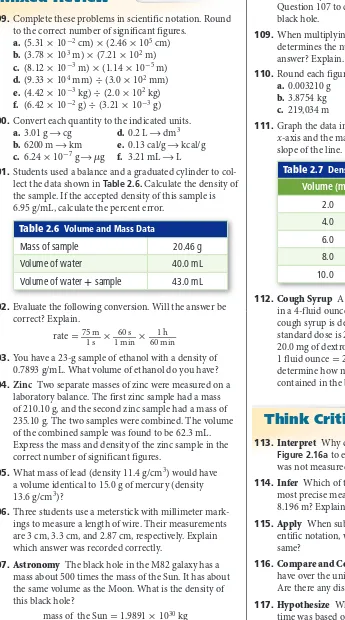
(19) Density and Error Data Table 2.3 Student (Unknown was sucrose; density = 1.59 g/cm 3) Student A. Student B. Student C. Density. Error (g/cm 3). Density. Error (g/cm 3). Trial 1. 1.54 g/cm 3. -0.05. 1.40 g/cm 3. -0.19. Trial 2. 1.60 g/cm 3. +0.01. 1.68 g/cm 3. Trial 3. 1.57 g/cm 3. -0.02. 1.45 g/cm 3. Average. b. 1.57 g/cm 3. a These trial values are the most precise. b This average is the most accurate.. Personal Tutor For an online tutorial on precision measurement, visit glencoe.com.. 1.51 g/cm 3. Density. Error (g/cm 3). 1.70 g/cm 3. +0.11. +0.09. 1.69 g/cm 3. +0.10. -0.14. 1.71 g/cm 3. +0.12. a. 1.70 g/cm 3. Consider the data in Table 2.3. Students were asked to find the density of an unknown white powder. Each student measured the volume and mass of three separate samples. They reported calculated densities for each trial and an average of the three calculations. The powder, sucrose (table sugar), has a density of 1.59 g/cm 3. Which student collected the most accurate data? Who collected the most precise data? Student A’s measurements are the most accurate because they are closest to the accepted value of 1.59 g/cm 3. Student C’s measurements are the most precise because they are the closest to one another. Recall that precise measurements might not be accurate. Looking at just the average of the densities can be misleading. Based solely on the average, Student B appears to have collected fairly reliable data. However, on closer inspection, Student B’s data are neither accurate nor precise. The data are not close to the accepted value, nor are they close to one another. Error and percent error The density values reported in Table 2.3 are experimental values, which means they are values measured during an experiment. The known density of sucrose is an accepted value, which is a value that is considered true. To evaluate the accuracy of experimental data, you can compare how close the experimental value is to the accepted value. Error is defined as the difference between an experimental value and an accepted value. The errors for the experimental density values are also given in Table 2.3.. VOCABULARY WORD ORIGIN Percent comes from the Latin words per, which means by, and centum, which means 100. Error Equation. error = experimental value - accepted value The error associated with an experimental value is the difference between the experimental value and the accepted value.. Scientists often want to know what percent of the accepted value an error represents. Percent error expresses error as a percentage of the accepted value.. Percent Error Equation error percent error = __ × 100 accepted value The percent error of an experimental value equals to the absolute value of its error divided by the accepted value, multiplied by 100.. 48. Chapter 2 • Analyzing Data.
(20) Notice that the percent-error equation uses the absolute value of the error. This is because only the size of the error matters; it does not matter whether the experimental value is larger or smaller than the accepted value. Reading Check Name the type of error that involves a ratio.. Percent error is an important concept for the machinist who made the nut shown in Figure 2.11. The machinist must check the tolerances of the nut. Tolerances are a narrow range of allowable dimensions based on acceptable amounts of error. If the dimensions of the nut do not fall within the acceptable range—that is, the nut exceeds its tolerances—it will be retooled or possibly discarded.. EXAMPLE Problem 2.5 Calculating Percent Error Use Student A’s density data in Table 2.3 to calculate the percent error in each trial. Report your answers to two places after the decimal point. 1. Math Handbook Percents page 965. Analyze the Problem You are given the errors for a set of density calculations. To calculate percent error, you need to know the accepted value for density, the errors, and the equation for percent error. Known accepted value for density = 1.59 g/cm 3 errors: -0.05 g/cm 3; 0.01 g/cm 3; -0.02 g/cm 3. 2. Unknown percent errors = ?. Solve for the Unknown error accepted value. percent error = __ × 100 3. -0.05 g/cm percent error = __ × 100 = 3.14% 3 1.59 g/cm 3. 0.01 g cm percent error = _ × 100 = 0.63% 3 1.59 g/cm. 3. -0.02 g/cm percent error = __ × 100 = 1.26% 3 1.59 g/cm. 3. Figure 2.11 This digital caliper is being used to check the size of a nut to one-hundredth of a millimeter (0.01 mm). Skill is required to correctly position the part in the caliper. Experienced machinists will obtain more precise and more accurate readings than inexperienced machinists... ■. State the percent error equation. Substitute error = -0.05 g/cm 3, and solve. Substitute error = 0.01 g/cm 3, and solve. Substitute error = -0.02 g/cm 3, and solve.. Evaluate the Answer The percent error is greatest for Trial 1, which had the largest error, and smallest for Trial 2, which was closest to the accepted value.. PRACTICE Problems. Extra Practice Page 976 and glencoe.com. Answer the following questions using data from Table 2.3.. 32. Calculate the percent errors for Student B’s trials. 33. Calculate the percent errors for Student C’s trials. 34. Challenge Based on percent error, which student’s trial was the most accurate? The least accurate?. Section 2.3 • Uncertainty in Data 49 ©Chris Gibson/Alamy.
(21) PROBLEM-SOLVING Lab Identify an Unknown How can mass and volume data for an unknown sample be used to identify the unknown? A student collected several samples from a stream bed that looked like gold. She measured the mass of each sample and used water displacement to determine each sample’s volume. Her data are given in the table. Mass and Volume Data for an Unknown Sample Initial Volume Final Volume (water only) (water + sample). Sample. Mass. 1. 50.25 g. 50.1 mL. 60.3 mL. 2. 63.56 g. 49.8 mL. 62.5 mL. 3. 57.65 g. 50.2 mL. 61.5 mL. 4. 55.35 g. 45.6 mL. 56.7 mL. 5. 74.92 g. 50.3 mL. 65.3 mL. 6. 67.78 g. 47.5 mL. 60.8 mL. Analysis For a given sample, the difference in the volume measurements made with the graduated cylinder yields the volume of the sample. Thus, for each sample, the mass and volume are known, and the density can be calculated. Note that density is a property of matter that can often be used to identify an unknown sample. Think Critically. Significant Figures Often, precision is limited by the tools available. For example, a digital clock that displays the time as 12:47 or 12:48 can record the time only to the nearest minute. With a stopwatch, however, you might record time to the nearest hundredth second. As scientists have developed better measuring devices, they have been able to make more precise measurements. Of course, for measurements to be both accurate and precise, the measuring devices must be in good working order. Additionally, accurate and precise measurements rely on the skill of the person using the instrument; the user must be trained and use proper techniques. The precision of a measurement is indicated by the number of digits reported. A value of 3.52 g is more precise than a value of 3.5 g. The reported digits are called significant figures. Significant figures include all known digits plus one estimated digit. Consider the rod in Figure 2.12. The end of the rod falls between 5.2 cm and 5.3 cm. The 5 and 2 are known digits corresponding to marks on the ruler. To these known digits, an estimated digit is added. This last digit estimates the rod’s location between the second and third millimeter marks. Because it is an estimate, one person might report the measurement as 5.22 cm and another as 5.23 cm. Either way, the measurement has three significant figures—two known and one estimated. Remember that measurements reported with a lot of significant figures might be precise but not accurate. For example, some chemistry labs have balances that report mass to the nearest hundreth of a gram. If you and each of your classmates measured the same copper cylinder on the same scale, you would probably have a group of very precise measurements. But what if the scale had been previously damaged by an object that was too large for it? Your precise measurements would not be very accurate.. 1. Calculate the volume and density for each sample and the average density of the six samples. Be sure to use significant figure rules. 2. Apply The student hopes the samples are gold, which has a density of 19.3 g/cm 3. A local geologist suggested the samples might be pyrite, which is a mineral with a density of 5.01 g/cm 3. What is the identity of the unknown sample? 3. Calculate the error and percent error of each sample. Use the density value given in Question 2 as the accepted value. 4. Conclude Was the data collected by the student accurate? Explain your answer.. 50. Chapter 2 • Analyzing Data. Figure 2.12 The markings on the ruler represent known digits. The reported measurement includes the known digits plus the estimated digit. The measurement is 5.23 cm. Infer What is the estimated digit if the length of an object being measured falls exactly on the 5-cm mark? ■. 0.03 cm is an estimated digit. 0.2 cm is a known digit Centimeters. 5 cm is a known digit.
(22) Problem-Solving Strategy Recognizing Significant Figures Learning these five rules for recognizing significant figures will help you when solving problems. Examples of each rule are shown below. Note that each of the highlighted examples has three significant figures. Rule 1. Nonzero numbers are always significant.. 72.3 g has three.. Rule 2. Zeros between nonzero numbers are always significant.. 60.5 g has three.. Rule 3. All final zeros to the right of the decimal are significant.. 6.20 g has three.. Rule 4. Placeholder zeroes are not significant. To remove placeholder zeros, rewrite the number in scientific notation.. 0.0253 g and 4320 g (each has three). Rule 5. Counting numbers and defined constants have an infinite number of significant figures.. 6 molecules 60 s = 1 min. EXAMPLE Problem 2.6 Significant Figures Determine the number of significant figures in the following masses. a. 0.00040230 g b. 405,000 kg 1. Math Handbook Significant Figures pages 949–951. Analyze the Problem You are given two measured mass values. Apply the appropriate rules to determine the number of significant figures in each value.. 2. Solve for the Unknown Count all nonzero numbers, zeros between nonzero numbers, and final zeros to the right of the decimal place. (Rules 1, 2, and 3) Ignore zeros that act as placeholders. (Rule 4) a. 0.00040230 g has five significant figures. b. 405,000 kg has three significant figures.. 3. Evaluate the Answer One way to verify your answers is to write the values in scientific notation: 4.0230 × 10 -4 g and 4.05 × 10 5 kg. Without the placeholder zeros, it is clear that 0.00040230 g has five significant figures and that 405,000 kg has three significant figures.. PRACTICE Problems. Extra Practice Page 977 and glencoe.com. Determine the number of significant figures in each measurement.. 35. a. 508.0 L c. 1.0200 × 10 5 kg b. 820,400.0 L d. 807,000 kg 36. a. 0.049450 s c. 3.1587 × 10 -4 g b. 0.000482 mL d. 0.0084 mL 37. Challenge Write the numbers 10, 100, and 1000 in scientific notation with two, three, and four significant figures, respectively. Section 2.3 • Uncertainty in Data 51.
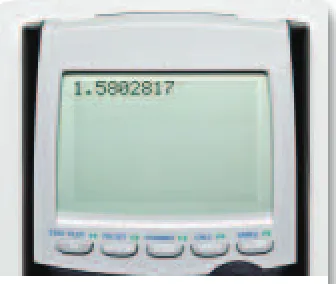
(23) Rounding Numbers. Figure 2.13 You need to apply the rules of significant figures and rounding to report a calculated value correctly.. ■. Calculators perform flawless arithmetic, but they are not aware of the number of significant figures that should be reported in the answer. For example, a density calculation should not have more significant figures than the original data with the fewest significant figures. To report a value correctly, you often need to round. Consider an object with a mass of 22.44 g and volume of 14.2 cm 3. When you calculate the object’s density using a calculator, the displayed answer is 1.5802817 g/cm 3, as shown in Figure 2.13. Because the measured mass had four significant figures and the measured volume had three, it is not correct to report the calculated density value with eight significant figures. Instead, the density must be rounded to three significant figures, or 1.58 g/cm 3. Consider the value 3.515014. How would you round this number to five significant figures? To three significant figures? In each case, you need to look at the digit that follows the desired last significant figure. To round to five digits, first identify the fifth significant figure, in this case 0, and then look at the number to its right, in this case 1. Last significant figure. 3.515014 Number to right of last significant figure. Do not change the last significant figure if the digit to its right is less than five. Because a 1 is to the right, the number rounds to 3.5150. If the number had been 5 or greater, you would have rounded up. To round to three digits, identify the third significant figure, in this case 1, and then look at the number to its right, in this case 5. Last significant figure. 3.515014 Number to right of last significant figure. If the digits to the right of the last significant figure are a 5 followed by 0, then look at the last significant figure. If it is odd, round it up; if it is even, do not round up. Because the last significant digit is odd (1), the number rounds up to 3.52.. Problem-Solving Strategy Rounding Numbers Learn these four rules for rounding, and use them when solving problems. Examples of each rule are shown below. Note that each example has three significant figures.. 52. 2.532. →. 2.53. Rule 1. If the digit to the right of the last significant figure is less than 5, do not change the last significant figure.. 2.536. →. 2.54. Rule 2. If the digit to the right of the last significant figure is greater than 5, round up the last significant figure.. 2.5351. →. 2.54. Rule 3. If the digits to the right of the last significant figure are a 5 followed by a nonzero digit, round up the last significant figure.. 2.5350 2.5250. → →. 2.54 2.52. Rule 4. If the digits to the right of the last significant figure are a 5 followed by 0 or no other number at all, look at the last significant figure. If it is odd, round it up; if it is even, do not round up.. Chapter 2 • Analyzing Data. Matt Meadows.
(24) PRACTICE Problems. Extra Practice Page 949 and glencoe.com. 38. Round each number to four significant figures. a. 84,791 kg c. 256.75 cm b. 38.5432 g d. 4.9356 m 39. Challenge Round each number to four significant figures, and write the answer in scientific notation. a. 0.00054818 g c. 308,659,000 mm b. 136,758 kg d. 2.0145 mL. Addition and subtraction When you add or subtract measurements, the answer must have the same number of digits to the right of the decimal as the original value having the fewest number of digits to the right of the decimal. For example, the measurements 1.24 mL, 12.4 mL, and 124 mL have two, one, and zero digits to the right of the decimal, respectively. When adding or subtracting, arrange the values so that the decimal points align. Identify the value with the fewest places after the decimal point, and round the answer to that number of places. Multiplication and division When you multiply or divide numbers, your answer must have the same number of significant figures as the measurement with the fewest significant figures.. EXAMPLE Problem 2.7. Math Handbook. Rounding Numbers When Adding A student measured the length of his lab partners’ shoes. If the lengths are 28.0 cm, 23.538 cm, and 25.68 cm, what is the total length of the shoes? 1. Calculations with Significant Figures pages 952–953. Analyze the Problem The three measurements need to be aligned on their decimal points and added. The measurement with the fewest digits after the decimal point is 28.0 cm, with one digit. Thus, the answer must be rounded to only one digit after the decimal point.. 2. Solve for the Unknown 28.0 cm 23.538 cm + 25.68 cm ______ 77.218 cm The answer is 77.2 cm.. 3. Align the measurements and add the values.. Round to one place after the decimal; Rule 1 applies.. Evaluate the Answer The answer, 77.2 cm, has the same precision as the least-precise measurement, 28.0 cm.. PRACTICE Problems. Extra Practice Page 977 and glencoe.com. 40. Add and subtract as indicated. Round off when necessary. a. 43.2 cm + 51.0 cm + 48.7 cm b. 258.3 kg + 257.11 kg + 253 kg 41. Challenge Add and subtract as indicated. Round off when necessary. a. (4.32 × 10 3 cm) - (1.6 × 10 6 mm) b. (2.12 × 10 7 mm) + (1.8 × 10 3 cm). Section 2.3 • Uncertainty in Data 53.
(25) EXAMPLE Problem 2.8. Math Handbook. Rounding Numbers When Multiplying Calculate the volume of a book with the following dimensions: length = 28.3 cm, width = 22.2 cm, height = 3.65 cm. 1. Rounding page 952. Analyze the Problem Volume is calculated by multiplying length, width, and height. Because all of the measurements have three significant figures, the answer also will. Known length = 28.3 cm width = 22.2 cm. 2. Unknown Volume = ? cm 3. height = 3.65 cm. Solve for the Unknown Calculate the volume, and apply the rules of significant figures and rounding. Volume = length × width × height State the formula for the volume of a rectangle. 3 Volume = 28.3 cm × 22.2 cm × 3.65 cm = 2293.149 cm Substitute values, and solve. Volume = 2290 cm 3 Round the answer to three significant figures.. 3. Evaluate the Answer To check if your answer is reasonable, round each measurement to one significant figure and recalculate the volume. Volume = 30 cm × 20 cm × 4 cm = 2400 cm 3. Because this value is close to your calculated value of 2290 cm 3, it is reasonable to conclude the answer is correct.. PRACTICE Problems. Extra Practice Page 976 and glencoe.com. Perform the following calculations. Round the answers.. 42. a. 24 m × 3.26 m b. 120 m × 0.10 m c. 1.23 m × 2.0 m 43. a. 4.84 m ÷ 2.4 s b. 60.2 m ÷ 20.1 s c. 102.4 m ÷ 51.2 s 3 2 3 44. Challenge (1.32 × 10 g) ÷ (2.5 × 10 cm ). Section 2.3. Assessment. Section Summary. 45.. ◗ An accurate measurement is close to the accepted value. A set of precise measurements shows little variation.. 46. Define accuracy and precision.. ◗ The measurement device determines the degree of precision possible. ◗ Error is the difference between the measured value and the accepted value. Percent error gives the percent deviation from the accepted value. ◗ The number of significant figures reflects the precision of reported data. ◗ Calculations are often rounded to the correct number of significant figures.. MAIN Idea State how a measured value is reported in terms of known and estimated digits.. 47. Identify the number of significant figures in each of these measurements of an object’s length: 76.48 cm, 76.47 cm, and 76.59 cm. 48. Apply The object in Question 47 has an actual length of 76.49 cm. Are the measurements in Question 47 accurate? Are they precise? 49. Calculate the error and percent error for each measurement in Question 47. 50. Apply Write an expression for the quantity 506,000 cm in which it is clear that all the zeros are significant. 51. Analyze Data Students collected mass data for a group of coins. The mass of a single coin is 5.00 g. Determine the accuracy and precision of the measurements. Number of coins Mass (g). 54. Chapter 2 • Analyzing Data. d. 53.0 m × 1.53 m d. 168 m ÷ 58 s. 5. 10. 20. 30. 50. 23.2. 54.5. 105.9. 154.5. 246.2. Self-Check Quiz glencoe.com.
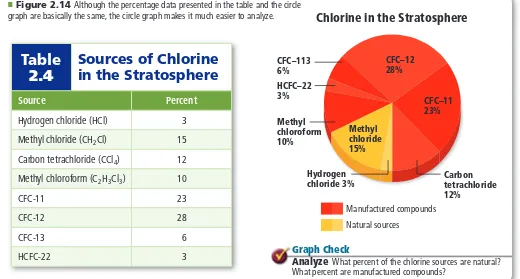
(26) Section 2.4. Representing Data. Objectives ◗ Create graphs to reveal patterns in data. ◗ Interpret graphs.. MAIN Idea Graphs visually depict data, making it easier to see patterns and trends. Real-World Reading Link Have you ever heard the saying, “A picture is worth a thousand words”? A graph is a “picture” of data. Scientists use graphs to present data in a form that allows them to analyze their results and communicate information about their experiments.. Review Vocabulary independent variable: the variable that is changed during an experiment. New Vocabulary. Graphing. graph. When you analyze data, you might set up an equation and solve for an unknown, but this is not the only method scientists have for analyzing data. A goal of many experiments is to discover whether a pattern exists in a certain situation. Does raising the temperature change the rate of a reaction? Does a change in diet affect a rat’s ability to navigate a maze? When data are listed as shown in Table 2.4, a pattern might not be obvious. However, using data to create a graph can help to reveal a pattern if one exists. A graph is a visual display of data. Circle graphs Newspapers and magazines often feature circle graphs. A circle graph, like the one shown in Figure 2.14, is sometimes called a pie chart because it is divided into wedges that look like a pie. A circle graph is useful for showing parts of a fixed whole. The parts are usually labeled as percents with the whole circle representing 100%. The circle graph shown in Figure 2.14 is based on the percentage data given in Table 2.4. Figure 2.14 Although the percentage data presented in the table and the circle graph are basically the same, the circle graph makes it much easier to analyze.. ■. Table 2.4. Sources of Chlorine in the Stratosphere. Source. Percent. Hydrogen chloride (HCl). 3. Methyl chloride (CH 2Cl). 15. Carbon tetrachloride (CCl 4). 12. Methyl chloroform (C 2H 3Cl 3). 10. CFC-11. 23. CFC-12. 28. CFC-13. 6. HCFC-22. 3. Chlorine in the Stratosphere. CFC–12 28%. CFC–113 6% HCFC–22 3% Methyl chloroform 10%. CFC–11 23% Methyl chloride 15%. Hydrogen chloride 3%. Carbon tetrachloride 12%. Manufactured compounds Natural sources. Graph Check Analyze What percent of the chlorine sources are natural? What percent are manufactured compounds?. Section 2.4 • Representing Data 55.
(27) Figure 2.15 A bar graph is an effective way to present and compare data. This graph shows various dietary sources of the element magnesium. Magnesium plays an important role in the health of your muscles, nerves, and bones.. ■. Dietary Sources of Magnesium. Magnesium content (mg). 90 80 70 60 50 40 30 20 10 0. Halibut (3 oz). Almonds (1 oz). Cashews (1 oz). Spinach (½ cup). Baked Bran flakes Kidney potato (¾ cup) beans (medium) (½ cup). Raisins (¼ cup). Food Serving. Graph Check Interpret Which two food servings provide equal amounts of magnesium?. Personal Tutor For an online tutorial on graphing, visit glencoe.com.. &/,$!",%3. Incorporate information from this section into your Foldable.. Bar graphs A bar graph is often used to show how a quantity varies across categories. Examples of categories include time, location, and temperature. The quantity being measured appears on the vertical axis (y-axis). The independent variable appears on the horizontal axis (x-axis). The relative heights of the bars show how the quantity varies. A bar graph can be used to compare population figures for a single country by decade or the populations of multiple countries at the same point in time. In Figure 2.15, the quantity being measured is magnesium, and the category being varied is food servings. When examining the graph, you can quickly see how the magnesium content varies for these food servings. Line Graphs In chemistry, most graphs that you create and interpret will be line graphs. The points on a line graph represent the intersection of data for two variables.. Careers In chemistry Calibration Technician Accurate and repeatable measurements are essential to chemists working in research and industry. An instrument calibration technician adjusts, troubleshoots, maintains, and repairs the instruments used in laboratories and manufacturing plants. Their jobs require an understanding of the instrument’s electronics and the use of computers and calibration software. For more information on chemistry careers, visit glencoe.com.. 56 Chapter 2 • Analyzing Data. Independent and dependent variables The independent variable is plotted on the x-axis. The dependent variable is plotted on the y-axis. Remember that the independent variable is the variable that a scientist deliberately changes during an experiment. In Figure 2.16a, the independent variable is volume and the dependent variable is mass. What are the values for the independent variable and the dependent variable at Point B? Figure 2.16b is a graph of temperature versus elevation. Because the data points do not fit perfectly, the line cannot pass exactly through all of the points. The line must be drawn so that about as many points fall above the line as fall below it. This line is called a best-fit line. Relationships between variables If the best-fit line for a set of data is straight, there is a linear relationship between the variables and the variables are said to be directly related. The relationship between the variables can be described further by analyzing the steepness, or slope, of the line..
(28) Slope Equation ∆y _ y2 - y1 rise _ slope = _ run = ∆x = x 2 - x 1. a Density of Aluminum C. (20.0 cm3, 54 g). Mass (g). If the best-fit line rises to the right, then the slope of the line is positive. A positive slope indicates that the dependent variable increases as the independent variable increases. If the best-fit line sinks to the right, then the slope of the line is negative. A negative slope indicates that the dependent variable decreases as the independent variable increases. In either case, the slope of the line is constant. You can use two pairs of data points to calculate the slope of the line. The slope is the rise, or change in y, denoted as ∆y, divided by the run, or change in x, denoted as ∆x.. B A (10.0 cm3, 27 g). Volume (cm3) y 2, y 1, x 2, and x 1 are values from data points (x 1, y 1) and (x 2, y 2).. b Temperature v. Elevation Temperature (ºC). The slope of a line is equal to the change in y divided by the change in x.. When the mass of a material is plotted against its volume, the slope of the line represents the material’s density. An example of this is shown in Figure 2.16a. To calculate the slope of the line, substitute the x and y values for Points A and B in the slope equation and solve. 54 g - 27 g 20.0 cm - 10.0 cm 27 g = _3 10.0 cm. slope = __ 3 3. = 2.7g/cm 3 Thus, the slope of the line, and the density, is 2.7g/cm 3. When the best-fit line is curved, the relationship between the variables is nonlinear. In chemistry, you will study nonlinear relationships called inverse relationships.. 21 20 19 18 17 16 15 0. 0 100. 300. 500. 700. Elevation (m). Figure 2.16 Both of these line graphs show linear relationships. The slope of each line is defined as the ratio of rise over run.. ■. Graph Check Identify the graph that shows a direct relationship.. Interpreting Graphs You should use an organized approach when analyzing graphs. First, note the independent and dependent variables. Recall that the y-axis data depends on the x-axis value. Next, decide if the relationship between the variables is linear or nonlinear. If the relationship is linear, is the slope positive or negative? Interpolation and extrapolation When points on a line graph are connected, the data is considered to be continuous. Continuous data allows you to read the value from any point that falls between the recorded data points. This process is called interpolation. For example, from Figure 2.16b, what is the temperature at an elevation of 350 m? To interpolate this value, first locate 350 m on the x-axis; it is located halfway between 300 m and 400 m. Project upward until you hit the plotted line, and then project that point horizontally to the left until you reach the y-axis. The temperature at 350 m is approximately 17.8°C. You can also extend a line beyond the plotted points in order to estimate values for the variables. This process is called extrapolation. It is important to be very careful with extrapolation, however, as it can easily lead to errors and result in very inaccurate predictions. Reading Check Explain why extrapolation might be less reliable. than interpolation. Section 2.4 • Representing Data 57.
(29) Figure 2.17 The two lines in this graph represent average ozone levels for two time periods, 1957–1972 and 1999–2000. The graph shows clearly that ozone levels in recent years have been lower overall than in 1957–1972.. ■. Ozone Measurements at Halley Total ozone (DU). 400. Graph Check Interpret By how much did the. 1957–1972. 300 200. 1999 – 2000. 100 0 Aug. total ozone vary during the 9-month period shown for 1999–2000?. Sep. Oct. Nov. Dec. Jan. Feb. Mar. Apr. Month. Interpreting ozone data The value of using graphs to visualize data is illustrated by Figure 2.17. These important ozone measurements were taken at the Halley Research Station in Antarctica. The graph shows how ozone levels vary from August to April. The independent and dependent variables are the month and the total ozone, respectively. Each line on the graph represents a different period of time. The red line represents average ozone levels from 1957 to 1972, during which time ozone levels varied from about 285 DU (Dobson units) to 360 DU. The green line shows the ozone levels from the 1999–2000 survey. At no point during this nine-month period were the ozone levels as high as they were at corresponding times during 1957–1972. The graph makes the ozone hole clearly evident—it is represented by the dip in the green line. Having data from two time periods on the same graph allows scientists to compare recent data with data from a time before the ozone hole existed. Graphs similar to Figure 2.17 helped scientists identify a significant trend in ozone levels and verify the depletion in ozone levels over time.. Section 2.4. Assessment. Section Summary. 52.. ◗ Circle graphs show parts of a whole. Bar graphs show how a factor varies with time, location, or temperature.. 53. Infer What type of data must be plotted on a graph for the slope of the line to represent density?. ◗ Independent (x-axis) variables and dependent (y-axis) variables can be related in a linear or a nonlinear manner. The slope of a straight line is defined as rise/run, or ∆y/∆x. ◗ Because line-graph data are considered continuous, you can interpolate between data points or extrapolate beyond them.. 58 Chapter 2 • Analyzing Data. MAIN Idea. Explain why graphing can be an important tool for analyzing data.. 54. Relate If a linear graph has a negative slope, what can you say about the dependent variable? 55. Summarize What data are best displayed on a circle graph? On a bar graph? 56. Construct a circle graph for the composition of air: 78.08% N, 20.95% O 2, 0.93% Ar, and 0.04% CO 2 and other gases. 57. Infer from Figure 2.17 how long the ozone hole lasts. 58. Apply Graph mass versus volume for the data given in the table. What is the slope of the line? Volume (cm 3). 7.5. 12. 15. 22. Mass (g). 24.1. 38.5. 48.0. 70.1. Self-Check Quiz glencoe.com.
Figure
+7
Outline
Related documents
Three extensions to the current work include extending the Steve Lewis case in chapter 4 as a complex ANP model that include economic, social, political and religious clusters,
Perform the previous example of figures rules are exact numbers are significant figures rules topic of magnitude of significant number of calculation are three considerable
In addressing the first research question it seems that online and blended adult learners perceive a decrease in social participation ( M =2.74, SD =0.58) and bonding social capital
10.1.1 The rounding rules described in Section 10 must be used to report data to the proper number of significant figures. This section describes how to determine the proper
Based on the problem above, the researcher would like to conduct the research which aimed to find out whether or not picture series improve students’ reading
In the city of Borken, county of Kassel, and city of Essen, the administrations, public and private or- ganizations, and private citizens alike managed various challenges, such
Scientific notation also allows numbers to be expressed in a form that clarifies the number of significant figures.. A shortcut for converting a number from decimal form to
This paper synthesises the results of three participatory action research (PAR) studies undertaken to improve the integration of evidence-based practice (EBP) education in
