Comparison of Calcite
(CaCO
3
) and Clay
(Illite/Kaolinite) Toward the Influence of Maturation
and Organic Material Potential for Processing of Oil
Shale Material
Ordas Dewanto
1,a, Bambang Soegijono
2,b, Suharso
3,c1
Faculty of Maths and Science, University of Indonesia, Depok 16424
2Faculty of Maths and Science, University of Indonesia, Depok 16424 3Faculty of Maths and Science, University of Lampung, Bandar Lampung 35145
a[email protected], b[email protected], c[email protected]
Abstract--
To heat shale material on certain temperature can alter its organic compound and change it physically and chamically which then can produce energy resources such as oil and gas. Researcher has sucessfully conducted a synthesis on shale material using illite and calcite as the basis. The outcome shows that those materials are acted suitably as oil shale. SEM and XRD analysis outcome show that both shale materials have small pores because the pores cavity evenly filled by organic material, accumulated and bound strongly with illite, kaolinite or calcite, and other materials in small percentage. Moreover, the temperature to change shale material into crude oil (Tmax) on both materials is well-suited to oil shale, i.e. 421OC-453OC. Tmax of carbonate- organic (400OC-450OC) is higher than clay-organic (325OC-430OC). The formation of gas on carbonate-organic (T-over=750OC-1000OC) is higher than clay-organic (T-over=650O C-900OC). The outcome of TGA and Pyrolysis analysis also show similarity, i.e., all three materials have maximum maturation level on 322OC, 323OC, and 493OC, indicating different thermal maturation level in which carbonate shale needs higher temperature and longer time than clay shale. Outcome of pyrolysis suggests clay-organic hydrocarbon has a better potential (PY=605,06-652,45 mg/g and TOC=19,94-34,38%) than carbonate-organic (PY=164,53 mg/g and TOC=9,14%). Combination between Hydrogen Index (HI) and Tmax shows clay-organic taking role as oil shale that more likely potential to be oil and gas, while carbonate-organic is not a perfect oil shale yet.
Index Term-- oil shale, clay-organic, carbonate-organic, Tmax, hydrocarbon potential
1. INTRODUCTION
The dwindling amount of resources and the escalating price of petroleum have directed more attention to oil shale as energy source. Brendow (2003), Alali (2006), Al Hasan (2006), Peters et al (2005) are those who conducted research about oil shale. Based on Bartis et al (2005), exploitation of shale material is gathered and sent to be processed by directly burning the shale which then used as source of electrical energy. Bartis et al also did underground shale material mining using room and pillar mining method. Burhnham et alI (2006 ) did ex-situ process on extraction of shale material. Research on oil shale exploitation outcome combined with a huge amount of ash is conducted by Al-Hamaiedh et al, 2010).
Subono, Siswoyo (1995) and Dewanto (2008) has conducted research on conversion that involved heating shale material in the absence of oxygen in certain temperature until the material decomposes into gas, condensed oil and solid residue. The common temperature of this is at 842OF and 932OF (Youngquist dan Walter, 1998). Decomposition process was begun at relatively low temperature (300OC/570OF), but faster and more complete outcome produced at higher temperature (Koel and Mihkel, 1999).
Many companies possess patented method to process the shale material, but most of it are still on experimentall phase. Hundreds of patent for shale material processing thechnology have been done, but only a few of it are tested. Based on Qian and Wang (2006), there are 4 permanent technologies used for commercial, i.e., Kiviter, Galoter, Fushun and Petrosix.
Utilization of shale material is categorized as new technology and non-conventional since the process does not stop on driliing and producing oil, but one more research process is necessary to finally produce shale material. Yoshioka and Ishiwatari (2002) conducted some on going research to characterize organic material, but only a few of it specifically discuss and study about types of organic material matrix associated with clay or carbonate with heating treatment. Based on Nelson (2001), Nur (1984) and Qodari (2010), the clay material used are kaolinite Al2Si2O5(OH)4,
Montmorillonite Mg2Al10Si24O60(OH)12, Illite
Ky(AlFeMg)(Si2-yAly)O5(OH), and Chlorite (OH)4(Si Al)8(Mg
Fe). Meanwhile, carbonate materials are calcite CaCO3, and
dolomite CaMg(CO3)2.
The information is then used to choose the types of material suitable for this research, i.e., material that highly affected by organic material maturation for conversion process of oil shale into hydrocarbon in form of crude oil. Maturation of organic material has different Tmax, therefore affects the duration and quality or the transformation process from oil shale into hydrocarbon in form of crude oil. Nagendrapa (2002), Cogo et al have conducted research about characteristic of organic material. Therefore, deeper research is necessary to study organic material lodged in clay-organic material (Illops and Killops, 2005).
Beside Tmax, it is important to know the temperature needed by water molecules to detach from crystal structure of clay and carbonate shale. Therewith, it is necessary to study the current temperature when perfect phase process is reached. This is indicated by change of structure on clay-organic and carbonate-clay-organic material and disappearance of water molecules chemically. The last is to study the current temperature when the molecules in clay and carbonate material are detaching. Praptish et al (2009) have conducted research for TOC, Tmax, HI value and type of kerogen material.
2. RESEARCH METHOD
2.1 Sample Selection
Research activity is focused on characterization of clay and natural carbonate united/compacted with organic material salycilic and stearic acid. Those organic materials are chosen since the matrixs are well-suited the matrix of oil shale.
Part of shale materials, clay (illite, Kaolinite) and natural carbonate (calcite) used as organic container, prepared with petrophysical that further will be analyzed to know type and characteristic of the material.
Suitable TOC value from Waples (1985), Rachmat (2007), Widjaya et al (2011) and Dewanto (2013) is used as comparison and reference in the making of shale material either using clay or carbonate container.
2.2 Characterization and Test
After getting the desired organic container, the clay materials, clay-organic and carbonate-organic are placed seperately. It is stirred and pressed, then kept for 48 hours, then stirred and pressed again so that it fills all the pores in the clay container. After that, the shale materials are kept for two weeks so that the organic materials are trapped, binded and compacted. Next, using BET, the researchers measure the size of the specific surface.
The most important characteristic is that TOC of synthesized shale material should be ≥12. It shows a good nature of oil shale that can be used as comparison reference. An X-Ray Difraction (XRD) analysis is conducted to know the oxide distribution on the surface of the shale. Meanwhile, SEM analysis is conducted to know the material’s morphology.
Further, Thermogravimetric Analysis (TGA) is done to measure change on weight of the compound as the function of
temperature or even duration, as well as to know weight and phase change of the materials.
Pyrolysis method consists of heater (oven) at inert atmospher temperature (helium) and 100 mg sample to determine:
a. Free hydrocarbon in the samples (clay, shale-carbonate, shale-oil).
b. Compound of hydrocarbon and oxygen evaporated from the beginning of cracking process of organic material in the samples (shale-clay, shale-carbonate, shale-oil).
Tmax is an indication of maturation level of organic material inside shale-clay, carbonate shale and oil shale. Tmax value is one of geochemical parameter used to determine maturation level of shale-clay, shale-carbonate, and oil shale. Termal Maturation level is measured by Tmax. For Example: if Tmax is <435 OC, it shows that shale-clay, carbonate shale and oil shale are not mature yet. If Tmax is >470OC, it is over mature. Chart of pyrolysis outcome is called Pirogram and can be seen in program figure.
Research outcomes from Tobing (2003), Tjahjono (2004), Heryanto (2006) and Hermiyanto (2009) are taken as reference for processing the data from the outcome of this pyrolysis process. Then, the data will be processed further to get several lab test parameters that describe maturation and potential of some types of shale materials mentioned above, i.e., HI (Hydrogen Index), OI (Oxygen Index), PI (production index), PY (Pyrolysis Yield) and PC (Carbon Pyrolyzable.
3. DISCUSSION
3.1 SEM Analysis on Clay Material
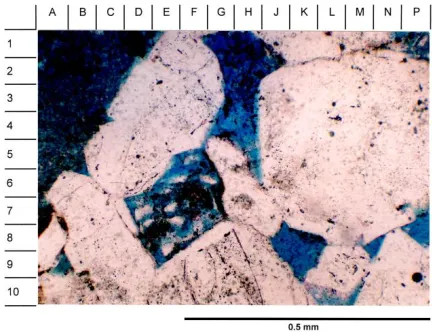
Figure 1 shows SEM photos of clay material. Pores are filled by kaolinite and illite material (A-D, 1-6). Unstable change on particle, presence of clay material, kaolinite and unstable cumulation on material form secondary porosity.
Fig. 1. SEM Analysis of Clay Material (OD2); Pores are filled by kaolinite and illite material
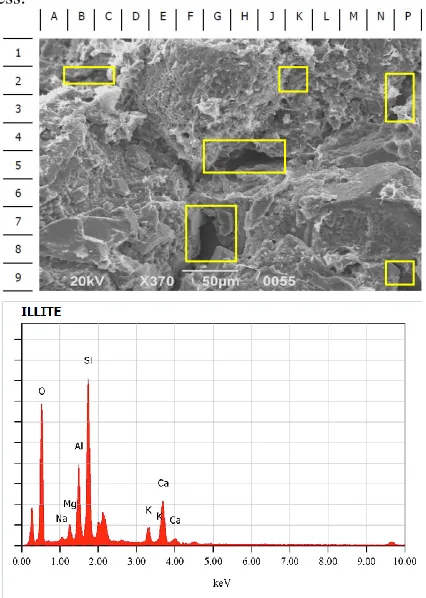
Figure 2 is SEM analysis outcome on clay material with 370 times magnification. It shows illite cementation that limit the development of quartz cement (C-D, 3; E-H, 3-5; J-L, 1-2). There is a little quartz cement compaction that causes the pores widely open, although there are illite and kaolinite. Clay material with good pores value like this will be used as organic material container and take role as place for that organic material to accumulate. The organic material is expected to occupy all existed pores, bound tightly, covered by clay and distributed evenly. Clay is expected to be catalyst on maturation process of organic material during the heating process.
Fig. 2. SEM analysis outcome on clay material OD2 with 370 times magnification
3.2 SEM Analysis on Carbonat Material
Based on microscopic investigation, Figure 3 shows composition domination by carbonate (G-M, 1-3; A-H, 8-9), which related a bit of clay material (carbonate mud).
Fig. 3. The results of SEM analysis of carbonate material (OD7)
This sample experiences compaction mechanically and chemically causing sedimentary of carbonate cement. Secondary pores is produced by clay carbonate matrix. Porosity seems moderate (10,25%) and dominated by secondary pores types (blue zone) and micro porosity. The total of porosity is 1.00% and low connetion on porosity and probably only local area are well-connected.
Figure 4 shows SEM analysis outcome on carbonate material (OD7). The carbonate material (OD7) has huge amount of poressome of the space in pores can be filled by other material (C-E, 2-4). Carbonate material is dominated by calcite D-E, 2-3; B-D, 2-4) and small amount of dolomite (C-D, 5-6).
Figure 4.
The results of SEM analysis on carbonate material with a magnification of 370 timesand 250 times
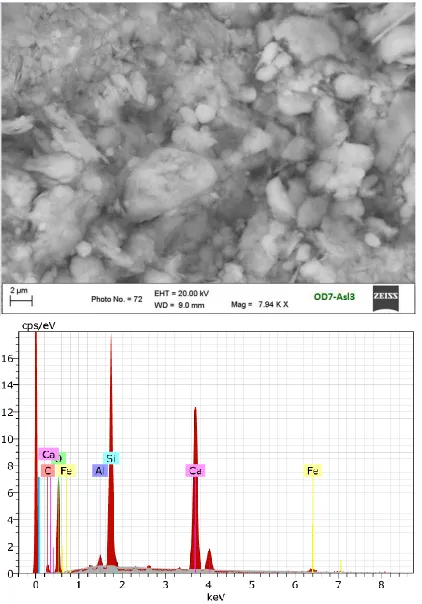
The method of carbonate shale formation OD7-Asl3 is the same as OD2-Ast2. The difference is on the stirring. It has bigger pressure and longer duration (48 hours). The goal for the trapped organic matter (filled) pores and more binding as well as compact. Afterward, size measurement toward the surface of the shale material is taken with BET test tool. The narrowing pore that filled evenly by organic material, can be seen at SEM analysis outcome (Figure 5).
Fig. 5. The results of SEM analysis on carbonate-organic (OD7-ASL3)
SEM photos of carbonate-organic, at a glance, looks the same as clay-organic, but, in fact, there is minor different, i.e.,
character of carbonate material (calcite) has dominant secondary pores. The porosity will experience change at certain amount of time causing organic material or else to in and out the pores. Yet, in case of organic container, calcite can be a perfect place for maturation of organic material although it needs higher temperature as suggested by pyrolysis and TGA test.
SEM photos on organic-carbonate shows that the material is covered tightly by organic. Edax SEM outcome suggests carbonate organic contains some elements with (wt,%) as follow: Carbon (7.76%), Oxygen (62.39%), Aluminium (0.74%), Silicon (13.025), Calcium (15.59%) and Iron (0.48%).
3.3 X-Ray Difraction Measurement
Figure 6 and 7 are outcome of XRD analysis on 2theta angle 10O-80O on natural carbonate material, or in this case calcite (CaCO3). Compared to carbonate-organic on figure 8
which is the carbonate material OD7 that is filled or bound with organic material Asl3. After having tested pyrolysis TOC values approaching 12%.
Fig. 6. Graph the results of XRD carbonate material (OD7)
Fig. 8. XRD results of carbonate-organic (OD7-Ast3)
Figure 8 shows that peaks increase and most of them are on lower 2theta angle compared to chart on figure 6, meanwhile the magnitude of intensity experience bigger change. The narrowing of 2theta angle on several peaks indicates that pores cavity of carbonate-organic are filled and bound with organic material. Therefore, the presence calcite and illite will act as catalyst on heating and organic maturation process and expected to help conversion process of oil shale into crude oil.
3.4 TGA Analysis Outcome
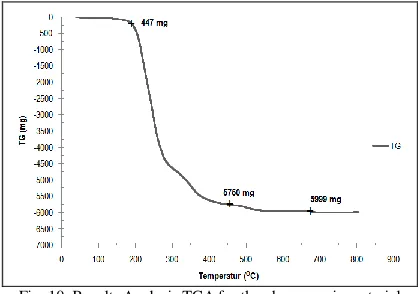
TGA analysis outcome on carbonate-organic as shown at Figure 9, suggests that the last phase change happening at approximately temperature 750OC. It is higher than phase change of clay-organic which is approximately 650OC (Figure 10). Carbonate-organic experience 4 times weight change. First change happens at approximately 115OC as water molecules inside crystal structure evaporating. At 200 OC, second change happens significantly, indicated by structure change on shale carbonate material and the loss of water molecules chemically.
Fig. 9. Results Analysis TGA for carbonate-organic material
When calcination is conducted, another weight loss is happenning at temperature 400OC, thus detachment of
molecules in carbonate-organic re-occuring, which influence the change of pore size. Temperature ±(400OC-450OC) causes weight loss before the last loss at last temperature indicating maximum temperature needed by carbonate shale to transform into oil shale.
Fig. 10. Results Analysis TGA for the clay-organic material
When calcination continously done from the beginning of last loss to constant status, specifically at temperature 740OC, many molecules inside carbonate-organic are detaching, as well as some parts inside the pores.
This condition is generally called as over mature (T-over), where the chart line tend to stay horizontal along with the increase of temperature up to 800OC. This also indicates that the structure of material has broken and cannot be used as reference shale material anymore. More than that, physically, calcination on temperature higher than 700OC changes the color of the material into blackish. Therefore, the required temperature in a process of oil shale conversion on carbonate- organic into crude oil is approximately ± 400OC-450OC, higher than clay-organic (Figure 10) which is on ± (325O C-430OC).
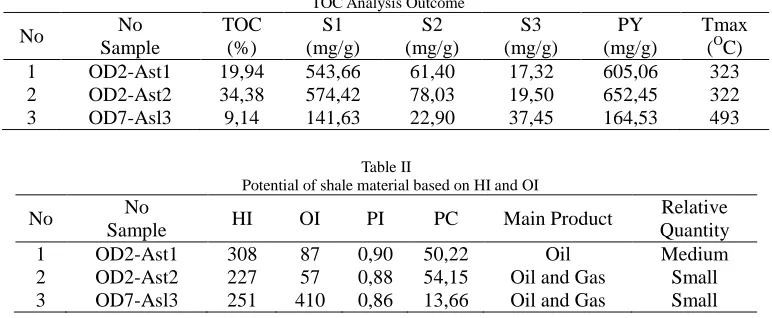
3.5 Testing Results TOC and Pyrolysis
Outcome of TOC test and pyrolysis on 3 samples of shale materials is available in Table I. Two clay-organic material (OD2-Ast1 and OD2-Ast2) suggests very good quality as shale material with TOC> 12,0%. Meanwhile, carbonate-organic material also shows good quality but not as good as clay-organic material. Amount of organic material on clay and carbonate is stated by total organic carbon (TOC) in percent of shale material, because TOC value is > 12.0%. This TOC value is used as one of parameter on early selection of shale material to separate low quality shale material and the good one which then used as basic processing of oil shale.
Hydrogen Index needs to be corelated to effect of heating to clay shale, carbonate shale and oil shale.
Thermal maturation analysis done to these three shale materials bring about 322OC, 323OC, and 493OC, indicating different thermal maturation level on each material, in which carbonate-organic needs higher temperature and longer time
compared to clay-organic. Combination of Hydrogen Indexs and Tmax suggests that clay organic takes role as oil shale that tend to be oil and gas, while carbonate-organic is not a perfect oil shale yet.
Table I TOC Analysis Outcome
No No
Sample
TOC (%)
S1 S2 S3 PY Tmax
(OC)
(mg/g) (mg/g) (mg/g) (mg/g)
1 OD2-Ast1 19,94 543,66 61,40 17,32 605,06 323
2 OD2-Ast2 34,38 574,42 78,03 19,50 652,45 322
3 OD7-Asl3 9,14 141,63 22,90 37,45 164,53 493
Table II
Potential of shale material based on HI and OI
No No
Sample HI OI PI PC Main Product
Relative Quantity
1 OD2-Ast1 308 87 0,90 50,22 Oil Medium
2 OD2-Ast2 227 57 0,88 54,15 Oil and Gas Small
3 OD7-Asl3 251 410 0,86 13,66 Oil and Gas Small
Table II shows shale material potential based on HI and OI. HI is the outcome of (S2×100)/TOC and OI for
(S3×100)/TOC. The value of these two parameters will
decrease along with the increase of maturation level. A high HI shows clay material is dominated by organic material or oil
prone. Meanwhile, high OI value indicates the domination of gas-prone organic material. Waples (1985) research stated that HI value can be used to determine the type of main shale material and organic material produced.
Table III
Potential of shale material based on HI and OI (Waples, 1985)
HI Main Product Relative Quantity
<150 Gas Small
150 – 300 Oil & Gas Small
300 – 450 Oil Medium
450 – 600 Oil Ample
> 600 Oil Plentiful
Basis to determine shale material potential is taken from previous researches that have succesfully conducted. Waples theory (1985) is taken as the basis to study the potential of oil shale material (Table III). In fact, those two shale materials have different characteristic, in which clay (illite) gives huge influence on heating and maturation process of organic material contained in OD2-Ast1 and OD2-Ast2. Meanwhile, effect of carbonate material (calcite) toward OD7-Asl3 is less visible compared to illite.
Different material effect also influences duration and value of maximum temperature needed in phase changing process as well as the detachment of water molecules and other molecules in the material. Carbonate material needs longer time and higher temperature compared to clay material (illite or kaolinite). This means clay material (illite) has stronger influence domination toward the maturation process and phase change of organic material (from TGA test outcome), than carbonate material (calcite). In other words, the outcome of pyrolysis test can be objective indicator of this
research supported by outcomes of SEM characterization, XRD and TGA test.
3.6 Identification of Molecular Structure on Calcination results Shale Clay or Carbonate
Information about molecule structure can be gotten precisely and accurately on calcination outcome of clay-organic and carbonate-clay-organic. Another advantage from FTIR measurement is that it can identify sample in various phase (gas, solid, and liquid).
Figure 11 shows FTIR measurement on outcome of clay-organic heating. Spectrum has peak characteristic around 4000 to 2500, in which well-suited to the absorption caused by NH, CH and obligation of single OH. It means that the material has C-H bound with Alkana type and has a strong intensity which fits to what is expressed by Skoog et al
fingertip area of IR spectrum and contains most of absorption peak for various single bond.
Fig. 11. FTIR measurements on heating shale clay
Fig. 12. FTIR measurements on heating shale carbonate
FTIR measurement on outcome of carbonate-organic heating shows at figure 12. The outcome is almost the same as clay-organic in which the spectrum has peak characteristic around 4000 to 2500 where the peak is fit to absorption caused by NH, CH and obligation of single OH. This shows that carbonate-organic has C-H bond with Alkana type and possess a strong intensity. Beside that, there is also spectrum with peak characteristic around the 4th zone, i.e., 15000 to 400. If all peaks in IR spectrum, included in fourth zone, are identical with other spectrum, hence surely that both of it are identical compounds.
4. CONCLUSION
1. The selection of shale material (OD1-Ast1, OD2-Ast2 and OD7-Asl3) has been well-suited to the characteristic of good quality oil shale, i.e., organic container from clay and carbonate with good porosity value as place for organic material to accumulate.
2. TOC value of shale material made has been well-suited the oil shale, TOC 12%.
3. Temperature to change both materials from the shale material into crude oil (Tmax) when it has been fit as oil shale is 421OC-453OC.
4. TGA test suggests that clay-organic material has bigger influence in maturation process than carbonate-organic, measured by TGA test shown below:
a. Carbonate-organic experience many phase change compare to clay-organic, so that need a longer time and higher temperature.
b. Tmax of Carbonate-organic (400OC-450OC) is higher than clay-organic (325OC-430OC).
c. The forming of gas on carbonate-organic (T-over=750OC-1000OC) is also higher than clay-organic (T-over=650OC-900OC).
5. Identification of molecules structure on calcination outcome of shale materials are as follows
a. Calcination outcome of clay-organic shows the spectrum has peak characteristic at 2926.75 and carbonate- organic at 2924.88 (around 4.000 to 2.500).
REFERENCES
[1] Alali, J. 2006. Jordan Oil Shale, Availability, Distribution, And Investment Opportunity. International Oil Shale Conference. Amman, Jordan. Retrieved 2008-03-04.
[2] Al-Hamaiedh, H., Maaitah, O., and Mahadin, S. 2010. Using Oil Shale Ash in Concrete Binder. EJGE Vol. 15, Bund. F. P. 601-608 [3] AL-Hasan, N. 2006. Behavior of concrete made using oil shale ash
and cement mixtures. Oil Shale. Vol. 23, No. 2, ISSN: 0208-189X pp. 135–143.
[4] Barkia, H. Belkbir, L. and Jayaweera, S.A.A. 2004. Thermal analysis studies of oil shale residual carbon. Journal of Thermal Analysis and Calorimetry, 76 (2), pp.615-622.
[5] Bartis, James T. LaTourrette, Tom, Dixon, Lloyd; Peterson, D.J.; Cecchine, Gary. 2005. Oil Shale Development in the United States. Prospects and Policy Issues. Prepared for the National Energy Technology Laboratory of the U.S. Department of Energy. The RAND Corporation. ISBN: 978-0-8330-3848-7. Retrieved 2007-06-29.
[6] Berraja, T., Barkia, H., Belkbir, L., and Jayaweera, S.A.A. 1988. Thermal analysis studies of the combustion of Tarfaya oil shale. Proceeding of an International Conference on Carbon, Carbon'88, Eds. B. McEnnaney and T.J. Mays, Univ. Newcastle Upon Tyne, UK, 18-23.
[7] Brendow, K. 2003. "Global oil shale issues and perspectives. Synthesis of the Symposium on Oil Shale. Oil Shale. A Scientific-Technical Journal (Estonian Academy Publishers) 20 (1): 81-92. ISSN: 0208-189X. Retrieved on 2007-07-21.
[8] Burnham, A.K., McConaghy, James R. 2006. Comparison of the Acceptability of Various Oil Shale Processes. 26th Oil Shale Symposium. Golden, Colorado: Lawrence Livermore National Laboratory. UCRL-CONF-226717. Retrieved 2007-06-23.
[9] Cogo, S.L., Brinatti, A.M., Saab, S.C., Simões, M.L., Martin-Neto, L., Rosa, J.A., and Mascarenhas, Y.P. 2009. Characterization Of Oil Shale Residue And Rejects From Irati Formation By Electron Paramagnetic Resonance. Brazilian Journal of Physics, vol. 39, no. 1.
[10] Dewanto, O. 2008. Determining the Condition of Organic Rockk at ‘X’ Central Sumatra Region, Based on Estimation of Thermal Capacity of Reservoir Rocks. Proceedings of the National Seminar on Science and Technology-II 2008, University of Lampung. ISBN: 978-979-1165-74-7. V. 132-141.
[11] Dewanto, O., Bahri, S. dan Atmojo, J.P. 2008. Analysis on Physical Characteristic Change of Organic Rocks toward Geothermal Stream in ‘X’ Sumatra Region to Determine Compounds and Area of Oil Shale as New Energy Resources. Proceedings of the Annual Scientific Meeting, 33rd HAGI Annual Convention & Exhibition, Hyatt Regency Bandung. ISBN: 978-979-8126-05-5.
[12] Hermiyanto, M.H.and Ningrum, N.S. 2009. Organic petrology and Rock-Eval characteristics in selected surficial samples of the Tertiary Formation, South Sumatra Basin. Indonesian Journal of Geology,
Vol.4 No.3, p: 215-227.
[13] Heryanto, R. 2 Juni 2007. Relation among Diagenesis, Vitrinite Reflectan and Maturation of Hydrocarbon Carrier Rock of Miocene Sedimentary Rocks. Indonesian Journal of Geology, Vol. 2 No.2. p: 99-111.
[14] Heryanto, R. dan Hermiyanto, H. Maret 2006. Potential of Hydrocarbon Source Rock at Tigapuluh Mountain, Central Sumatra. Indonesian Journal of Geology, Vol. 1 No.1, p: 37-48.
[15] Illops, S. and Killops, V. 2005. Introduction to Organic Geochemistry. 2nd ed. Ix+393 pp. Oxford: Blackwell Publishing. ISBN: 0 632 06504 4.
[16] Katz, B.J., 1983. Limitations of ‘Rock-Eval’ pyrolysis for typing organic matter. Organic Geochemistry 4, p.195-199.
[17] Koel, Mihkel (1999). Estonian oil shale. Oil Shale. A Scientific-Technical Journal (Estonian Academy Publishers) (Extra). ISSN 0208-189X. Retrieved 2007-07-21.
[18] Kogerman, A. 2001. Ten Years of Oil Shale. Estonian Academy Publishers. Oil Shale, Vol. 18, No. 1. ISSN 0208-189X. pp. 1-4. [19] Nagendrapa, G. 2002. Organic Syntesis using Clay Catalyst. Journal
Resonance. p: 64-77.
[20] Nelson, S. A. 2001. Clay Minerals. Tulane University.
[21] Nur, R. 1984. Identification of Clay Minerals in Sand Reservoir Rocks Using SEM. Proceeding Scientific Discussion V Some Results of Work PPTMGB “Lemigas”, Jakarta.
[22] Peters, K.E., Walters, C.C., and Moldowan, J.M. 2006. The biomarker guide: V.1 Biomarkers and isotopes in the environment and human history. Cambridge University Press, 471 pp.
[23] Praptisih, Kamtono, Putra, P.S. dan Hendrizan, M. 2009. Characteristic of Hydrocarbon Source Rock on Batuasih Formation at Sukabumi Area. Indonesian Journal of Geology. Vol. 4 No.3, p:167-175.
[24] Qian, Jialin, Wang, Jianqiu. 2006. World oil shale retorting technologies. Oil_Conference/rtos-A118. Amman, Jordan. Retrieved 2007-06-29.
[25] Qodari, M.T. 2010. Characterization of Clay from Pagedangan Area, Turen District, Malang Municipality and Getaan Area, Pagelaran District, Malang Municipality. Undergraduate Thesis. Science and Technology Faculty, Chemical Major, State Islamic University of Malang.
[26] Widjaya, R.R. 2012. Bentonite Pilarisation Cr and Zeolit HZSM-5 as Catalist on Ethanol Conversion Process into Biogasoline. Postgraduate Thesis. Master Degree Faculty of Mathematic and Science, Material Science Study Program. Universitas Indonesia. [27] Siswoyo and Subono, S. 1995. Heat Flow, Hydrocarbon Maturity
and Migration in Northwest Java. CCOP Technical Bulletin. March, Vol.25, pp.23 to 36.
[28] Subono, S. and Siswoyo. 1995. Thermal Studies of Indonesian Oil Basin. CCOP Technical Bulletin. March, Vol. 25, pp. 37 to 54. [29] Tjahjono, J.A.E. 2004. Preliminary Survey on Solid Bitumen
Sedimentary at Sendangharjo and Surrounding, Blora District, Central Java Province. DIM, Bandung.
[30] Tobing, S.M. 2003. Inventory of Solid Bitumenusing ‘Outcrop Drilling’ at Ayah Area, Kebumen Distrct, Central Java Province. DIM, Bandung.
[31] Waples, D.W. 1985. Geochemistry in Petroleum Exploration. Brown and Ruth Laboratories Inc, Denver Colorado, 33pp.
[32] Waples, D.W. 1985. Geochemistry in Petroleum Exploration. International Human Resources Development Co., Boston, 232 h. [33] Yoshioka1, H. and Ishiwatari, R. 2002. Characterization of organic
matter generated from Green River shale by infrared laser pyrolysis.
Geochemical Journal. Vol. 36, pp. 73 to 82.