Analytical Study of Different Classification Technique for
KDD Cup Data’99
Riti Lath
M.Tech Student KIIT University Bhubaneswar, Odisha, India
Manish Shrivastava
Dept. of Computer Science & Engineering, Institute of Technology
Guru Ghasidas University, Bilaspur, CG, India
ABSTRACT
This paper is a concise analysis of classification of 10% of kdd cup’99 datasets based on intrusion detection. Analysis of data is performed using different techniques i.e. k-mean which is based on clustering, and k-nearest neighbor, support vector machine are classification techniques. Firstly the flat results are analyzed then preprocessed data is used. For preprocessing statistical normalization has been used. For analysis only two groups are considered that are normal and abnormal, no further division of abnormal category has been done.Matlab is used as a tool. As a result classification technique proves good in classifying data, abnormal data separately and normal and abnormal data collectively, for classification potentiality.
General Terms
Anomaly detection, intrusion detection, data mining, KDD cup’99.
Keywords
classification technique, clustering, normalization, SVM
1.
INTRODUCTION
Intrusion detection system was introduced for prevention based security.As every organization is employing network communication, i.e. they transfer data using data packet within the network which is prone to intrusion or interference of the unauthorized user that violates the security of the network link established between two systems. So for preventing this intrusion its detection is the utmost priority. This is the widely studied topic in computer research in recent years. The nature of the data packets or content of the data packets is studied to so as to classify the different type of packets, specially normal or non intruded packet and intruded packet. In 1999, the tcp dump files were collected which contains the 41 attributes at MIT Lincoln Laboratory for 1998 DARPA Intrusion Detection Evaluation Program and it has been used as KDD cup’99 data.KDD cup’99 data is proved to be good referencing data for security research community and for data mining research domain as well[1].As it is a large dataset, it has some faults in it even though many researcher have used this dataset for proving their research concerned works.[8][9]
Data mining technique can be implemented for analyzing the massive data, conceivably data mining can be utilize for more than collecting and managing data, it includes analysis and prediction. Many data mining techniques are available for classifying data. It involves use of sophisticated analytical
tools for perdition of unknown, valid patterns and relationship in large datasets. Since the data mining has matured or evolved, it becomes a vital part of KDD, i.e. knowledge data discovery which encompasses the procedural steps, data selection, data preprocessing, data transformation, data mining, interpretation and evaluation. There are many data mining techniques that are frequently used, artificial neural network, rule association, memory based reasoning or case based reasoning, cluster analysis, classification algorithm and decision tree, genetic algorithms [10].
In this paper, we systematically evaluate the classification accuracy by following the basic data mining approaches.Here, the KDD cup’99 dataset is employed which is having the network based intrusion. We have used the statistical normalization method which proves to be the most productive normalization technique for scaling the dataset. Attribute normalization is important for anomaly detection tasks as it parabolize the good impact on evaluation of classification performances. We have bring into play three anomaly detection technique (cluster analysis and classification technique) from the data mining approach, K-mean clustering-nearest neighbor, Support vector machine (SVM) with radial basis kernel function. As a result an analytical and comparative result has been drawn.
2.
PREVIOUS WORK AND RESULT
Previous work has a discussion on the possibilities of application of clustering algorithms and Support Vector Machines (SVM) for use in the IDS.K-means, Farthest First and COBWEB algorithms as clustering algorithms and SVM as classification SVM of type 1 also known as CSVM have been used.[3][5]By appropriate choosing of the kernel and SVM parameters they achieved improvements in detection of intrusion to the system.In their experimental work they used kddcup’99 dataset and Experiments were performed on a collection containing five pairs of data sets: the learning set (5092 vectors of 42 attributes) and testing set (6890 vectors of 42 attributes).Each pair represents a learning and testing data for each of the five classes of network attacks. Individual vectors describing the network traffic are described by 41 attributes (range 0−1, is therefore not necessary to normalize). The 42nd attribute was used in learning process[3].
99.722%). The average success rate of other algorithms was between 91.228% and 98.998%[3].
Their experimental results are given by the following tables:
Table 1. Classification using SVM Attack SVM kernel
Linear Polynomial RBF Sigmoidal
Normal 99.550 99.830 99.870 99.580
Probe 99.801 99.810 99.900 99.880
DOS 99.801 97.180 99.880 99.830
U2R 99.800 99.800 99.830 99.830
R2L 99.640 99.710 99.750 99.650
Average 99.722 99.266 99.846 99.754
Table 2. Classification using clustering algorithm. Attack
type
FFT
K-means
COBWEB/CLASSIT
Normal 84.92 99.46 83.73
Probe 98.77 98.19 97.79
DOS 82.64 99.91 83.12
U2R 95.04 99.97 93.58
R2L 99.27 97.46 97.92
Average 92.12 8
98.998 91.228
3.
PROPOSED MODEL
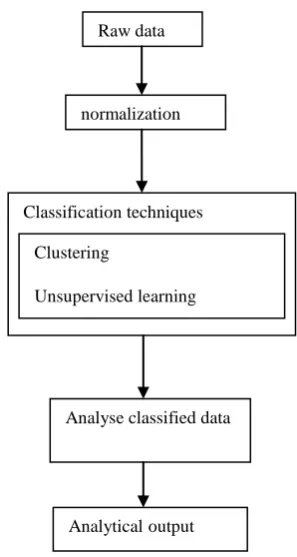
The proposed model is an analytical model. It works as shown in the fig 1. Firstly the data get preprocessed by normalization and then feature extraction has been performed. Then classification techniques are imposed and before that classification algorithm gets trained. Finally the result is compared with the expected result, and the accuracy of the algorithm is determined. For preprocessing statistical normalization with feature extraction algorithm is performed. In classification module different classification algorithm are applied for finding best and highly accurate classified data.
Fig 1. Proposed model for analyzing the classification algorithm
4.
METHODOLOGY
KDD cup’99 data consists of textual data which is replaced by numeric data then the whole data is normalized using statistical normalization, then the classification algorithms are applied to the data that is normalized.
4.1 Preprocessing
Statistical normalization is used, so as to convert the mean to zero and variance to unit variance. [1]
The statistical normalization is given by:
Where µ is mean of n values.σ is standard deviation. Standard deviation is beneficially applicable in large amount of data because dataset should follow normal distribution. This normalization method does not scale the value in range of -1 to 1,i.e.[-1,1],instead it scales the data values in range of -3 to 3,i.e.[-3,3].
4.2 K-mean
K-mean is an unsupervised learning algorithm that partition feature vectors into k clusters so that the within group sum of squares is minimized. Here, we need to classify data into two distinct clusters say normal and abnormal clusters [2] [7].
Given an initial set of k means m1,…,mk (see below), the algorithm proceeds by alternating between two steps:
Assignment step: Assign each observation to the cluster with the closest mean.
Raw data
normalization
Classification techniques
Analyse classified data
Analyticaloutput Clustering
Update step: Calculate the new means to be the centroid of the observations in the cluster.
The algorithm is deemed to have converged when the assignments no longer change.
4.3 K-nearest neighbor
K-nn classification is applied to the data where the prior knowledge of data is lacking or to perform discriminate analysis when reliable parametric estimates of probability densities are unknown or difficult to determine. For classification k-nn needs the training data to map the test data in the feature space. In this, for given k,that is no. of neighbors to be considered, k-NN ranks the neighbors of a test vector T among the training samples, and uses the class labels of the k most nearest neighbors to predict the class of the test vector.[4] Euclidean distance is usually used for measuring the similarity between two vectors. Euclidean distance is given by:
For classification, confidence for each class is computed as
Confidence = Ci /K,
(where,Ci is the number of patterns among the K nearest patterns belonging to class i.)
4.4 Support Vector Machine
svm is a supervised learning method that analyze data and recognize patterns, used for classification and regression analysis. Here in training data only two classes are mentioned that are, normal and abnormal, no further categories of abnormal data is considered. Support vectors are created using training set or samples and accordingly the test data is mapped onto either sides of hyper plane according to the kernel function specified. Here the kernel function is radial basis function, for which the corresponding feature space is Hilbert space of finite dimension, where maximum margin classifier is well regularized. [5][6]
Gaussian Radial Basis Function: , for γ > 0. Sometimes parameterized using γ = 1 / 2σ2
The kernel is related to the transform by the equation ..The value w
is also in the transformed space, with .Dot products with w for classification can again be computed by the kernel trick, i.e.
However, there does not in general exist a value w' such that
.
5.
EXPERIMENTS
5.1
Dataset
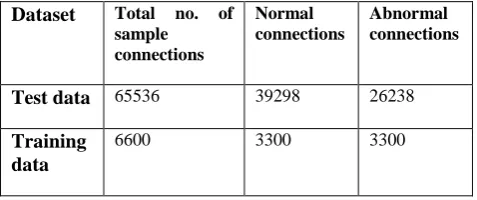
Test data: Data set used is 10% of kddcup’99 dataset, it consists of 41 feature attributes out of which 3 are symbolic and 38 are numeric. thus each connection is given by 41 features set. there are 65536 sample of connection defined in 41 dimensions, from which 39298 are normal and 26238 are attacks. There are 22 type of attacks in full dataset of kddcup’99,these attack falls in 4 categories DoS: denial-of-service (e.g., teardrop); R2L: unauthorized access from a remote machine (e.g., password guessing); U2R: unauthorized access to local superuser (root) privileges by a local unprivileged user (e.g., buffer overflow attacks) and PROBE: surveillance and other probing (e.g., port scanning). As 3 are symbolic features, they are substituted with some fixed numeric data values so as to make more precise classification by taking all the attributes[8][9].
Training data: 10% of training data is selected randomly from the 10% of kddcup’99 dataset. Training data contains half the no. of normal data and half of the abnormal data,i.e. 3300 samples of each.
Table 3. Details of KDD cup’99 dataset
Dataset Total no. of
sample connections
Normal connections
Abnormal connections
Test data 65536 39298 26238
Training data
6600 3300 3300
5.2 Evaluation of classification methods
for detection of anomaly
Results are shown below:
Table 4. showing classification of data (normal and abnormal collectively).; classification potentiality of classification technique.
Method Flat
result
With
normalization
Elapsed time ranges(in avg.)
k-mean 40.0345 63.0345 12-15 sec
k-nearest neighbor
99.7543 97.1649 530-620 sec
Support vector machine
Table 5. showing classification accuracy for abnormal data only
Method Flat result
With
normalization
Elapsed time
k-mean 59.5203 21.6644 12-16 sec
k-nearest neighbor
99.6073 92.9796 306-405 sec
Support vector machine
99.43212 91.6037 27-30 sec
1 2 3
4 5 6
7 8 9
10
95.5 96 96.5 97 97.5 98 98.5 99 99.5 100 200 400 600 800
no. of iterations accuracy(%)
e
la
p
s
e
d
t
im
e
(s
e
c
)
knn
knn(data normalized) svm
svm(data normalized)
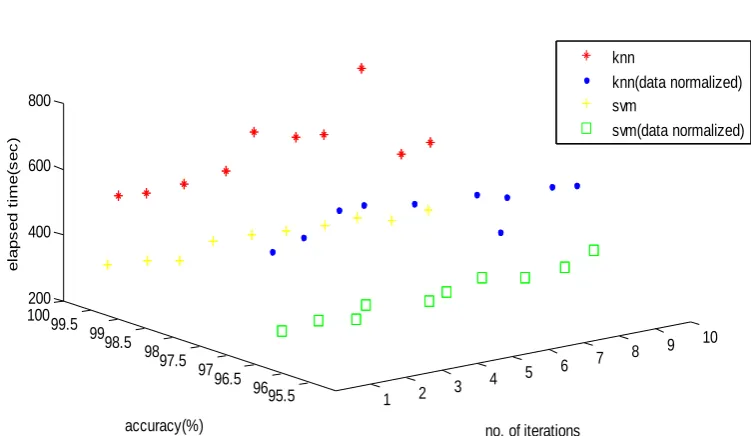
Fig 1. 3d-plot of accuracy of SVM and k-NN algorithm for 10 iterations
6.
CONCLUSION
By applying classification algorithms over the data without any preprocessing they yield good results. As data get preprocessed (i.e. normalized), potentiality of classification technique reduces. But the normalization is needed as the data is not scaled. Classification of anomaly separately gives not so excellent result and takes much of execution time.
As we have considered two categories for separating data into two distinct sets,i.e normal data and abnormal data.K-mean doesn’t show as much strength as SVM but it takes much less time two separate two domains. From the previous analysis available, SVM proves good in classification but the data was separated into 5 categories, normal, probe, DOS, U2R, R2L, and for each category the algorithm is trained separately each time. So, in a comparison SVM gives fine result though huge set of data is considered and dividing it into only two domains and training the algorithm for both of them collectively. In previous work no normalization or preprocessing is done.
We have concluded that after evaluation k-nearest neighbor gives better result than SVM for classifying normal and abnormal data but it takes more time for its execution.
Classification techniques are better in a particular case than clustering, as k-mean fails to give better separation.
7.
REFERENCES
[1].Wei Wang, Xiangliang Zhang, Sylvain Gombault, and Svein J. Knapskog, Attribute Normalization in Network Intrusion Detection, IEEE, 2009 10th International Symposium on Pervasive Systems, Algorithms, and Networks. 978-0-7695-3908-9/09,pp-448-453.
[2] Tapas Kanungo, David M. Mount Nathan S. Netanyahu, Christine D. Piatko, Ruth Silverman, and Angela Y., An Efficient k-Means Clustering Algorithm: Analysis and Implementation, IEEE transactions on pattern analysis and machine intelligence, vol. 24, no. 7, July 2002, pp-881-892.
[4]P´adraig Cunningham ,University College Dublin and Sarah Jane Delany,k-Nearest Neighbors Classifiers Dublin Institute of Technology Technical Report UCD-CSI-2007-4 March 27, 2007
[5],Wencang Zhao, Guangrong Ji, Rui Nian, and Chen Feng, SVM Classification Method Based Marginal Points of Representative Sample Sets, International Journal of Information Technology Vol.11 No. 9, 2005
[6] Steve R Gunn, Support Vector Machines For Classification and Regression, technical report, university of Southampton, may, 1998.
[7].Joaquín Pérez Ortega, Ma. Del Rocío Boone Rojas, María J. Somodevilla García, “Research issues on K-means Algorithm: An Experimental Trial Using Matlab”, [email protected],{rboone,mariasg}@cs.buap.mx
[8]Mahbod Tavallaee, Ebrahim Bagheri, Wei Lu, and Ali A. Ghorbani, “A Detailed Analysis of the KDD CUP 99
Data Set”.proceedings of the 2009 IEEE symposium on computional intelligence in security and defence applications.
[9]Adetunmbi A.Olusola., Adeola S.Oladele. and Daramola O.Abosede, “Analysis of KDD ’99 Intrusion Detection Dataset for Selection of Relevance Features”, Proceedings of the World Congress on Engineering and Computer Science 2010 Vol I WCECS 2010, October 20-22, 2010, San Francisco, USA