Abstract—This paper analyzes the effect of prototypical apartments’ orientation on indoor thermal comfort as a case study. The appartments are in a residential building block in October 6th city in Greater Cairo, Egypt. Field measurements of indoor air temperature (Ta,in) and relative humidity (RHin) were monitored in three hour intervals in the winter season of 2013 during one week in January. Outdoor measurements for the ambient temperature and relative humidity were obtained from the Meteorological Authority in the same period. The indoor measured data of air temperature and relative humidity were used to specify the comfort zone of each apartment in different orientations in the reference case by using ASHRAE psychrometric chart. This is considered the first part of the study and the second part will be conducted in the summer season to discuss the indoor thermal comfort for the reference case. a visual survey was conducted in order to analyze the construction materials and façade features of the buildings. Personal observations, field measurements and ASHRAE psycrometric chart analyses show that there is significant thermal discomfort inside the apartments, while changing the orientation had an insignificant effect on improving thermal conditions during the survey period
Index Terms—Thermal comfort, hot-arid climates, residential buildings,
I. INTRODUCTION
This paper discusses the effect of building orientation on indoor thermal comfort of a residential building under the Egyptian climate condition during one week in January. The paper is a part of a PhD project which investigates the indoor thermal comfort of the residential building stocks in October 6th city in Greater Cairo. The project aims to develop a framework to improve the indoor thermal comfort for the existing buildings and study its relationship with the hot arid climate. Analysis of building material, field measurements and personal observations show that there is a significant thermal discomfort in the indoor environment of the apartments because of the poorly adapted design and construction materials to outdoor climate conditions[1].
Cairo is considered one of the world's 16th largest cities in urbanization and population growth and currently accommodates 20 million citizens [2]. As a consequence,, a considerable number of state funded residential projects were
Manuscript received May 5, 2013; revised July 23, 2013. This work was supported in part by the Department of Technology of Architecture at Ferrara University, Italy.
The authors are with the Department of Technology of Architecture, Ferrara University, Ferrara, FE 44100, Italy (e-mail: egylord@ hotmail.com, [email protected], neveen. [email protected], [email protected])
undertaken under the affordable social housing scheme in different regions of Egypt and concentrated in the Greater Cairo region in the past two decades.
This paper studies one of the social housing projects that were built in 6th of October city which is a satellite development on the western side of Greater Cairo. This city is one of the oldest and largest developments among twenty-two developments that were constructed around Greater Cairo in three phases from 1977 to 2000. Forty cities are planned to be built in the future in order to solve the housing problem and to reduce the pressure on services in Cairo city [3].
The site was constructed in 2005 as part of a large scale urban development project under the “National Housing Project” which was launched by the Egyptian government. The project includes 500,000 residential units for low income distributed throughout Egypt within 7 different ownership or rental schemes; ownership of housing units scheme, investors’ lands scheme, build your own house scheme, smaller dwellings (36 m2) for rent scheme, 63 m2 dwelling for rent scheme, family house for rent scheme and ownership for rural house scheme. The present study is focusing on one of the districts that were built under the scheme of 63 m2 apartments for rent.
II. PREVIOUS WORK
Controlling the indoor environment can have significant impacts on both improving comfort and reducing energy consumption [4].
Hensen (1991) Defined thermal comfort as a state in which there are no driving impulses to correct the environment by behavior [5]. ASHRAE standard 55 (2003) stated thermal comfort as that condition of mind which expresses satisfaction with the thermal environment and is assessed by subjective evaluation [6]. According to Szokolay (2008) the variables that affect heat dissipation from the human body and consequently thermal comfort can be grouped into three sets; Environmental (Air temperature, Air movement, Humidity, Radiation), Personal (Metabolic rate, Clothing, State of health, Acclimatization) and Contributing factors (Food and drink, Body shape, Subcutaneous fat, Age and Gender) [7]. This study focuses on Air temperature as it is a dominant environmental factor, as it determines convective heat dissipation [7]-[9].
Humphreys (1978), followed byAuliciems (1981), Nicol and Roaf (1996), Dear et al., (1997) and many others examined a large number of comfort studies investigating the relationship between thermal neutrality and the prevailing
Effect of Orientation on Indoor Thermal Neutrality in
Winter Season in Hot Arid Climates
Case Study: Residential Building in Greater Cairo
climate [6]. He suggested the following equation for the mentioned relationship:
Tn= 11.9 + 0.534 To.av
The neutrality temperature (Tn) has been considered as an
indication for the comfort zone for human body considering with a range of +/-2.5 ˚C[6]. However, there are many other equations for Tnsuggested by other scholars for outdoors and
indoors. The equation was proposed by ASHRAE is this:
Tn= 17.8 =-0.31 To
The present study adopted Auliciems and de Dear’s formula (1985) for indoor thermal neutrality:
Tn,i= 5.41 + 0.731 Ti
Although numerous studies have been undertaken worldwide on thermal comfort, research is still limited on thermal comfort in hot arid climates [11]. The international standards for thermal comfort such as ASHRAE and ISO are almost exclusively based on theoretical analyses of human heat exchange performed in mid-latitude climatic regions in North America and Northern Europe [6],[12]. Although ASHRAE and ISO7730 are based on Fanger’s equation for thermal comfort yet it ignored the adaptive approach which has been proved by many scholars to equally important as the heat balance approach [13].
Nicol (1974) conducted a limited study on sedentary subjects in hot arid area of Iraq and concluded that people who habitually live in hot arid climates were adapted to and mostly comfortable at a globe temperature of 32 degrees. He indicated that his results contrast with a study conducted by Hamphreys and Nicol (1970)on the English office workers who were comfortable at globe temperature of 20-25 ˚C [14]. More recently, Cena and de Dear (2001) carried out a large field study in Kalgoorlie-Boulder, located in a hot-arid region of Western Australia. The purpose of their study was to highlight the effects of indoor climates on thermal perception and adaptive behavior of office workers in air conditioned office buildings. The main result of the study was that thermal neutrality in accordance with the ASHRAE sensation scale occurred at 20.3˚ C in winter and at 23.3 ˚C in summer. The preferred temperature was 22.2˚ C for both seasons [11]. Indraganti (2010) conducted a thermal comfort field survey in summer 2008 on the use of adaptive environmental building controls like windows, doors, curtains and comfort responses in apartment buildings in Hyderabad in India. The study investigated five small to medium sized apartment buildings, having three to six floors. A mixed males and females Sample of 113 subjects in forty-five flats in the five apartment buildings has been investigated. Results indicate that about 60% of the occupants were uncomfortable in summer, furthermore, neutral temperature of 29.2 ˚C and a comfort range of 26.0 ˚C and 32.5 ˚C was specified by regression analysis while the outdoor maximum and minimum air temperature were 40.4 ˚C and 27.3 ˚C respectively. In addition, occupants adaptively used the
physical environmental controls like windows, balcony, doors, external doors and curtains to achieve better comfort in the indoor environment [15].
There were also limited published studies on residential buildings in hot-arid climate in Egypt. Sheta W. (2011) used building simulation modeling ‘Design Builder’ to investigate the thermal performance of an existing residential building and its relationship with building materials at one of the new communities around Cairo El Tagammu’ El Khames. This study aimed mainly to validate design builder simulation software by comparing the indoor and outdoor temperature between the field measurements and simulation work. The main result was that the design of New Cairo buildings didn’t take in consideration the prevailing climate condition [16]. Gado T. and Osman M. (2009) evaluated the effectivenessof natural ventilation strategies used in state funded dwellings in New Al-Minya city in Egypt in two stages. Stage one was a pilot study that investigated designthat transformations that could affect natural ventilation performance such as installing external horizontal and vertical solar shading devices and, changing the window design. Stage two was a computer simulation study using software of Autodesk-Ecotect to evaluate the natural ventilation performance during the hottest period of the year and the computational fluid dynamics software FloVent to investigate the internal air movement patterns. The results of the work showed that cross ventilation and night purge ventilation for the case study could only achieve 4.9% reduction in average temperature, decreasing the effectiveness of passive cooling [17]. Michelle S. and Elsayed H. (2006) conducted a field survey and simulation analysis in Cairo and Alexandria to investigate the energy performance of residential buildings and urban planning and its relationship with climate conditions in both cities. The study aimed at reducing energy consumption, increasing the building energy efficiency and improving the indoor and outdoor comfort level. The study showed how the passive solutions in design have a significant impact among the other different design elements [18].
III. CASE STUDY:CONTEXT,CLIMATE AND BUILDING
CHARACTERISTICS
The study was conducted in October 6th city which lies between Latitude 29° Longitude 30° and lies within the Greater Cairo Region, Egypt. It has a population ranging between 185,000 in its centre and an estimated total of 500,000 inhabitants. The city has a total area of 400 km2 and, is expected to grow to 3.7 million inhabitants. As a result, a
considerable number of state funded residential projects were
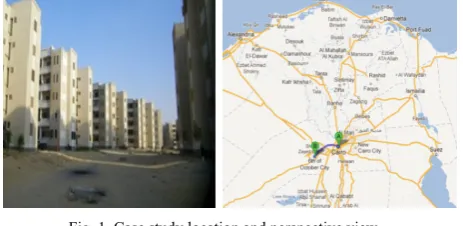
Fig. 1. Case study location and perspective view
where To. a vis the month’s mean outdoor temperature.
where to is the mean outdoor average temperature.
is the mean indoor average temperature. [10]. Ti
undertaken under the affordable social housing scheme in the city. The apartment blocks are designed as a prototype of façade design, height, footprint configuration and finishing materials.
October 6th City is categorized under group B according to Koppen classification as Dry Climates, which are characterized by modest rain and a vast daily temperature range and in almost lies entirely in the sub group: BWh - arid or desert with hot climate.
The building chosen for this study is a newly builtand consists of six floors divided into six prototype apartments with an equal area of 63 m2 for each apartment (Fig. 1). The buildings are oriented and designed irrespective of the bioclimatic conditions and distributed in different regions of Egypt. The building materials and construction techniques were analyzed based on a visual survey and desktop study for the as built drawings. The skeleton structure for the buildings is made entirely of reinforced concrete both for slabs and columns, clay bricks with holes of dimensions 250 x 120 x 60 mm were used for the internal and external walls with cement plastering coating thickness of 12mm and no insulation is used.
IV. METHODOLOGY
The methodology is divided in three main parts. The first part is microclimatic site measurement in order to validate the software results. The second part is to use the validated software code IES<VE> (Integrated Environmental Solutions’ virtual environment) to simulate three different units located within the same building yet with different orientation, and finally comfort zone analysis are undertaken for the three units’ output.
A. Microclimatic Site Measurements
Based on 30 years of data from the metrological Station no. 623660 records at Cairo international airport January is considered to be the coldest month through the year. Therefore, small scale micrometeorology measurements were taken between the 4th till the 10th of January 2013
representing the extreme cold winter, measuring the air temperature and relative humidity for the indoor residential building living spaces. The measurement height was 1.1 m above the ground, corresponding to the average height of the center of gravity for adults [19]. Fig. 2 shows model domains as well as measurement points which were chosen to validate the modeling output. Davis weather station (Fig. 3) was used to record the indoor air temperature and humidity. Davis device can provide temperature readings from -40°C to 65°C with sensor accuracy of ±1°F (±0.5°C). It also measures relative humidity from 0 to 100% with accuracy of ±3% (0 to 90% RH), ±4% (90 to 100% RH).
B. Numerical Modeling and Validation Study
The Integrated Environmental Solutions - virtual environment (IES<VE>) is a building energy modeling software package intended to inform the design of both buildings and environmental system across a range of project scales. As its focus is on controlling internal building conditions, the use of this software to simulate the effect of building orientation on the internal building comfort condition, conforms to ANSI/ASHRAE standard 140 and provides comprehensive thermal simulation.Fig. 4 shows the reference case modeled by IESVE.
The study objectives are first to validate the weather profile in terms of air temperature and relative humidity in the Simulation package IES<VE> version 6.5 by comparing the recorded indoor measurements for air temperature (Ta,in)
and relative humidity (RHin) in three hour intervals during
two days in January with the simulated Ta,in and RHin by
IES<VE> for the same spot in the same apartment during the same time. Then, the study conducted another simulation for the three different orientation apartments within the same building.
C. Comfort Zone Analysis
The study builds a critical analysis based on the ASHRAE comfort zone between the three simulated apartments. The study used the psychrometric chart of ASHRAE to specify the comfort range in the three apartments specified in Fig. 4 in different orientations. A comparison between the three apartments will be held in order to know the effect of orientation on the indoor thermal comfort.
V. RESULTS AND DISCUSSIONS
The indoor air temperature (Ta,in) and humidity (RHin) were
monitored in three hour intervals during one week from 4th of Jan. 2013 until 10th of Jan. 2013. Measurements have been carried out inside a living room space of one of the apartments in the first floor level. In addition, all construction
Fig. 3. Davis weather station
Fig. 4. Reference case model in IES<VE> Fig. 2. The chosen building and the three chosen apartments in
details and materials used in the buildings for external envelop, interior partitions, doors and windows were applied to IES<VE> simulation program. Cairo weather data file which was obtained from the meteorological authority was used for the simulation work. The occupation profile, occupant’s activities profile, windows profiles and doors profiles were obtained from a questionnaire filled by the occupants of the reference case. This questionnaire was distributed to thirty occupants who live in thirty different apartments and it included specific questions about the required data. Fig. 5 shows a comparison between the field measurements and simulated ones for the Ta,in and RHin
specified in three hour intervals during two days (4th and 5th of June), this comparison is to validate the software weather profile in terms of air temperature and relative humidity inside the living room in one of the apartments.
The root mean square error (RMSE) was calculated to ensure the accuracy of IES<VE> simulation software program. (RMSE) is commonly used to calculate the differences between values predicted by a model or an estimator and the values actually observed [20].
The RMSE of an estimator with respect to an estimated parameter could be calculated by the following equation:
RMSE (θ) = MSE θ = E θ θ
In this context, the RMSE between Ta,inmeasured and Ta,in
simulated and between the RHin measured and RHin
Simulated during the two days specified was calculated and the result that it is equal to 3% and 18% respectively. As Maamari et al., (2006) suggested the acceptable percentage difference between the building performance simulation results and the field measurements should be between 10 - 20% [21], so that the differences of 3% and 18% for Ta,in and RHin
respectively are acceptable.
As a result of the previous software validation study, simulation work of IES<VE> was applied to get the hourly values of Ta,in and RHin and consequently to specify the
comfort zone on the ASHRAE psychrometric chart for the other apartments.
ASHRAE psychrometric chart adopted in this study to assign the comfort zone for the three different oriented apartments. According to ASHRAE standard 55-2004 the
upper limit of humidity in the comfort zone specified at 12 g/kg and the lower limit was specified at 4 g/kg.
According to Auliciems and de Dear (1985) [10] The indoor neutral temperature (Tn,i) could be calculated by the
following equation:
Tn,i = 5.41 + 0.731 Ti (1) where Tn,I is the indoor neutral temperature and Ti is the
mean indoor average temperature during the one week of measurements.
Table I shows the neutral temperature and the comfort range by applying equation (1) on our reference case. The comfort range could be specified from (Tn,i +2.5 °C) to (Tn,i
-2.5 °C) [8].
TABLEI:TN,I AND COMFORT RANGE
Orientation
Average
Tin
°C
Tin,i
°C
Comfort range °C
Northern apartment 15 16.4 13.9 to 18.9 Eastern apartment 16 17.1 14.6 to 19.6 Western apartment 15.5 16.7 14.2 to 19.2
By applying the values of the comfort range shown in table 1 on ASHRAE psychrometric chart, the comfort zones are obtained for the three apartments as it shown in Fig. 7. The corresponding SET lines specify the side boundaries of the comfort zone. ET (Effective Temperature) scale suggested by Yagloglou (1927) to recognize the effect of humidity on thermal sensation and it accords mainly with the the dry bulb temperature (DBT) at the saturation curve of the psychrometric chart. Gagge et al., (1974) created the ET* or SET (Standard Effective Temperature) which constructed for 0.57 clo and 1.25 met and it accords with DBT at the 50% RH curve. Up to 14°C humidity has no effect on thermal comfort but away from that the SET lines have an increasing slope [7].
Fig. 6. Comfort zone comparison between the three apartments’ orientation (Northern, Eastern and Western from up to down)
TABLEII:NUMBER OF HOURS IN AND OUT OF COMFORT ZONE FOR THE
THREE APARTMENT ORIENTATIONS
Orientation
Hours inside comfort
zone
Hours cooler than the comfort zone (need heating)
Hours hotter than the comfort zone (need cooling) Northern apartment 96.8 71.2 0
Eastern apartment 84 84 0 Western apartment 85.5 82.5 0
As the one week previously specified includes 168 hours in total. the simulation results and measurements (table 1)show that the Northern apartment has 96.8 hours (57% from total hours) inside the comfort zone,71.2 hours (43 % from total hours) out of the comfort zone need heating and 0 hours out of the comfort zone need cooling. The Eastern apartment has 84hours (50 % from total hours) inside the comfort zone, 84hours (50 % from total hours)out of the comfort zone need heating and 0 hours out of the comfort zone need cooling. The Western apartment has 85.5 hours (51 % from total hours) inside the comfort zone, 82.5hours (49 % from total hours) out of the comfort zone need heating and 0 hours out of the comfort zone need cooling.
However, Fig. 6 And table II confirm that there is no significant difference between the three comfort zones and, as a result, there is no significant effect for the orientation on the indoor thermal comfort in this specific week of the winter season.
REFERENCES
[1] A. Sedki et al., “Field Measurements to Validate Simulated Indoor Air Temperature Predictions: A case study of a residential building in a hot arid climate,” in Proc. of IBPSA conf., Cairo, 2013.
[2] Demographia World Urban Areas, World Agglomerations, 9th annu. ed., 2001, pp. 16
[3] New Uban Community Authority (NUCA). [Online]. Available:http://www.urbancomm.gov.eg/english/cities.asp
[4] G. S. Brager and D. R. J. Dear. (1998). Thermal adaptation in the built environment: a literature review, Energy and Buildings, vol. 27, no. 1, pp. 83-96
[5] J. L. Hensen, “On the thermal interaction of building structure and heating and ventilating system,” Ph.D. dissertation, Technische Universiteit Eindhoven, 1991.
[6] ASHRAE standard 55, Thermal Environmental Conditions for Human
Occupancy, 2nd public review, 2002.
[7] S. V. Szokolay, Introduction to Architectural Science – the Basis of Sustainable Design; 2nd edition, Elsevier Ltd, 2008, ch. 1.
[8] A. Auliciems and S. V. Szokolay, “Thermal Comfort,” in PLEA int. conf. for passive and low energy Architecture in association with Department of Architecture, the University of Queensland Brisbane 4072, 2007.
[9] C. Carr et al., The influence of environmental and physical factors on the thermal patterns of headwater streams, Oregon Agricultural Experiment Station, 2003, series Report 6.
[10] R. J. D. Dear and A. Auliciems, “Validation of the predicted mean vote model of thermal comfort in six Australian field studies,” ASHRAE Trans, vol. 91, no. 2B, pp. 452-486.
[11] K. Cena and R. J. D. Dear, “Thermal comfort and behavioural strategies in office buildings located in a hot-arid climates,” Int. J. of Thermal Biology, vol. 26, pp. 409-414, 2001.
[12] N. Djongyang et al., “Thermal comfort: A review paper,” Renewable and Sustainable Energy Reviews, vol. 14, no. 9, pp. 2626-2640, 2010. [13] F. Nicol, Adaptive thermal comfort standards in the hot–humid tropics.
Energy and Buildings, vol. 36, no. 7, pp. 628-637, 2004.
[14] F. Nicol, “An analysis of some observations of thermal comfort in Roorkee, India and Baghdad,” Annals of human biology, vol. 1, no. 4, pp. 411-426, 1974.
[15] M. Indraganti, “Adaptive use of natural ventilation for thermal comfort in Indian apartments,” Building and Environment, vol. 45, no. 6, pp. 1490-1507, 2010.
[16] W. Sheta, “Delivering Quality Indoor Environment in Houses - The Potentials and Impact of Building Materials for Facade Design in Cairo,” in Proc. of 27th int. Conf. on Passive and Low Energy Architecture, Louvain-la-Neuve, Belgium, pp. 517 – 522, 2011. [17] T. Gado and M. Osman, “Investigating Natural Ventilation Inside
Walk-Up Housing Blocks in the Egyptian Desert Climatic Design Region,” Int. Journal of Ventilation, vol. 8, no. 2, pp. 1473-3315, 2009.
[18] S. Michel and H. Elsayed, “Examples of Low Energy Design at Urban Scale in Egypt,” in Proc. of 23rd int. Conference on Passive and Low
Energy Architecture, Geneva, Switzerland, 2006.
[19] H. Mayer and P. Hoppe, “Thermal Comfort of Man in Different Urban Environments,” Theor. Appl. Clim, vol. 38, pp. 43-49.
[20] J. Rob and B. Anne, “Another look at measures of forecast accuracy,”
Int. J. Of Forecasting, pp. 679-688, 2006.
[21] F. Maamari et al., “Experimental validation of simulation methods for bi-directional transmission properties at the day lighting performance level,” Energy and Buildings, vol. 38, pp. 878-889, 2006.
A. Sedki was born in Egypt on 08 He
received his B.Sc. in architectural engineering, from Cairo University, Cairo, Egypt, 2003. He received his M.Sc. in management and administration of architectural heritage, from Catania University, Catania, Italy. He is also a Ph.D student in technology of architecture, from Ferrara University, Ferrara, Italy.
He is currently working as an assistant lecturer at Ferrara University, while being funded as a PhD scholar in the University previously taught in
the department of Architecture in October 6th University in Egypt,
meanwhile, working as an Architect in many projects inside and outside Egypt. His current research interest is simulation of energy performance and thermal comfort in buildings and its relationship with climate change.
N. Hamzais a senior lecturer in architecture and the
degree programme director of the M.Sc sustainable buildings and environments in the School of Architecture Planning and Landscape. Newcastle University.
Neveen has over 50 publications and heads a research team undertaking research in the field of building energy performance, building performance simulation and Environmental psychology. She is an academic reviewer for various international conferences and a scientific reviewer for various scientific journals in the field.
She is the Vice Chair of the International Building Performance Simulation Association IPBSA-England and the President of the rab Society for
Computer Aided Architectural Design ASCAAD
http://www.ncl.ac.uk/apl/staff/profile/neveen.hamza
T. Zaffagniniis a lecturer in Architectural Technology
Department, Ferrara University. Since year 2000 nowadays he is member of the teacher board of the PhD course in Building Technology (courses from XV to XXIV) organized and coordinated by the Faculty of Architecture of Ferrara with IUAV (University of Venice – Italy), and University of Bologna DAPT (Faculty of Architecture “Aldo Rossi” – Cesena, Italy). He is author of many technical essays on books and Multimedia CD-rom and articles on architectural reviews about restoration, refurbishment and sustainable re-use of historical buildings, about technological innovation and underground architecture.
of Dec. 1980.