260
International Journal of Pharmaceutical Sciences and Drug Research
2018; 10(4): 260-267
Research Article
CODEN (USA): IJPSPP
ISSN: 0975-248X
Preparation and in vitro Evaluation of Solid Dispersions Containing
Nifedipine
G. Muralichand
1, D. V. R. N. Bhikshapathi
2*1Mewar University, NH-79, Gangrar, Chhitorgarh-312901, Rajasthan, India
2Vijaya College of Pharmacy, Hayath nagar, Hyderabad- 501511, Telangana, India
Copyright © 2018 G. Muralichand et al. This is an open access article distributed under the terms of the Creative Commons Attribution-NonCommercial-ShareAlike 4.0 International License which allows others to remix, tweak, and build upon the work non-commercially, as long as the author is credited and the new creations are licensed under the identical terms.
ABSTRACT
The objective of this study was to develop solid dispersions of Nifedipine which has low aqueous solubility and bioavailability. Preliminary solubility studies were carried out using various hydrophilic polymers. The formulations were then optimized and evaluated by in-vitro dissolution studies, X-ray diffraction, FTIR and SEM. Formulation with 1:4:2 ratios of Nifedipine, Labrosol and SLS was found to be the best as it possessed better drug release properties compared to pure drug and other physical mixtures. The optimized formulation SD12 was found to have better drug release of 98.74 ± 5.19% in 90 minutes. From FTIR studies no interaction was takes place between drug and polymers. XRD peaks indicate the successful transformation of drug from crystalline to amorphous form. The final results indicate that the solid dispersion of Nifedipine remained stable over 90 days.
Keywords:Nifedipine, Solid dispersions, Hypertension, Labrosol, Solubility.
DOI: 10.25004/IJPSDR.2018.100408 Int. J. Pharm. Sci. Drug Res. 2018; 10(4): 260-267
*Corresponding author: Dr. D.V. R. N. Bhikshapathi
Address: Vijaya College of Pharmacy, Hayath nagar, Hyderabad- 501511, Telangana, India Tel.: +91-9848514228
E-mail : [email protected]
Relevant conflicts of interest/financial disclosures: The authors declare that the research was conducted in the absence of any commercial or financial relationships that could be construed as a potential conflict of interest.
Received: 12 May, 2018; Revised: 31 May, 2018; Accepted: 04 June, 2018; Published: 20 July, 2018
INTRODUCTION
Bioavailability of drugs having poor water solubility is limited because of their solubility and dissolution rate. Numerous studies have been carried out to increase the
dissolution rate of such drugs. [1] One such research
outcome was solid dispersions that showed promising results in improving solubility, wettability, drug
dissolution rate and therefore its bioavailability. [2] In
solid dispersion formulation, the particle size of drug is reduced to fine or molecular form. The crystalline drug is converted into amorphous form which increases
wettability of the formulation. [3] Several poorly soluble
drugs like Ketoprofen [4], Nimodipine [5] and Tenoxicam
[6] have been successfully formulated to solid
Int. J. Pharm. Sci. Drug Res. July-August, 2018, Vol 10, Issue 4 (260-267) Nifedipine is a calcium channel blocker mainly used for
treatment of hypertension. It reduces the risk of fatal and nonfatal cardiovascular events, primarily strokes
and myocardial infarctions. [7] There are fewer products
available commercially for solid dispersions inspite of
numerous advantages. [8] In solid dispersions, the drug
is dispersed in a fine crystalline or amorphous form in the matrix which when exposed to aqueous media
disperses the drug as fine colloid particles. [9]
Various methods have been designed for the formulation of solid dispersions. They are fusion/ melting, solvent evaporation, lyophilization (freeze drying), melt agglomeration process, extrusion method; spray dry method, use of surfactants, electro static spinning and super critical fluid technology. Solvent evaporation method is most convenient for formulation of solid dispersions without much hassle. It employs an organic solvent to dissolve and disperse the drug and carrier molecule. Use of large volume of solvent formulation may sometimes pose difficulty in
removing it and also may lead to toxicity. [10-11] Thus
small amounts of easily volatile solvents may be used.
MATERIALS AND METHODS Materials
Nifedipine pure drug was generous gift from Aurobindo Pharma Ltd, Hyderabad, India. Kleptose HPB, Poloxamer 407 and PEG 8000 were obtained from BASF, Mumbai. Kolliwax GMS II, Labrosol, Kolliphor RH 40, Avicel PH 102 and Colloidal Silicone dioxide (Aerosil 200) were obtained from Signet Chemical Corp. Pvt. Ltd., Mumbai. Soluplus was gifted by BASF, Germany. Urea and PVP K-30 were gifted by Dow Chemicals, USA. All other chemicals used were of analytical grade.
Preliminary solubility studies of Nifedipine
Solubility measurements of Nifedipine were performed according to a published method given by Higuchi and
Connors in 1965. [12] An excess amount of Nifedipine
was added to 25 ml of aqueous solution of water soluble carriers like Urea, PEG 8000, Labrosol, Soluplus, Kolliphor RH 40, Kolliwax GMS II, Poloxamer 407, Kleptose HPB, Colloidal Silicone dioxide (Aerosil 200), and PVPK-30 in screw capped bottles. Samples were shaken for the 24 hours at room temperature. Subsequently, the suspensions were filtered through a Whatman filter paper no 1. Filtered solution was diluted with methanol and analyzed for
the Nifedipine at UV 338 nm. [13]
Preparation of Nifedipine solid dispersion by the solvent evaporation method
The calculated amount of Nifedipine and the employed polymers of Labrosol, Soluplus, Kolliphor RH 40, Kolliwax GMS II and SLS in different drug, polymer and surfactant ratios of 1:1:0.5, 1:2:1, 1:3:1.5 and 1:4:2 (Shown in table 1) are weighed and mixed together in a porcelain dish. Sixteen different formulae were prepared by the solvent evaporation method. The mixture was dissolved in small amount of methanol.
Then the solvent was evaporated in oven at temperature 50°C until complete evaporation. The solid dispersions prepared were pulverized in a mortar and sieved. The fraction of the powder that passed through 45μm was stored in a desiccator and utilized for further study.
Evaluation of Nifedipine solid dispersions
Solid dispersions obtained by solvent evaporation method were tested for their percentage practical yield,
drug content, FTIR, SEM, XRD, in-vitro release and
stability studies.
Percentage Practical Yield
Percentage practical yield was calculated to know about percent yield or efficiency of any method and help in selection of appropriate method of production. SDs were collected and weighed to determine practical
yield from the following equation. [14]
Drug content
Solid dispersions equivalent to 16 mg of Nifedipine was weighed accurately and dissolved in 100 ml of methanol. The solution was filtered, diluted suitable and drug content was analyzed at λmax 236 nm against blank by UV spectrometer. The actual drug content was
calculated using the following equation as follows. [15]
In vitro Dissolution study of solid dispersion
The USP dissolution test type II apparatus (Electrolab TDT- 06 N, India) was used. Amount of samples equivalent to 16 mg of drug were dispersed into the dissolution vessel containing 900 mL of 0.1 N HCl with pH 1.2 at 37°C and stirred at 50 rpm. Samples were withdrawn periodically, filtered and replaced with a fresh dissolution medium. After filtration through 0.45μm microfilter, concentration of Nifedipine was
determined spectrophotometrically at λ max 236 nm. [16]
Characterization FTIR studies
The instrument used for FTIR study was Shimadzu FTIR-8700 spectrophotometer. In this study, potassium bromide disc method was employed. Pure drug, physical mixtures, andsolid dispersion studied by IR. The powdered sample was intimately mixed with dry powdered potassium bromide. The mixture was then compressed into transparent disc under high pressure using special dies. The disc was placed in IR spectrophotometer using sample holder and spectrum
was recorded. [17]
Powder X-ray diffraction (XRD)
X-ray powder diffraction patterns were recorded on an X-ray powder diffraction system (Shimadzu, Japan) using copper target, a voltage of 40 Kv and a current of
30 mA. [18] The scanning was done over 2_ range of 5º to
Int. J. Pharm. Sci. Drug Res. July-August, 2018, Vol 10, Issue 4 (260-267)
Table 1: Composition of Nifedipine solid dispersions Ingredients &
formulation ratios Nifedipine (mg) GMS (mg) Kolliwax Kolliphor RH 40 (mg) Labrasol (mg) Soluplus SLS (mg) Methanol (mL)
SD11:1:0.5 30 30 - - - 15 Qs
SD2 1:2:1 30 60 - - - 30 Qs
SD3 1:3:1.5 30 90 - - - 45 Qs
SD4 1:4:2 30 120 - - - 60 Qs
SD5 1:1:0.5 30 - 30 - - 15 Qs
SD6 1:2:1 30 - 60 - - 30 Qs
SD7 1:3:1.5 30 - 90 - - 45 Qs
SD8 1:4:2 30 - 120 - - 60 Qs
SD9 1:1:0.5 30 - - 30 - 15 Qs
SD10 1:2:1 30 - - 60 - 30 Qs
SD11 1:3:1.5 30 - - 90 - 45 Qs
SD12 1:4:2 30 - - 120 - 60 Qs
SD13 1:1:0.5 30 - - - 30 15 Qs
SD14 1:2:1 30 - - - 60 30 Qs
SD15 1:3:1.5 30 - - - 90 45 Qs
SD16 1:4:2 30 - - - 120 60 Qs
SEM (Scanning Electron microscope) studies
The surface morphology of the layered sample was examined by SEM (Hitachi, Japan). A small amount of powder was manually dispersed onto a carbon tab (double adhesive carbon coated tape) adhered to aluminum stubs. These sample stubs were coated with a thin layer (30Å) of gold by employing POLARON-E 3000 sputter coater. The samples were examined by SEM and photographed under various magnifications with direct data capture of the images onto a computer. [20]
Stability studies
The optimized solid dispersions were placed inside sealed 40cc HDPE container with child resistant cap under controlled temperature environment inside stability chamber (Thermo Lab, India) with relative humidity of 75% ± 5% RH and temperature of 40 ± 2°C for stability studies. Samples were removed after 1, 2 and 3 months and evaluated for percent drug content
and in vitro dissolution studies. [21]
RESULTS AND DISCUSSION
Preliminary solubility studies of Nifedipine
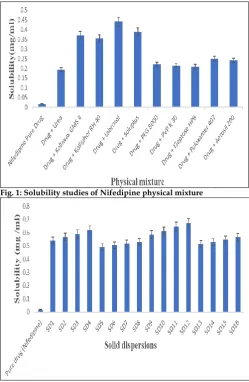
Initially preliminary solubility analysis was carried out to select the appropriate water-soluble carriers for the preparation of solid dispersion in which Nifedipine pure drug solubility was found to be 0.0177 mg/ml. From this study, drug and Labrosol in the ratio of 1:1 exhibits highest drug solubility of 0.442 ± 0.04 mg/ml, almost 25-fold increase compared to that of pure drug. Among all the water-soluble carriers used, Urea, PEG 8000, PVP K 30, Kleptose HPB, Poloxamer 407, Aerosil 200 and Urea showed low solubility and therefore are not included in the preparation of Nifedipine solid dispersions.
Evaluation parameters
Solubility studies of Nifedipine solid dispersions
Nifedipine solid dispersions were prepared by solvent evaporation method with their respective carriers. After preparation of solid dispersion solubility analysis was carried out. The formulation (F12) with Soluplus in the ratio of 1:3 and with SLS shown highest solubility
i.e. 0.672 ± 0.03 mg/ml, almost 11-fold compared to that
of the pure drug (Pure drug solubility is 0.0177 ± 0.04
mg/ml. The results are tabulated in table 3 and
graphical representation is shown in Figure 1 & 2.
Percent Practical yield and drug content
The formulation SD12 was found to have highest percent practical yield and percent drug content of 98.82% and 99.04% respectively when compared with other formulations. The results are given in Table 4.
Fig. 1: Solubility studies of Nifedipine physical mixture
Int. J. Pharm. Sci. Drug Res. July-August, 2018, Vol 10, Issue 4 (260-267)
Table 2: Preliminary solubility studies of Nifedipine in different polymers
Physical Mixture (1:1) Solubility (mg/ml)* Nifedipine Pure Drug 0.0177 ± 0.04
Drug + Urea 0.194 ± 0.003 Drug + Kolliwax GMS II 0.371 ± 0.13 Drug + Kolliphor RH 40 0.354 ± 0.01 Drug + Labrosol 0.442 ± 0.04 Drug + Soluplus 0.389 ± 0.05 Drug + PEG 8000 0.221 ± 0.07 Drug + PVP K 30 0.214 ± 0.11 Drug + Kleptose HPB 0.217 ± 0.02 Drug + Poloxamer 407 0.251 ± 0.12 Drug + Aerosil 200 0.241 ± 0.12 *n= SD ± 3
Table 3: Solubility studies of Nifedipine solid dispersions prepared by solvent evaporation method
S. No Formulation code Solubility (mg /ml)* 1 Pure drug (Nifedipine) 0.0177 ± 0.04 2 SD1 0.539 ± 0.07 3 SD2 0.568 ± 0.10 4 SD3 0.590 ± 0.22 5 SD4 0.619 ± 0.08 6 SD5 0.492 ± 0.02 7 SD6 0.505 ± 0.03 8 SD7 0.518 ± 0.02 9 SD8 0.531 ± 0.04 10 SD9 0.585 ± 0.03 11 SD10 0.612 ± 0.04 12 SD11 0.646 ± 0.01 13 SD12 0.672 ± 0.03 14 SD13 0.513 ± 0.04 15 SD14 0.528 ± 0.03 16 SD15 0.547 ± 0.04 17 SD16 0.566 ± 0.07 *n= SD ± 3
Table 4: Percent Practical yield and drug content for Nifedipine solid dispersions
S. No Formulation % Practical Yield % Drug content 1 SD1 94.21 ± 0.02 91.47 ± 0.01 2 SD2 94.46 ± 0.01 94.77 ± 0.15 3 SD3 95.68 ± 0.03 95.33 ± 0.11 4 SD4 95.88 ± 0.11 96.33 ± 0.17 5 SD5 95.55 ± 0.12 92.47 ± 0.07 6 SD6 96.68 ± 0.08 93.92 ± 0.09 7 SD7 95.98 ± 0.04 94.50 ± 0.10 8 SD8 96.22 ± 0.02 94.52 ± 0.13 9 SD9 95.87 ± 0.09 96.53 ± 0.15 10 SD10 96.26 ± 0.14 96.86 ± 0.17 11 SD11 96.99 ± 0.05 96.97 ± 0.03 12 SD12 98.82 ± 0.14 99.04 ± 0.13 13 SD13 93.87 ± 0.31 92.43 ± 0.05 14 SD14 94.27 ± 0.15 93.37 ± 0.09 15 SD15 95.26 ± 0.09 94.52 ± 0.07 16 SD16 96.28 ± 0.10 95.08 ± 0.03
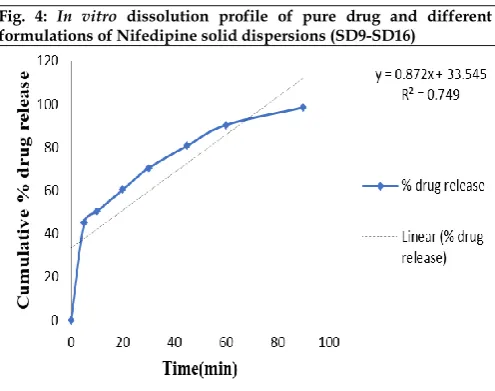
In vitro dissolution studies
The drug release data obtained for formulations SD1-SD16 are tabulated in Tables 5 and 6 which represent the cumulative percent drug released as a function of
time for all formulations. In vitro studies reveal that
there is marked increase in the dissolution rate of Nifedipine from all the solid dispersions when
compared to pure Nifedipine itself. From the in vitro
drug release profile, it can be seen that formulation SD12 containing Nifedipine, Labrosol and SLS in 1:4:2 ratio shows higher dissolution rate of 98.74 ± 5.19
compared with other formulations. The graphical representation of solid dispersions of SD1- SD16 with pure drug is shown in Figures 3 and 4.
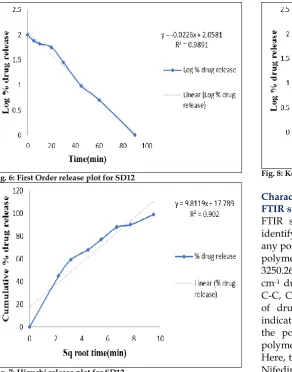
Study of release order kinetics
The obtained in-vitro drug release data was fitted into
zero order, first order, Higuchi and Korsmeyer-peppas equations to know the pattern and mechanism of drug release. The release profiles best fitted into first order and Korsmayer-peppas plots with good linearity of 0.9891 and 0.9609 respectively. This indicates fickian diffusion or burst release as one of the predominant mechanism of drug release (figures 5, 6, 7 and 8).
Fig. 3: In vitro dissolution profile of pure drug and different formulations of Nifedipine solid dispersions (SD1-SD8)
Fig. 4: In vitro dissolution profile of pure drug and different formulations of Nifedipine solid dispersions (SD9-SD16)
Int. J. Pharm. Sci. Drug Res. July-August, 2018, Vol 10, Issue 4 (260-267)
Fig. 6: First Order release plot for SD12
Fig. 7: Higuchi release plot for SD12
Fig. 8: Korsmayer – Peppas release plot for SD12
Characterization FTIR studies
FTIR spectroscopy of Nifedipine was performed to identify the supplied pure drug and find out any possible interactions between drug and the polymers. FTIR study of Nifedipine showed the peak at 3250.26, 1677.21, 1224.14, 1119.06, 1018.86 and 711.14
cm-1 due to the functional group like C-H, C=C, O-H,
C-C, C˗O and N-H respectively. The physical mixture
of drug and polymer also retained the same peak indicating no interaction between the selected drug and the polymers. The FTIR spectra of nifedipine and polymer mixture are shown in figures 9, 10 and 11. Here, the N-H stretching in secondary amine groups of Nifedipine confirm the formation of hydrogen bonding between Nifedipine and water molecules.
Table 5: In vitro dissolution profile of pure drug and different formulations of Nifedipine solid dispersions (SD1-SD8) Time
(min) Pure drug SD1 SD2 SD3 SD4 SD5 SD6 SD7 SD8
0 0 0 0 0 0 0 0 0 0
5 5.67 ± 0.78 22.89 ± 1.35 24.62 ± 1.37 28.11 ± 1.90 30.13 ± 2.22 26.30 ± 1.37 29.16 ± 1.90 30.15 ± 2.19 31.15 ± 2.21 10 10.25 ± 0.80 31.18 ± 2.21 33.17 ± 2.37 38.20 ± 2.49 41.29 ± 2.54 35.12 ± 2.36 38.18 ± 2.49 43.16 ± 2.55 36.04 ± 2.34 20 18.17 ± 0.98 42.15 ± 2.56 44.58 ± 2.58 58.46 ± 2.80 55.67 ± 2.75 46.34 ± 2.59 45.89 ± 2.60 52.17 ± 2.63 42.54 ± 2.56 30 22.19 ± 1.33 50.68 ± 2.60 55.14 ± 2.75 61.38 ± 3.11 68.47 ± 3.26 59.14 ± 2.81 69.47 ± 3.28 63.18 ± 3.21 57.51 ± 2.81 45 25.20 ± 1.45 62.36 ± 3.23 68.27 ± 3.25 70.22 ± 3.84 72.18 ± 3.87 63.22 ± 3.25 75.26 ± 3.86 72.18 ± 3.84 65.40 ± 3.28 60 30.17 ± 1.92 71.24 ± 3.85 78.54 ± 3.96 82.19 ± 4.86 80.24 ± 4.80 77.51 ± 3.96 88.18 ± 4.98 84.26 ± 4.90 76.24 ± 3.97 90 37.55 ± 2.43 83.16 ± 4.90 88.26 ± 4.98 90.44 ± 5.02 91.50 ± 5.05 89.19 ± 4.99 89.78 ± 4.99 91.36 ± 5.02 92.18 ± 5.08
Table 6: In vitro dissolution profile of different formulations of Nifedipine solid dispersions (SD9-SD14) Time
(min) Pure drug SD9 SD10 SD11 SD12 SD13 SD14 SD15 SD16
0 0 0 0 0 0 0 0 0 0
5 5.67±0.78 24.18±1.37 28.16±1.49 38.16±2.49 45.11±2.60 35.19±2.36 30.19±2.19 32.15±2.36 32.15±2.36 10 10.25±0.80 38.19±2.49 35.18±2.36 49.71±2.62 59.42±2.81 47.33±2.59 42.16±2.56 44.19±2.58 44.19±2.58 20 18.17±0.98 44.6±2.58 42.19±2.55 57.18±2.85 68.15±3.30 58.19±2.8 55.25±2.75 58.16±2.80 58.16±2.80 30 22.19±1.33 58.22±2.80 54.26±2.75 69.44±3.28 77.12±3.98 62.11±3.15 63.81±3.21 65.11±3.30 65.11±3.30 45 25.20±1.45 63.22±3.21 65.19±3.20 75.17±3.86 88.14±4.89 72.18±3.84 75.22±3.86 79.10±3.96 79.10±3.96 60 30.17±1.92 74.26±3.85 78.45±3.96 83.45±4.89 90.26±5.02 80.25±4.80 84.49±4.90 81.42±4.80 81.42±4.80 90 37.55±2.43 88.15±4.98 89.96±4.99 92.46±5.11 98.74±5.19 91.26±5.03 90.32±5.02 93.14±5.10 93.14±5.10
X-Ray Diffraction patterns
The Nifedipine solid dispersions were studied for XRD to know whether the solid dispersions are crystalline or amorphous. The presence of numerous distinct peaks in the XRD spectrum of pure Nifedipine indicates that Nifedipine was present as a crystalline material (Figure 12). On the other hand, the spectrum of optimized
Int. J. Pharm. Sci. Drug Res. July-August, 2018, Vol 10, Issue 4 (260-267)
Fig. 9: FTIR spectrum of Nifedipine pure drug
Fig. 10: FTIR spectrum of Nifedipine physical mixture
Int. J. Pharm. Sci. Drug Res. July-August, 2018, Vol 10, Issue 4 (260-267) Position [°2Theta]
10 20 30 40 50 60 70 80
Counts
0 100 200
3
Fig. 12: X-Ray diffractograms of Nifedipine pure drug
Position [°2Theta]
10 20 30 40 50 60 70 80
Counts
0 100 200
2
Fig. 13: X-Ray diffractograms of Nifedipine optimized formulation SD12
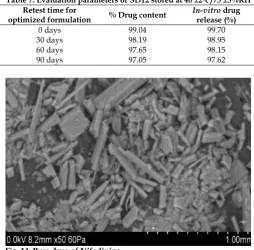
SEM Studies
SEM photographs for pure drug and optimized formulation SD12 are shown in figures 14 and 15. The drug crystals seemed to be smooth-surfaced, irregular in shape and size. For solid dispersions, it was difficult to distinguish the presence of drug crystals. The drug surface in solid dispersion seems to be more porous in nature. Solid dispersions appeared as a homogeneous mass with wrinkled surface. Drug crystals appeared to be incorporated into the particles of the polymers. The solid dispersion looked like matrix particles. This could be due to dispersion of the drug in the molten mass of the polymer.
Stability studies
Stability studies of SD12 formulation was performed for drug content and In vitro drug release studies for 3 months at accelerated stability conditions as per ICH guidelines. The optimized formulation was stable during 3 months period. From these results it was concluded that the formulation was stable and retained most of its properties with minor differences. The results are summarized in table 7.
Table 7: Evaluation parameters of SD12 stored at 40 ±20c /75 ±5%RH
Retest time for
optimized formulation % Drug content In-vitrorelease (%) drug 0 days 99.04 99.70 30 days 98.19 98.95 60 days 97.65 98.15 90 days 97.05 97.62
Int. J. Pharm. Sci. Drug Res. July-August, 2018, Vol 10, Issue 4 (260-267)
Fig. 15: Nifedipine optimized formulation SD12
Solid dispersions of Nifedipine were prepared by solvent evaporation method using hydrophilic polymer Labrosol and SLS as a surfactant. The type and amount of carrier was found to be important in increasing the
solubility of Nifedipine. The in-vitro dissolution and
kinetic modelling studies indicate that solid dispersions are one of the best methods to enhance the oral solubility and bioavailability of Nifedipine.
REFERENCES
1. Venkat YB, AdhikraoVY. Enhancement of solubility and dissolution rate of BCS class II pharmaceuticals by non aqueous granulation technique. International Journal of Pharma Research and Development. 2010; 1: 1‐12.
2. Serajuddin ATM. Solid dispersion of poorly water‐soluble drugs: early promises, subsequent problems, and recent breakthroughs. J. Pharm. Sci. 1999; 88: 1058‐1066.
3. Christian L, Jennifer D. Improving drug solubility for oral deliveryusing solid dispersions. Eur. J. Pharm. Biopharm. 2000; 50: 47‐ 60.
4. Rogers JA, Anderson AJ. Physical characteristics and dissolution profiles of ketoprofen‐urea solid dispersions. Pharmaceutica Acta Helvetiae. 1982; 57: 276‐281.
5. Murali Mohan Babu GV, Prasad CHDS, Ramana Murthy KV. Evaluation of modified gum karaya as carrier for the dissolution enhancement of poorly water soluble drug nimodipine. Int. J. Pharm. 2002; 234:117.
6. El‐Gazayerly ON. Characterization and evaluation of tenoxicam co precipitates. Drug Dev. Ind. Pharm. 2000; 26: 925‐930.
7. https://www.drugs.com/dosage/nifedipine.html
8. Ford JL. The current status of solid dispersions. Pharm Acta Helv. 53: 93‐98 (1986).
9. Chiou WL, Riegelman S. Pharmaceutical applications of solid dispersion systems. J Pharm Sci. 1971; 60(9): 1281-302. 10. Butler and Mattew J. Method of producing a solid dispersion
of a poorly water-soluble drug. 1999; United State Patent No. 5985326.
11. Kim EJ, Chun MK, Jang JS, Lee I H, Lee KR, Choi HK. Preparation of a solid dispersion of felodipine using a solvent wetting method. Eur J pharm Biopharm. 2006; 64(2): 200-5. 12. Higuchi T, Connors K. Phase-solubility techniques. Adv Anal
Chem Instrum. 1965; 4:117-212.
13. Chen S, Zhu J, Ma F, Fang Q, Li Y. Preparation and characterization of solid dispersions of dipyridamole with a carrier "copolyvidonum Plasdone S-630". Drug Dev Ind Pharm. 2007; 33(8): 888-99.
14. Lakshmi K, Reddy MPK, Kaza R. Dissolution enhancement of telmisartan by surface solid dispersion technology. International Journal of Innovative Pharmaceutical Research. 2012; 3(4): 247-251.
15. Shingala K, Chauhan CS, Dumaniya D, Patel B. Formulation development and evaluation of immediate release tablet of poorly soluble Candesartan Cilexetil. Journal of Pharmaceutical science and Bioscientific Research. 2013; 3 (2): 77-90.
16. Valizadeh H, Nokhodchi A, Qarakhani N. Physicochemical characterization of solid dispersions of nifedipine with PEG 6000, Myrj 52, lactose, sorbitol, dextrin, and Eudragit E100. Drug Dev IndPharm. 2004; 30(3):303-17.
17. Yang M, Wang P, Huang CY. Solid dispersion of acetaminophen and poly (ethylene oxide) prepared by hot-melt mixing. Int J Pharm. 2010; 395(1-2):53-61.
18. Chaulang G, Patel P, Hardikar S, Kelkar M, Bhosale A, Bhise S. Formulation and Evaluation of Solid Dispersions of Furosemide in Sodium Starch Glycolate. Tropical Journal of Pharmaceutical Research. 2009. 8(1): 43-51.
19. Shamma RN, Basha M. Soluplus®: A novel polymeric solubilizer for optimization of Carvedilol solid dispersions: Formulation design and effect of method of preparation. Powder Technology. 2013; 237: 406–414.
20. Breitenbach J. Melt extrusion: From process to drug delivery technology. Eur J Pharm Biopharm. 2002; 54: 107–117. 21. Dhirendra K, Lewis S, Udupa N, Atin K. Solid Dispersions: A
Review. Pak. J. Pharm. Sci. 2009; 22(2):234-246.