233
International Journal of Pharmaceutical Sciences and Drug Research
2018; 10(4): 233-245
Research Article
CODEN (USA): IJPSPP
ISSN: 0975-248X
Solubility Enhancement of Aripiprazole by Solid-Self Emulsifying Drug
Delivery Systems
Amoolya Chennuri, D. Prasanthi
*Department of Pharmaceutics, G. Pulla Reddy College of Pharmacy, Mehdipatnam, Hyderabad-500028, Telangana, India
Copyright © 2018 Amoolya Chennuri et al. This is an open access article distributed under the terms of the Creative Commons Attribution-NonCommercial-ShareAlike 4.0 International License which allows others to remix, tweak, and build upon the work non-commercially, as long as the author is credited and the new creations are licensed under the identical terms.
ABSTRACT
Self-emulsifying drug delivery systems are a promising approach for the formulation of drug compounds with poor aqueous solubility. The main objective of this work was to formulate liquid and solid-self emulsifying drug delivery systems for poorly soluble aripiprazole. Aripiprazole is an atypical anti-psychotic drug used in the management of schizophrenia. The maximum solubility of aripiprazole was found in oleic acid (oil), Tween 80 (surfactant) and Transcutol P (co-surfactant). The L-SMEDDS were formulated in different ratios of oil: s-mix (surfactant: co-surfactant) from 1:9 to 9:1. For the formulation of stable SMEDDS, micro-emulsion region was identified by constructing pseudo-ternary phase diagram by phase titration method. The optimized F4 formulation was at the ratio of 4 (oil): 6 (s-mix). In-vitro drug release of F4 was significantly higher (99.89%) when compared to the pure drug (43.63%) in 1 hour. The F4 formulation had a droplet size of 115.9 nm and zeta potential of -24.9 mV. The pre-compression and post-compression parameters of the optimized S-SMEDDS formulation (SS1) containing Neusilin US2 as solid adsorbent were within the limits as per the official requirements of the Pharmacopoeia. SS1 formulation showed a better drug release (97% in 20 minutes) when compared to the marketed drug (59.75%) and pure drug (19.77%). In conclusion, this study illustrated that adsorption to solid carrier technique could be a useful method to prepare the solid SMEDDS tablets from liquid SMEDDS, which can enhance the solubility and improve the in-vitro drug release of aripiprazole.
Keywords:Self-emulsifying drug delivery systems, aripiprazole, poorly soluble, pseudo-ternary phase diagram.
DOI: 10.25004/IJPSDR.2018.100405 Int. J. Pharm. Sci. Drug Res. 2018; 10(4): 233-245
*Corresponding author: Dr. D. Prasanthi
Address: Department of Pharmaceutics, G. Pulla Reddy College of Pharmacy, Mehdipatnam, Hyderabad-500028, Telangana, India Tel.: +91-9490052147
E-mail: [email protected]
Relevant conflicts of interest/financial disclosures: The authors declare that the research was conducted in the absence of any commercial or financial relationships that could be construed as a potential conflict of interest.
Received: 04 May, 2018; Revised: 08 June, 2018; Accepted: 11 June, 2018; Published: 20 July, 2018
INTRODUCTION
Oral route is considered as the most effective route of drug delivery not only by the patients but also by the manufacturers for the treatment of most of the
Int. J. Pharm. Sci. Drug Res. July-August, 2018, Vol 10, Issue 4 (233-245)
(SMEDDS) are characterized as isotropic blends of regular or manufactured oils, solid or liquid surfactants and on the other hand, one or more hydrophilic solvents and co-solvents/surfactants that have the ability of forming fine oil-in-water (o/w) micro emulsions upon gentle agitation followed by agitation in an aqueous medium, such as GI fluid. SMEDDS spread promptly in the GI tract and the digestive motility of stomach and intestines provides the agitation required for the formation of self-emulsion. [2]
Generally, SMEDDS are prepared as solid dosage forms and are administered in soft gelatine capsules. But, these capsules incur high production costs and have lower stability, portability and drug loading capacity. [3-4] Hence, development of solid SMEDDS reduces the
productions costs and provides high stability, reproducibility and better patient compliance. [4]
Most of the drugs are poorly water-soluble and the formulators face several technical challenges during the formulation of these compounds. The poorly soluble drugs are typically Biopharmaceutical Classification System (BCS) class II or class IV compounds.
Over the past few decades, self-emulsifying drug delivery systems (SMEDDS) have emerged and the demand has increased further after the invention of lipid-based oral pharmaceutical products. [5] With this
background in mind the present research work focuses on the development of solid self-emulsifying drug delivery systems of a poorly water-soluble drug, aripiprazole, an oral atypical anti-psychotic agent used in the management of schizophrenia. It is a BCS class IV drug i.e. poorly soluble and poorly permeable. The L-SMEDDS are converted to S-SMEDDS using different solidification techniques. One of the common and simplest techniques is capsule filling. The liquid or semisolid formulations can be encapsulated for oral route. Capsule filling is advantageous due to its simplicity of manufacturing, high drug loading potential and suitability for low-dose highly potent drugs. [6-7] In spray drying technique, dry particles are
formed in a volatile phase under controlled temperature and airflow conditions. [8] In melt
granulation technique, a binder is added to form powder agglomeration that melts or softens at low temperatures. Melt granulation is advantageous over conventional wet granulation as the addition of liquid and subsequent drying phase are omitted. [8-9]
L-SMEDDS can also be converted into free-flowing powders by adsorption to solid carriers. It is a simple process and involves the addition of L-SMEDDS onto the solid carriers by mixing in a blender. This free-flowing powder can either be filled into capsules or can be mixed with suitable excipients and compressed into tablets. A significant advantage of adsorption technique is content uniformity. High levels of L-SMEDDS (up to 70% w/w) can be adsorbed onto suitable carriers. [7]
Melt extrusion technique involves the conversion of a raw material into a proper shape and density under
controlled temperature, product flow and pressure conditions. This technique provides high drug loading capacity and content uniformity. [10]
A phase diagram is constructed to capture the relationship between the phase behaviour of a mixture and its composition. A ternary phase diagram shows the phase behaviour of a simple micro-emulsion system comprising oil, surfactant and co-surfactant. Each of the three corners of the phase diagram represents 100% of that particular component. [11] Pseudo-ternary phase
diagrams were constructed using predetermined amounts of oil, surfactant and co-surfactant. The mixtures of surfactant: co-surfactant was formulated in different ratios (4:1, 3:1, 2:1, 1:1). The ratio of oil: Smix (Surfactant: co-surfactant) was also varied from 9:1 to 1:9. Water was added drop by drop to a pre-determined amount of oily mixture under constant magnetic stirring. These mixtures were equilibrated overnight and micro-emulsions were identified through visual observation and polarized light microscopy and were differentiated from liquid crystalline systems and coarse emulsions. Cut and weight system was used to measure the contribution of each system to the total area of the phase diagram. [11-12]
Each corner represents 100% of one component. (A, B or C) weight of each system and total weight of the phase diagram were determined and the percentage occupied by each region was calculated. The side-lines joining these corners represent a two-compartment mixture of AB, AC and BC. A point inside the triangle corresponds to a three-component system comprising A, B and C. [13-14]
MATERIALS AND METHODS Materials
Aripiprazole was a gift sample from Suven life sciences. Oleic acid (Cis-9-Octadecenoic acid, (Z)-Octadec-9-enoic acid) was bought from MolyChem. Tween 20 (Polysorbate 20 monooleate), Tween 80 (Polysorbate 80 sorbitan monooleate) were bought from Sisco research laboratories Pvt. Ltd. Transcutol P (Diethylene glycol monoethyl ether) was bought from Alfa Aesar – A Johnson Matthey Company. Neucilin US2 (Amorphous Magnesium Aluminometasillicate) and Fujicalin (Dibasic calcium phosphate anhydrous) was obtained as a gift sample from Gangwal Chemicals Pvt. Ltd.
Method of preparation
The L-SMEDDS were prepared by phase titration method. The drug was added to the co-surfactant and then at 60°C oil was added drop by drop with continuous stirring. As the drug gets solubilised the formulation was brought back to room temperature and the surfactant was added slowly drop wise with gradual stirring. This mixture is known as the self-micro emulsifying drug delivery system. Water is then added drop wise with continuous stirring to the total content for diluting the sample. [15]
Int. J. Pharm. Sci. Drug Res. July-August, 2018, Vol 10, Issue 4 (233-245)
Solubility of aripiprazole in various oils, surfactants and co- surfactants was determined by shake flask method. In this study, an excess amount of aripiprazole (approximately 100 mg) was added to 2 ml of each vehicle in screw-capped glass vials. The mixture was mixed using orbital shaker to get uniform slurry; vials were fixed in to shaker and stirred for 72 hours. The samples were centrifuged at 4500 rpm for 10 min to separate the supernatant. Aliquots of supernatant were taken, filtered through syringe filter, filtrate was suitably diluted with water and drug content was quantified by measuring absorbance at 218 nm using UV spectroscopy. [16]
Drug-excipients compatibility studies
An FTIR spectrophotometer was used to obtain the infrared spectra of drug in the isotropic mixtures of excipients. Analysis of pure drug, Tween 80, Transcutol P, Tween 20, oleic acid, physical admixtures of the drug with the excipients were carried out using FTIR with KBr disc. All the samples were dried under vacuum prior to obtaining any spectra in order to remove the influence of residual moisture. This study was performed to ensure the compatibility between the excipients and drug.
Construction of pseudo-ternary phase diagram
The relation between composition of a mixture and its phase behaviour can be known with construction of phase diagram. Pseudo ternary phase diagrams were developed by water titration method against oil, surfactant and co-surfactant. The weight ratio of surfactant and co-surfactant was differed as 1:1, 1:2, 1:3, 1:4, and 2:1, 3:1, 4:1 respectively. Oil and surfactant/co-surfactant mixture mixed thoroughly in various weight ratios (i.e. 1:9, 2:8, 3:7, 4:6, 5:5, 6:4, 7:3, 8:2, 9:1) respectively. Water was added slowly drop by drop using 100µl micropipette under vigorous stirring at 37°C until the mixture was obtained clear through which the concentrations of the components were recorded. The concentrations of the components were recorded in order to complete the pseudo ternary phase diagrams, and then the contents of oil, surfactants, co-surfactant and water at appropriate weight ratios’ were selected based on these results. In order to prepare SMEDDS, selection of micro emulsion region from phase diagram was based on the fact that solution remains clear even after infinite dilution. [1]
Formulation of emulsions
From the pseudo-ternary phase diagrams the different ratios of oil: Smix were selected and drug was incorporated by solubilising in oil phase. The formulation of emulsions is given in Table 1. [15]
Evaluation parameters of aripiprazole loaded L-SMEDDS
Thermodynamic stability studies
The objective of thermodynamic stability is to evaluate the phase separation and effect of temperature variation on SMEDDS formulations. SMEDDS were diluted to 100 fold with distilled water and centrifuged at 10,000 rpm for 20 minutes and formulations were
observed visually for phase separation. To evaluate the effect of temperature, the liquid SMEDDS formulations were subjected to 4°C for 2 days followed by 45°C for 2 days. [16-17] At the end of the cycle, the formulations
were diluted and centrifuged as described above and evaluated for phase separation. [17]
Visual observation and phase separation
200 ml of distilled water or 0.1N HCl was taken in a beaker and each aripiprazole loaded SMEDDS formulation was dropped into water and at 37°C, and the diluted preparation was vortexed for 1.0 min. This preparation was stored for 24 hours and then phase separation and precipitation was observed visually. Mixtures exhibiting a negligible phase separation during the 2 hour period were used for subsequent studies. It gives the information about stability and viability of the formed micro emulsion. [18]
Robustness to dilution
It was studied by diluting the liquid SMEDDS to 50, 100, and 1000 fold with water and 0.1N HCl solution. It was observed for any phase separation and drug precipitation. [19]
Self-emulsification time
The time for a pre-concentrate to form a homogeneous mixture upon dilution was monitored by visually observing the disappearance of SMEDDS and the final appearance of the micro emulsion in triplicate. A visual test to assess the self-emulsification properties of SMEDDS formulation was performed by visual assessment as previously reported. [6] It was
determined by USP type I apparatus by taking 2.1 ml of each formulation added drop wise to 500 ml of purified water at 37°C. Gentle agitation was provided by standard stainless-steel dissolution paddle rotating at 50 rpm. Emulsification time was assessed visually. [20]
Dispersiblity test
The efficiency of self- emulsification of oral SMEDDS was assessed using USP XXII dissolution apparatus. One millilitre of each formulation was added to 900 mL of water at 37 ± 0.5°C. The in vitro performance of the formulations was visually assessed using the following grading system. [21] The grades of emulsion dispersion
are given in Table 2. [21]
Determination of drug content
Aripiprazole from SMEDDS formulation was extracted in methanol using sonication technique. The solutions were filtered, using Whattman filter (25µg) paper. The methanolic extract was analysed for the aripiprazole content spectrophotometrically at 218 nm using standard curve. [6]
In-vitro drug dissolution
Int. J. Pharm. Sci. Drug Res. July-August, 2018, Vol 10, Issue 4 (233-245)
determined using UV-spectrophotometer. The withdrawn volume of samples was replaced by fresh dissolution medium every time. [11]
Droplet size measurement
The droplet size and poly dispersity index (PDI) of SMEDDS, 100 times diluted with double distilled water were determined using a Malvern Zeta Sizer. The PDI indicates the width of a particle distribution, prior to the measurement; the samples were diluted with double distilled filtered water to a suitable scattering intensity. [11, 16]
Zeta Potential (ZP)
The ZP is a measure of the electric charge at the surface of the particles indicating the physical stability of colloidal systems. ZP was measured using a Zeta Sizer. Each sample was suitably diluted with double distilled filtered water and placed in a disposable zeta cell. The ZP values were assessed by determining the particle electrophoretic mobility. The electrophoretic mobility was converted to the ZP via the Helmholtz-Smoluchowski equation. All measurements were performed in triplicate. [22]
Transmission electron microscopy (TEM)
SMEDDS were diluted with distilled water and mixed by gentle shaking. Copper grids were allowed to stand for 60 seconds and one drop of the sample after dilution was deposited. Filter paper is used to remove excess fluid and then the grid was stained in 1% phosphotungstic acid solution for 30 seconds. By following the above method which is transmission electron microscopy (TEM) the morphology of SMEDDS was provided by giving information on the porosity and microstructure. [11]
Conversion of L-SMEDDS to S-SMEDDS
The optimized liquid SMEDDS formulations (F4, F20) based on evaluation parameters and dissolution study were converted into free-flowing powder by adsorption onto solid carriers. The solid carrier used for adsorption comprised of materials that provided a high surface area with good disintegration characteristics. Prosolv SMCC 50(Silicified microcrystalline cellulose), Neusilin US2 (Amorphous Magnesium aluminometasillicate) and Fujicalin (Dibasic calcium phosphate anhydrous) were used as solid carriers. They can absorb the liquid SMEDDS at elevated levels up to 70% (w/w). The conversion process involved addition of liquid formulation onto carriers under continuous mixing. The powders were dried and compressed into tablets using a rotary tablet punching machine (Rimek1 rotary, Ahmedabad) with 11.9 mm round flat punch. [23]
Holding capacity of adsorbents
The appropriate amounts of carrier and coating material used for each formulation depend on the liquid load (Lf) factor of the formulation. The
L-SMEDDS formulations were taken and a calculated amount of carrier was added by continuous mixing in the mortar. Then, coating material was added and mixed until mortar contents start to look dry. The Lf
factor is calculated based on the amount of adsorbent
adsorbed by the formulations. In the last stage of the preparation MCC was added and mixed. [23]
Lf = W/Q
Where, W = L-SMEDDS formulation and Q = Carrier material.
Formulation of S-SMEDDS
Based on the Lf factor, the amount of excipients was
determined and the liquid-SMEDDS were converted to Solid-SMEDDS. The formulation of S-SMEDDS is given in the Table 3. [14]
Evaluation parameters of aripiprazole loaded S-SMEDDS
Angle of repose
The angle of repose was determined by the funnel method suggested by Newman. [23] Angle of repose is
determined by the following formula. Tan θ = h/r Therefore θ = Tan-1 h/r
Where: θ = Angle of repose, h = Height of cone, and r = radius of the cone base
Bulk density
Bulk density, ρb, is defined as the mass of the powder
divided by the bulk volume. [23]
ρb= Weight in gms / Vb (bulk volume)
Tapped density
Tapped density, ρt, is defined as the mass of the
powder divided by the tapped volume. [23]
ρt = Weight in grams / Vt (tapped volume)
Compressibility index
Carr’s index was calculated from the following equation using the values of bulk density (ρb) and
tapped density (ρt) obtained in the earlier experiments. [23]
C = (ρt – ρb / ρt) x 100
Hausner’s ratio
Hausner’s ratio is an indirect index of ease of powder flow. It is calculated by the following formula
Hausner’s ratio = ρt / ρb
Where ρt is tapped density and ρbis bulk density.
Lower Hausner’s ratio (<1.25) indicated better flow properties then higher ones. [23]
Weight variation
Twenty tablets were randomly selected and average weight was determined. Then individual tablets were weighed and percent deviation from the average was calculated. [24]
Hardness
The strength of tablet is expressed as tensile strength (Kg/m3). The tablet crushing load which is the force
required to break a tablet into pieces by compression. It was measured using a tablet hardness tester (Monsanto hardness tester). Three tablets from each formulation batch were tested randomly and the average reading was recorded. [24]
Thickness
Int. J. Pharm. Sci. Drug Res. July-August, 2018, Vol 10, Issue 4 (233-245)
selected for manufacturing the tablets. The thickness of tablet is measured by screw gauge. The thickness of the tablet is related to the tablet hardness. Tablet thickness should be controlled within a ±5 % variation of a standard value. In addition, thickness must be controlled to facilitate packaging. The thickness in millimetres (mm) was measured individually for 10 pre weighed tablets by using screw gauge. The average thickness and standard deviation were reported. [21]
Disintegration time
Disintegration time of tablets was determined in a tablet disintegration test apparatus, using 0.01N HCl 1000 mL at 37 ± 2°C as disintegration medium. [21]
Friability
Friability of the tablets was determined using Roche Friabilator (Electrolab, India). This device consists of a plastic chamber that is set to revolve around 100 rpm for 4 minutes dropping the tablets at a distance of 6 inches with each revolution. Pre-weighed sample of 20 tablets was placed in the friabilator and were subjected to 100 revolutions. Tablets were dusted using a soft muslin cloth and reweighed. The friability (F%) is given by the formula
F% = (1-Wo/W) x 100
Where, Wo is weight of the tablets before the test and W is the weight of the tablets after the test. [21]
Drug Content
20 tablets were randomly selected and average weight was calculated. Tablets were powdered in a glass mortar. Powder equivalent to 75 mg was weighed and dissolved in 10 mL of methanol and the volume was made to 100 mL with distilled water in a 100 mL volumetric flask. Dispersions were filtered and 1 mL aliquot of the above solutions were taken and diluted to 10 mL with 0.01N HCl respectively.
The concentration of the resultant solution was 10µg/ml, the absorbances of these solutions were determined at a wavelength of 218 nm against the blank. The percentage assay was calculated from the standard curve. [25]
In vitro dissolution studies
In vitro drug release study of S-SMEDDS was performed using USP dissolution apparatus type II. 900 ml of 0.1N HCl was placed in the dissolution vessel along with S-SMEDDS formulation and was stirred at 50 rpm at 37°C. 5 ml of samples were withdrawn at pre-determined time intervals of 5, 10, 15, 30, 45 and 60 mins and the drug concentration was determined using UV-spectrophotometer at 218 nm. The withdrawn volume of samples was replaced by fresh dissolution medium at every time interval. [21]
XRD Studies
XRD is performed for the optimized S-SMEDDS formulation. The crystallinity of the prepared optimized mixture was studied by XRD. The change in amount of crystallinity was studied. XRD analysis was performed using D-5000 Siemens X-ray diffractometer using Copper Kα (^ = 1.5406 A°) radiation. The data were recorded over a scanning 2θ range of 5° to 50° at a
step time of 0.045 steps/0.5 sec. The pure drug is analysed by XRD in same manner and the peak intensity and presence of new peaks were noted. The diffractograms of the optimized S-SMEDDS mixture were superimposed with that of pure drug. [26]
DSC Studies
The physical nature of the optimized S-SMEDDS was studied by DSC, where the conversion of crystalline drug into amorphous form was studied. DSC analysis was performed using Q-1000 TA Instruments Perkin-Elmer pyris differential scanning calorimeter (DSC). The instrument was calibrated with indium standard. 3-5 mg samples were weighed and placed in a closed, hermetic sample pans with pin hole. Thermograms were obtained by heating the sample at a constant rate of 10°C/min. A dry purge of nitrogen gas (50 ml/min) was used for all runs. Samples were heated from 0°C to 210.0°C. The melting point, heat of fusion, disappearance of the crystalline sharp peak of the drug and appearance of any new peak and peak shape were noted. The thermogram of the optimized S-SMEDDS formulation was superimposed with that of pure drug.
[26]
Comparison with marketed drug and pure drug
The drug dissolution rate of the optimized S-SMEDDS was compared with the marketed drug and pure drug. It was performed using USP dissolution apparatus type II. 900 mL of 0.1N HCl was placed in the dissolution vessel and the formulations were placed in the dissolution medium and were stirred at 50 rpm at 37°C. 5 mL of samples were withdrawn at pre-determined time intervals of 5, 10, 15, 30, 45 and 60 mins and the drug concentration was determined using UV-spectrophotometer at 218 nm. The withdrawn volume of samples was replaced by fresh dissolution medium every time interval. [21]
Accelerated stability studies
The optimized formulation was subjected to stability studies at 40°C ± 2°C/75% ± 2% RH for a period of one month. Each tablet was individually wrapped in aluminium foil and packed in amber coloured bottle and put at above specified condition in a heating humidity chamber for one month. The tablets were analysed for the hardness, disintegration time, drug content, and in vitro drug release every week for a period of one month. [27]
RESULTS AND DISCUSSION
Selection of oils, surfactants and co-surfactants
From the results of solubility studies, aripiprazole drug was more soluble in oleic acid (oil), Tween 80 (surfactant), Transcutol P (Co-surfactant) and shown in Table 4. [16] Hence oleic acid is selected as the oil phase,
Int. J. Pharm. Sci. Drug Res. July-August, 2018, Vol 10, Issue 4 (233-245)
Table 1: Formulation of L-SMEDDS
Formula tion code Sm ix Rat io Oil:S mix Drug
(mg) Oil Surfactant Co surfact ant Aripipra zole Ol eic aci d Twe en 80 Twe en 20 Transc utol F1 F2 F3 F4 F5 F6 F7 F8 F9 F10 F11 F12 F13 F14 F15 F16 F17 F18 F19 F20 F21 F22 1:1 2:1 3:1 4:1 1:1 1:2 1:3 1:4 1:1 4:1 1:1 2:1 3:1 4:1 1:2 1:4 3:1 1:2 4:1 1:1 1:3 1:4 4:6 4:6 4:6 4:6 4:6 4:6 4:6 4:6 5:5 5:5 5:5 3:7 3:7 3:7 3:7 3:7 2:8 2:8 6:4 6:4 6:4 6:4 100 100 100 100 100 100 100 100 100 100 100 100 100 100 100 100 100 100 100 100 100 100 4 4 4 4 4 4 4 4 5 5 5 3 3 3 3 3 2 2 6 6 6 6 3 4 4.5 4.8 - - - - 2.5 4 - 4.7 5.3 5.6 - - 6 - 3.2 - - - - - - - 3 2 1.5 0.8 - - 2.5 - - - 2.3 1.4 - 2.7 - 2 1 0.8 3 2 1.5 1.2 3 4 3.5 3.2 2.5 1 2.5 2.3 1.8 1.4 4.7 5.6 2 5.3 0.8 2 3 3.2
Table 2: Grades of emulsion dispersion Grades Appearance
A Rapid forming emulsion, which is clear and transparent in appearance.
B Rapid forming, slight less clear emulsion which has a bluish white appearance.
C Bright white emulsion or grayish white emulsion with slight oily appearance that is slow to emulsify.
D Exhibit poor or minimal emulsification with large oil droplets present on the surface.
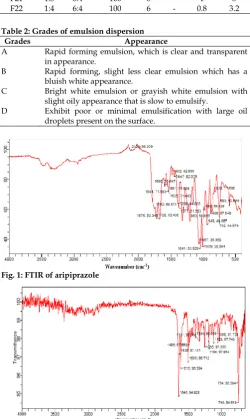
Fig. 1: FTIR of aripiprazole
Fig. 2: FTIR of L-SMEDDS formulation (F4) with pure drug and excipients (Oleic acid, Tween 80, Transcutol P)
Fig. 3: FTIR of S-SMEDDS formulation (SS1) with pure drug and excipients (Neusilin US2, Aerosil, Microcrystalline cellulose)
Drug excipients compatibility studies
IR study was done to verify if there was any interaction between the pure drug and various excipients used in formulations. The spectrum of aripiprazole (Figure 1)
[15] and physical mixture of aripiprazole and excipients
(Tween 80, Oleic acid and Transcutol P) (Figure 2) [15]
were recorded by the liquid membrane method using IR spectrophotometer in the range of 400-4000 cm-1 and
compared. The S -SMEDDS samples containing the liquid SMEDDS and excipients (Neusilin US 2, Fujicalin, MCC) (Figure 3) [15] were recorded by KBr
pellet method using IR spectrophotometer in the range of 400-4000 cm-1 and compared.
From the IR graphs the peaks representing the pure drug were similar and suggesting that there is no interaction, it was found that the functional peaks were retained after the formation of micro-emulsion using various excipients. It infers that the pure drug was not altered functionally. Hence there is no interaction between drug and excipients. This implies that the drug was stable and also compatible with other excipients throughout the process.
Construction of pseudo-ternary phase diagram
Int. J. Pharm. Sci. Drug Res. July-August, 2018, Vol 10, Issue 4 (233-245)
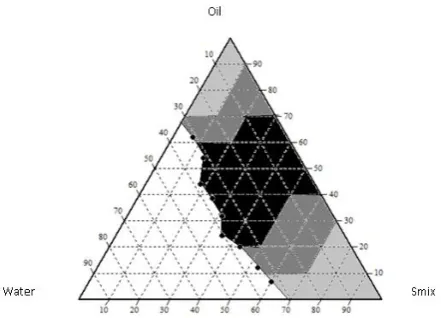
and in the concentration of oil taken was maximum, i.e. 90%, and amount of S/CoS was kept minimum, i.e., 10%. Gradually, oil concentration was decreased and that of S/CoS was increased. It was observed during these experiments that high concentration of oil forms poor emulsion with requirement of very less amount of water upon dilution. Another observation was that as concentration of S/CoS increases, the time estimated to form micro-emulsion decreases. [7] The area of
micro-emulsion in different ratios of oil: smix is shown in the Figure 4. [1] The darker region is the area where the
emulsion is showing the highest stability. The region around the darker region shows less stability of the emulsion. The lighter region at the corners of the phase diagram is where the emulsion has no stability. The highest stability was observed L-SMEDDS containing Oleic acid, Tween 80 and Transcutol P at 4:1 Smix ratio. The concentration of oil was found to be a rate-limiting factor and in all aspects, high oil concentration resulted in poor emulsion region. [28] The black boundary covers
the micro-emulsion region. At any point beyond this boundary, micro-emulsion if formed initially, become turbid on further dilution of solution. The formulations that are more stable and resulted in fine emulsion are further subjected to evaluation parameters.
Fig. 4 : Ternary phase diagram of Oleic acid, Tween 80, Transcutol P at Km values 1(4:1)
Fig. 5: In vitro drug dissolution of L-SMEDDS in comparison with pure drug
Thermodynamic stability studies
Physical stability of SMEDDS was essential to its performance, which can be affected by precipitation of the drug. In addition, the formulation having poor physical stability can affect the formulation performance and it also leads to phase separation. Hence thermodynamic stability studies were performed by performing heating cooling cycle, centrifuge test. It was observed that formulations (F3, F4, F11, F12, F13, F14, F17, F18 and F20) passed the heating cooling cycle and centrifuge test. SMEDDS which did not show any phase separation after tests, it was found that SMEDDS showed good stability without phase separation, creaming or cracking. Whereas, formulations (F16 and F22) were showing separation when exposed to elevated temperature and were unstable.
Visual observation and phase separation
The samples were observed for 48 hours and F3, F4, F11, F12, F13, F20 showed the highest stability without any phase separation and drug precipitation.
Robustness to dilution
From results of robustness to dilution study, it was observed that there was no sign of phase separation or drug precipitation in formulations F3, F4, F7, F11, F12, F13, F17, F18 and F20 and they were further evaluated for dispersibility test. [29]
Self-emulsification time
All the formulations rapidly emulsified within 2 minutes. Formulations F3, F4, F14 and F20 showed a rapid emulsification within 1 minute. These samples were further taken for the dispersibility test.
Dispersibility test for efficiency of self-emulsification
From the results of assessment of efficiency of self-emulsification study, it was found that formulation rapidly formed micro-emulsion within 1 min which was clear and slightly bluish in appearance. As per grade A formulations F4 and F14 rapidly formed slightly less clear emulsion which had a bluish white appearance as per grade B includes formulations F3, F8, F11, F12, F13, F17 and F20 as per grade C bright white emulsion or greyish white emulsion includes formulations F1, F5, F9, F16, F18 and F22, as per grade D formulations that exhibit poor or minimal emulsification with large oil droplets present on the surface includes formulations F2, F6, F7, F10, F15, F19 and F21. The results are given in Table 5. [30]
Drug content analysis
The percentage drug content of formulations was determined spectrophotometrically at wavelength of 218 nm. The drug content of various batches was in the range of 95.23% -99.09%. The F4 formulation showed highest drug content of 99.09%.
Drug dissolution
Int. J. Pharm. Sci. Drug Res. July-August, 2018, Vol 10, Issue 4 (233-245)
Table 3: Formulation of S-SMEDDS Formulation
Code
Drug (mg)
Solvent (mg)
Carrier Material (Q) (mg) MCC (mg)
Loading Factor(Lf)
Excipient Ratio (R) (Q/q)
Tablet Weight (mg) N-US2 Fujicalin Prosolv Aerosil (q)
SS1 30 30.29 120 - - 24 295.71 0.23 5 500
SS2 30 30.29 - 300 - 60 79.71 0.10 5 500
SS3 30 30.29 - - 320 64 55.71 0.094 5 500
SS4 30 30.29 120 - - 24 295.71 0.23 5 500
SS5 30 30.29 - 300 - 60 79.71 0.094 5 500
SS6 30 30.29 - - 320 64 55.71 0.23 5 500
Table 4: Solubility of oils, surfactants and co-surfactants
Oils Amount of drug (mg/ml)
Sunflower Oil Olive Oil Castor Oil Oleic Acid
2.186 3.43 3.76 35.78
Surfactants Amount of drug (mg/ml)
Tween 20 Tween 40 Tween 60 Tween 80 Span 20 Span 80
29.44 38.01 2.96 45.46 12.07 11.88
Co-surfactants Amount of drug (mg/ml)
Transcutol P PEG 600 Propylene Glycol
61.74 0.38 6.93
Table 5: Results of thermodynamic stability studies, robustness to dilution, dispersiblity test and emulsification time.
Formulation code Heating Cooling cycle Centrifugation Robustness Dispersiblity Test Emulsification Time Inference
F1 X X X C 76 secs Failed
F2 X X X D 104 secs Failed
F3 B 53 secs Passed
F4 A 47 secs Passed
F5 X X C 81 secs Failed
F6 X X X D 114 secs Failed
F7 X X C 88 secs Failed
F8 X X B 63 secs Failed
F9 X X X C 72 secs Failed
F10 X X X D 133 secs Failed
F11 B 69 secs Passed
F12 B 61 secs Passed
F13 B 73 secs Passed
F14 A 53 secs Passed
F15 X X X D 141 secs Failed
F16 X X C 93 secs Failed
F17 B 77 secs Passed
F18 B 79 secs Passed
F19 X X X D 122 secs Failed
F20 B 58 secs Passed
F21 X X X D 116 secs Failed
F22 X X X C 83 secs Failed
The drug dissolution studies were performed in 0.1N HCl media. Amount of drug released from the formulation has shown gradual increase in first 10 mins, 28.98% (F4) when compared to pure drug suspension (5.76%). Total drug release was observed in 1 hour is 99.89%, which is relatively higher when compared to the pure drug. Among all formulations F4 (oleic acid, Tween 80 and TranscutolP) in ratio 4:6, km value (4:1) has shown more cumulative % drug release. Thus, it infers that more amount of release is seen from the formulation when compared with pure drug as shown in Figure 5. [32]
Droplet size analysis and zeta potential
Zeta potential is used to measure surface charge of the particles which also determines the particle stability.
Zeta potential values are either positive or negative, to ensure and prevent particle-particle aggregation. [31]
The particle size and size distribution of the optimized formulation was measured using photon correlation spectroscopy. Size range of particles is expressed in terms of PDI. An ideal SMEDDS formulation should be widely distributed in less than 150 nm, PDI should be less than 0.5. The particle size and size distribution are most essential characteristics of SMEDDS which determine in-vivo distribution, biological fate, toxicity, targeting ability, release kinetics and stability. Mean particle size was found to be 115.9 nm and PI was 0.313. The size distribution is shown in Figure 6 and Figure 7
Int. J. Pharm. Sci. Drug Res. July-August, 2018, Vol 10, Issue 4 (233-245)
form. The formulation exhibited zeta potential value of -24.9 mV.
Transmission electron microscopy
The morphology and size of optimized formulation of SMEDDS (F4) was examined by TEM photographs at 6kx, 25kx, and 30kx. [26] Figure 8 shows that there are
homogenous molecular distribution of the drug in the globules. The shape of the globules is spherical and
outlines of micro emulsion droplets show a smooth surface. [11]
Conversion of L-SMEDDS to S-SMEDDS
The optimized liquid SMEDDS (F4, and F20) based on evaluation parameters and dissolution studies were converted into free-flowing powder by adsorption into solid carriers.
Fig. 6: Droplet size analysis of F4 L-SMEDDS formulation
Int. J. Pharm. Sci. Drug Res. July-August, 2018, Vol 10, Issue 4 (233-245)
Holding capacity of adsorbents
The amount of carrier to be used in the formulation was calculated by the holding capacity and the Lf factor.
The results showed that Neusilin US2 had a higher flowability when compared to Fujicalin and Prosolv.
Evaluation of flow properties for S-SMEDDS formulations
The particles with high absorption properties due to a porous surface should be used as carrier material. Increasing the moisture content of carrier materials may result in decreased powder flowability. The coating material is required to cover the surface, and further maintain the powder flowability. Accordingly, the coating material should be a very fine and highly adsorbent silica powder, thus Aerosil 200 was selected as a coat material. The S-SMEDDS were prepared with an excipients ratio of 5 (R=5). [11] All the formulations
were studied for their flow properties like angle of repose, bulk density, tapped density, hausner’s ratio and compressibility index. Angle of repose < 30° indicate free flow property while angles > 40° indicate poor flow. From the above formulations it was observed that SS1 formulation has least flow property (27.6 ± 0.19) having free flow property when compared to the other formulations. The bulk and tapped densities of S-SMEDDS were found to be 0.29 ± 0.16 g/cm3 to 0.36 ± 0.31 g/cm3 for bulk density and 0.31 ±
0.32 g/cm3 to 0.42 ± 0.36 g/cm3 for tapped density. The
powder has a good flowability when the hausner’s ratio is lower than 1.2 while if the ratio is more than 1.2 indicates bad flow. It was observed that SS1 has the hausner’s ratio of 1.06 ± 0.13 indicating good flow when compared to the other formulations. Compressibility index was found to be least for SS1 formulation (6.45 ± 0.33) indicating good flow properties when compared to other formulations. All the formulations were within the Indian Pharmacopoeia (IP) limits. [32]
These formulations were compressed into tablets using 11.9 mm punch. The tablets were evaluated for physio-chemical properties.
S-SMEDDS tablet evaluation
The prepared tablets were subjected to various parameters evaluation like weight variation, hardness, thickness, disintegration time etc. The tablets should have sufficient hardness to resist the breakage during handling and at the same time it should disintegrate after swallowing. The formulation SS6 had the highest hardness (2.6 ± 0.23 kg/cm3) and lowest was SS2 (2.2 ±
0.21 kg/cm3). Thickness of the tablets ranged from 3.44
± 0.66 mm to 3.63 ± 0.46 mm. Disintegration time ranged from 2-3 minutes. All the values were within the range. The average percentage deviation of all the tablets was found to be within the limit and hence all formulations passed the uniformity of weight as per the official requirements of Indian Pharmacopoeia. [33]
The S-SMEDDS tablets were also subjected to other evaluation parameters such as friability, drug content and content uniformity. The friability for all the formulations was within 1.12% which is acceptable for
disintegrating tablets, drug content was 94% to 97% and content uniformity is 94% to 98%. Thus, all formulations were as per official requirements of Indian Pharmacopoeia. [33]
Table 6: Stability study of optimized formulation (SS1) Parameters Time
0 (initial) 1st month 2nd month 3rd month
Appearance No change No change No change No change
Drug content
(%) 97.65 ± 0.65 97.32 ± 0.12 96.43 ± 0.39 96.01 ± 0.42
Hardness
(Kg/cm3) 2.5 ± 0.36 2.5 ± 0.23 2.4 ± 0.11 2.4 ± 0.19
Disintegration
time (mins) 2.63 ± 0.44 2.52 ± 0.11 2.48 ± 0.36 2.54 ± 0.28
Fig. 8: TEM photograph of F4 formulation (6kx)
Fig. 9: In-vitro drug dissolution of S-SMEDDS tablets
Int. J. Pharm. Sci. Drug Res. July-August, 2018, Vol 10, Issue 4 (233-245)
Fig. 11: XRD of pure drug
Fig. 12: XRD of SSI Formulation
Fig. 13: DSC of pure drug
Fig. 14: DSC of SS1 formulation
In-vitro dissolution studies
Dissolution studies were carried out with USP apparatus II (paddle type). All the formulations were subjected to in vitro dissolution studies in 900 ml of 0.1 N HCl. The tablets dissolution studies were done according to the procedure given in the experimental methodology. The S-SMEDDS formulations contain carrier materials Neusilin US2, Fujicalin and Prosolv and coating material. The drug release profile of SS1 S-SMEDDS formulation containing Neusulin US2 showed a better drug release (97%) within 20 mins when compared to the other formulations (Figure 9). [32]
Comparison of optimized S-SMEDDS with Pure drug and marketed drug
The drug release of the optimized S-SMEDDS formulation (SS1) was compared with the pure drug and marketed drug (Apiz 30 mg).
The comparative dissolution release of pure drug, optimized formulation (SS1) and marketed drug are shown in Figure 10. [33] The drug release of the pure
drug and marketed drug was 43.63% and 99.62% in 45 mins respectively. But, SS1 formulation showed 97% drug release within 20 mins. Thus in vitro drug dissolution studies indicated the importance of S-SMEDDS to enhance the solubility and dissolution rates. These results illustrated that the drug release from S-SMEDDS showed marginal variations with an increase in dissolution rate. However, SS1 showed higher dissolution rate when compared to the other S-SMEDDS formulations, hence it was selected as optimized formulation.
Crystallinity studies by XRD
The crystallinity of the optimized S-SMEDDDS (SS1) was studied by XRD. The change in degree of crystallinity was studied. The pure drug and optimized formulations were also analysed by XRD in same manner and peak intensity and presence of new peaks were noted. [34]
The X-ray diffraction pattern of Aripiprazole (Figure 11) [34] exhibited sharp, highly intense and less diffused
peaks indicating the crystalline nature of drug. The XRD of optimized formulation revealed reduction in peak intensity when compared with the XRD of the pure drug (Figure 12). The characteristic peaks identified in the drug XRD was not detected in the formulation. Decrease in the intensities and less number of peaks was probably due to the change in crystal habit or conversion to an amorphous form. Reduced crystalline properties when compared to pure drug could account for increased dissolution.
Thermal Analysis by DSC
The physical nature of the drug and the optimized formulation were studied by DSC analysis to evaluate the crystallinity of formulations. The melting point, peak onset and appearance of any peak were noted. DSC of pure drug showed a sharp peak at 140°C (Figure 13). [23] When compared to the optimized
Int. J. Pharm. Sci. Drug Res. July-August, 2018, Vol 10, Issue 4 (233-245)
(Figure 14). [23] This may be due to the change in the
crystalline structure of the drug.
Stability Study
According to the accelerated stability studies given in experimental methodology stability studies at 40°C ± 2°C/75% ± 2% RH for a period of three months was conducted (Table 6). [16] The optimized S-SMEDDS
formulations were subjected to various quality control parameters like appearance, drug content, hardness and disintegration time. All the results of optimized formulations were found to be compiled with official specifications. [35]
The present study was to improve the solubility of aripiprazole, an oral atypical anti-psychotic agent utilizing the approach of solid self-emulsifying drug delivery systems. It was investigated that this technique would improve the solubility of aripiprazole since it is a poorly soluble drug (BCS class IV). Based on the solubility studies of aripiprazole the solvents having maximum solubility include Oleic acid (35.78 mg/ml), Tween 80 (45.46 mg/ml) and Transcutol P (61.74 mg/ml) as the oil, surfactant and co-surfactant respectively. From the pseudo-ternary phase diagrams, the region of micro-emulsion was detected and all the evaluation parameters were done. Among all the formulations F4 (4:6) containing oleic acid, Tween 80 and Transcutol P and F20 containing oleic acid, Tween 80 and Transcutol P have shown better dissolution profile of 99.89% and 98.52% drug release respectively within 45 mins. The particle size and surface morphology of the optimized SMEDDS was evaluated by droplet size analysis, zeta potential and TEM analysis. TEM photographs of micro-emulsions formulations further confirmed the spherical shape of globules. The formulation was found to be widely distributed in less than 150 nm exhibited zeta potential value of -24.9 mV. S-SMEEDS were prepared by solid adsorption into carriers using Neusilin US2, Fujicalin and Prosolv SMCC 50. Among all the formulations SS1 showed better dissolution profile of 97.51% drug release within 20 mins. When compared with marketed drug SS1 showed a better dissolution rate. The optimized formulation of aripiprazole was characterized by X-ray diffraction, FTIR, and DSC studies, and no interaction was observed. XRD data revealed that the formulation showed reduced crystallinity when compared to pure drug. Stability studies indicate the formulations were stable. In conclusion it can be stated that the objective of the study was achieved by improving the solubility of aripiprazole using solid-self emulsifying drug delivery systems.
ACKNOWLEDGEMENTS
The authors are very thankful to Gangwal Chemicals Pvt Ltd., Mumbai, for providing gift samples of Neusilin US2 and Fujicalin.
REFERENCES
1. Degertekin B, Singh B, Bandopadhyay S, Kapil R, Singh R, Katare OP. Self-Emulsifying Drug Delivery Systems (SEDDS): Formulation Development, Characterization, and Applications – A Review. Therapeutic Drug Carrier Systems. 2008; 26(5):427–521.
2. Singh B, Beg S, Kaur R, Khurana R, Sandhu PS, Kaur R, Katare OP. Recent Advances in Self-Emulsifying Drug Delivery Systems (SEDDS) – A Review. Therapeutic Drug Carrier Systems. 2014; 31(2):121–185.
3. Reddy S, Katyayani T, Navatha A, Ramya G. Review on self micro emulsifying drug delivery systems. International Journal of Research in Pharmacy and Research. 2011; 2(3):82-392.
4. Patel JB, Patel MR. Self-micro emulsifying drug delivery systems - A Review. World Journal of Pharmacy and Pharmaceutical Sciences. 2016; 5(4):2215-2232.
5. Spernath A, Aserin A. Microemulsions as carriers for drugs and nutraceuticals. Adv Colloid Interface Sci. 2006; 128:47-64. 6. Thi TD, Van Speybroeck M, Barillaro V, Martens J, Annaert P, Augustijns P, Van Humbeeck J, Vermant J, Van den Mooter G. Formulate-ability of ten compounds with different physicochemical profiles in SMEDDS. Eur J Pharm Sci. 2009; 88(5): 479-488.
7. Wang L, Dong J, Chen J, Eastoe J, Li X. Design and optimization of a new self-nanoemulsifying drug delivery system. J Colloid Interface Sci. 2009; 330(2):443-448.
8. Gershanik T, Benita S. Self-dispersing lipid formulations for improving oral absorption of lipophilic drugs. Eur J Pharm Biopharm. 2000; 50(1):79-88.
9. Porter CJH, Trevaskis NL, Charman WN. Lipids and lipid-based formulations: optimizing the oral delivery of lipophilic drugs. Nat. Rev. Drug Discov. 2001; 6:231–248.
10. Pouton CW. Formulation of self-emulsifying drug delivery systems. Adv Drug Deliv Rev. 1997; 25(1):47-58
11. Pouton CW. Self-emulsifying drug delivery systems: Assessment of the efficiency of emulsification. Int J Pharm. 1985; 27(2-3):335-348.
12. Serajuddin AT, Sheen PC, Mufson D, Bernstein DF, Augustine MA. Effect of vehicle amphiphilicity on the dissolution and bioavailability of a poorly water-soluble drug from solid dispersions. J Pharm Sci. 1987; 77(5):414-417 13. Patil RV, Patil KK, Mahajan VR, Dhake AS. Self emulsifying
therapeutic- a review. Int J of Pharma. Bio Archives. 2012; 3(3): 481-486.
14. Gupta RN, Gupta R, Rathore GS. Enhancement of oral bioavailability of lipophilic drugs from self microemulsifying drug delivery system (SMEDDS). Int J of Drug Deve & Res. 2009; 1(1): 10-18.
15. Nazzal S, Smalyukh II, Lavrentovich OD, Khan MA. Preparation and in vitro characterization of a eutectic based semisolid self-nanoemulsified drug delivery system (SNEDDS) of ubiquinone: mechanism and progress of emulsion formation. Int J Pharm. 2002; 235(1-2):247-265. 16. Rang MJ, Miller CA. Spontaneous emulsification of oils
containing hydrocarbon, nonionic surfactant, and oleyl alcohol. J Colloid Interface Sci. 1999; 209(1): 179-192.
17. Krishnamurthy S, Bharath S, Madhavan V. Solubility enhancement of BCS class II antihypertensive drug using solid self emulsification technique. W J of Pharmacy and Pharma Sci. 2014; 3(2):2179-2192.
18. Prajapati BG, Patel MM. Conventional and alternative pharmaceutical methods to improve oral bioavailability of lipophilic drugs. Asian J. Pharm. 2007; 1:1–8.
19. Parmar B, Patel U, Bhimani B, Sanghavi K, Patel G, Daslaniya D. SMEDDS: A Dominant Dosage Form Which Improve Bioavailability. American Journal of Pharmtech Research. 2012; 2(4): 54-72.
20. Jannin V. Approaches for the development of solid and semi-solid lipid-based formulations. Adv Drug Deliv Rev. 2008; 60:734–746.
Int. J. Pharm. Sci. Drug Res. July-August, 2018, Vol 10, Issue 4 (233-245)
delivery systems. International Journal of Pharmacy and Pharmaceutical Sciences. 2013; 5(3):513-522.
22. Patel MJ, Patel SS, Patel NM, Patel MM. A self-micro emulsifying drug delivery systems (SMEDDS) – A Review. International Journal of Pharmaceutical Science and Research. 2010; 29-35.
23. Kyatanwar AU, Jadhav KR, Kadam VJ. Self micro-emulsifying drug delivery systems – A Review. Journal of pharmacy research. 2010; 3(1):17-21.
24. Monali Y, Shahikant D, Nilesh K. Development and Evaluation of Poorly Aqueous soluble drug Racecadotril by using Solid Self Emulsifying Drug Delivery Systems. International Research Journal of Phramacy.2014; 5(7):565-575.
25. Raval C, Joshi N, Patel J, Upadhyay UM. Enhanced oral bioavailability of Olmesartan by using novel solid self emulsifying drug delivery systems. International journal of advanced pharmaceutics. 2012; 2:82-92.
26. Saroj S, Baby DA, Sabitha M. Current trends in lipid based delivery systems and its applications in drug delivery. Asian Journal of Pharmaceutical and Clinical Research. 2012; 5(3): 4-9.
27. Meghani N, Suares D. Self micro-emulsifying drug delivery systems (SMEDDS): A promising tool to improve bioavailability. Journal of Pharmacy and Phytotherapeutics. 2013; 2(1): 17-21.
28. Ammar HO, El-Feky GS, Ali AMA. Enhancement of oral bioavailability of repaglinide by self-nanoemulsifying drug delivery systems. International journal of pharmacy and pharmaceutical sciences. 2014; 6: 603-606.
29. Czajkowska-Kos´nik A, Szekalska M, Amelian A, Szyman´ska E, Winnicka K. Development and Evaluation of Liquid and Solid Self-Emulsifying Drug Delivery Systems for Atorvastatin. Molecules. 2015; 20:21010–21022.
30. Wa H, Longa X, Yuana F, Pana CS, LiuaY, Stowellb Y, Xiaoling. Combined use of phospholipid complexes and self-emuslsifying microemulsions for improving the oral absorption of a BCS class IV compound, baicalin. Acta Pharmaceuticals Sinica. 2012; 217-226.
31. Puttachari S, Lalyane NA, Gupta S. Design and Evaluation of Self-Micro emulsifying Drug Delivery Systems of Acyclovir. International Journal of Pharmacy and Pharmaceutical Sciences. 2014; 6(4):677-681.
32. Narkhede RA, Gujar KN, Gambhire VM. Design and evaluation of self‑nanoemulsifying drug delivery systems for nebivolol hydrochloride. Asian Journal of Pharmaceutics. 2014; 200-209.
33. Nawale RB, Mehta BN. Glibenclamide loaded self-emulsifying drug delivery system: Development and Optimization. International journal of pharmacy and pharmaceutical sciences.2012; 5:325-330.
34. Raval C, Joshi N, Patel J, Upadhyay UM. Enhanced oral bioavailability of olmesartan by using novel solid emulsifying drug delivery systems. International Journal of Advanced Pharmaceutics. 2012; 2:82-92.
35. Rai S, Yasir M. Cinnarizine loaded lipid based system: preparation, optimization and in-vitro evaluation. IOSR Journal of Pharmacy. 2012; 2(5):47-56.
HOW TO CITE THIS ARTICLE: Chennuri A, Prasanthi D. Solubility Enhancement of Aripiprazole by Solid-Self