e-ISSN: 2278-067X, p-ISSN: 2278-800X, www.ijerd.com
Volume 13, Issue 12 (December 2017), PP.72-76
Soil Bulk Density As Related to Soil Texture, Moisture Content,
Ph, Electrical Conductivity, organic Carbon, Organic Matter
Content And Available Macro Nutrients of Pandoga Sub
Watershed, Una District of H.P (India)
Bindu Sharma
1,
Dr. Sujata bhattacharya
2Shoolini University, Post Box No. 9, Head Post Office, Solan (H.P) 173212, India Corresponding Author: Bindu Sharma1
ABSTRACT: Bulk density of a soil is a dynamic property as it varied with the soil conditions. It depends on
factors as compaction, consolidation and amount of the organic carbon content their texture constituent, and minerals. The main objective of this work was to investigate the dependence of bulk density on texture, organic matter content and available nutrients (macro nutrients) for soil of Pandoga sub watershed. The relationships between some physical and chemical properties of soil such as, clay content (C), silt content (Si), sand content (S), moisture content(MC), organic carbon(OC), organic matter content (OMC), total macro nutrient content with soil bulk density were studied for nine surface soil samples (0-15 cm) in watershed catchment area. Soil bulk density showed strong negative relationships with the clay whereas negative relationship with the silt, OC, OMC. Strong positive correlation was observed with the available macronutrients, sand whereas positive correlation with the MC, pH, EC.Index-Terms: bulk density, clay content, organic matter content, sand content, silt content
--- --- Date of Submission: 27 -11-2017 Date of acceptance: 16-12-2017 --- ---
I.
INTRODUCTION
The primary source of livelihood is the natural resources. In developing countries, the resource base has been deteriorating due to the rapid dwindling of forest resources (Asok and Sabha, 2014). Forest resources have been utilized for agricultural use, fuel, timber, construction materials and agricultural implements. Afforestation, overgrazing and cutting of trees had led to the loss of soil. Soil erosion by water is the greatest land degradation problem that removes organic matter and clay. Erosion reduces the thickness and the volume of soil available for water storage and root expansion for plants. Water erosion not only removes nutrients but might reduce soil chemical quality to retain added nutrients. Soil bulk density is a basic soil property influenced by the amount of organic matter in soils, their texture constituent, and minerals. The Bulk density also depends on factors as compaction, consolidation and amount of the organic carbon content. Soil organic matter plays a key role in nutrient cycling and can help improve soil structure. Organic carbon influences many soil characteristics like colour, nutrient holding capacity, nutrient turnover and stability, which in turn influence water relations, aeration and workability.
Knowledge of soil bulk density is essential for soil management and to provide information regarding soil compaction that might help in planning of modern farming techniques. Implementation of pandoga sub watershed in pandoga village of Una district of Himachal Pradesh helped to combat soil loss through various types of dams (check dams, percolation dams, crate wire dams etc.).Therefore present study was proposed to assess the effect of texture, organic matter content and total macro nutrient content on bulk density of soil in pandoga sub watershed
II.
MATERIALS AND METHODS
Study area
component of agricultural land use, whereas summer cultivation is marginal. Major crops of the area are wheat, maize.
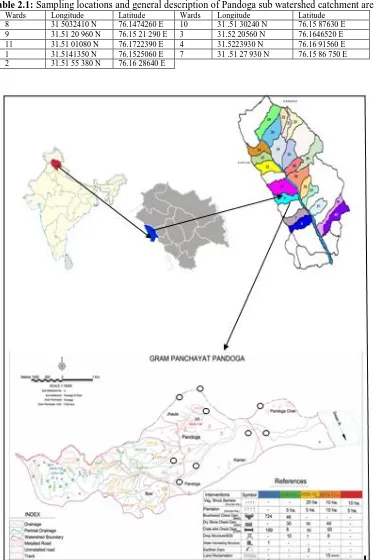
Table 2.1: Sampling locations and general description of Pandoga sub watershed catchment area
Wards Longitude Latitude Wards Longitude Latitude
8 31 5032410 N 76.1474260 E 10 31 .51 30240 N 76.15 87630 E
9 31.51 20 960 N 76.15 21 290 E 3 31.52 20560 N 76.1646520 E
11 31.51 01080 N 76.1722390 E 4 31.5223930 N 76.16 91560 E
1 31.5141350 N 76.1525060 E 7 31 .51 27 930 N 76.15 86 750 E
2 31.51 55 380 N 76.16 28640 E
Figure 2.1: Location Map A. Himachal Pradesh In India; B. Una Distt. In Himachal Pradesh; C. Swan River
Watershed Project Area; D. Pandoga Sub-Watershed
Sampling Site Selection, Soil Sampling and Analysis
from a depth of 0-20 cm. Then the collected sample was air dried, ground, sieved with 2 mm sieve, tagged, and stored for laboratory analysis.
Laboratory Analysis Of Soil
The particle size distribution (texture) of the soils was analyzed according to the procedures outlined by International pipette method (Piper, 1966). Soil bulk density was measured using the core method (Blacke, 1965).The measurement of soil pH and EC was conducted using pH and EC meter in the supernatant suspension of 1:2 soils to water ratio .Organic carbon of the soils was determined following the Rapid titration method (Walkley and Black, 1934) while percentage organic matter of the soils was calculated by multiplying the percent organic carbon value by 1.724. Available nitrogen, Available phosphorus and Available potassium were tested following Micro -Kjeidhal procedure of Chapmann and Pratt (1961), Olsen’s et al.(1954) , Flame photometerically (Piper,1966) respectively. The obtained results were analyzed statistically
.
III.
RESULTS AND DISCUSSION
Results revealed that maximum mean sand percentage (75%) was found in ward 10 and maximum mean silt was (23.33%) in ward 4 while maximum mean clay was observed (15.66%) in ward 9. (Table3.1). Adamu (1997) indicated that sandy textured soil are prone to erosion due to low silt and clay particles which are binding and creating stable structures to resist erosive factors such as wind and water. Dominance of sand particle over silt and clay in each ward of Pandoga sub watershed. According to Mortimore (1989), sand particles dominate in arid and semi-arid climate because these are formed by aeolian deposits blown across several thousands of kilometers. Maximum mean bulk density 1.54gm/cm3 was in ward 7. Miller and Donahue, 1995 stated that soil texture has a decisive role in bulk density as the aggregates of clayey soil possess lower density than a sandy soil where the particles lie closer. Maximum mean moisture content (17.58%) was in ward 7.Results show that maximum mean pH (7.60) was in ward 9. Soil pH raised by 2-3 units in the immediate vicinity of granule of urea (Tisdale et al., 1985). The results of electrical conductivity showed that maximum mean electrical conductivity was (.38 milli mohs/cm) in ward 7. It was evident that during maximum mean Organic carbon (0.830%) in ward 8 while maximum organic matter carbon (1.42%) was in ward 8. It may because of high use of local fertilizers like animal manure and dung. Sharma and Kumar (2003) stated variation in bulk density to variation in organic matter. SOM identifies the humus content in the soil as a result from decomposition of crop and microbial residues. It is evident that maximum Available nitrogen, maximum Available phosphorus and maximumAvailable potassium was (359.12Kg/ha) ;( 49.28kg/ha) and (537.33kg/ha) respectively was in ward 7.
Table 3.1: Variation in soil texture, bulk density, moisture content and pH of Pandoga sub watershed catchment area at nine wards). Values are ± S. E. n=3.
Wards
Sand % Silt % Clay% Bulk density Moisture content pH
8 66.33 ± .881 22.66 ±.66 11±1 1.37 ± 0.014 17.15±0.50 6.47±0.51
9 64.3± 2.33 20±1.15 15.66±2.18 1.38±0.020 17.23±0.14 7.60±0.09
11 72± 1.15 20±1.15 8.66±.66 1.50±0.015 17.48±0.77 7.11±0.25
1 68.33±.881 22±.66 9 ±1 1.42±0.011 13.00±1.53 7.02±1.35
2 69±2.08 22±1.15 9±2.64 1.42±0.17 12.73±0.16 7.18±0.82
10 75±.577 20±1.15 5±1.73 1,49±0.021 13.74±0.16 7.49±0.06
3 70.66±.666 22±1.15 7.33±1.33 1.47±0.017 17.02±0.15 7.36±0.33
4 70±1.555 23.33±.66 6.66±1.76 1.50±0.015 17.25±0.38 7.29±0.12
7 72±1.453 17.33±2.84 7.66±1.85 1.54±0.024 17.58±0.82 6.99±0.12
Table3.2: Variation in soil EC, OC, OMC, Av. N, Av. P, Av. K of Pandoga sub watershed catchment area at nine wards. Values are ± S. E. n=3.
Wards EC OC OMC Av. N Av. P Av. K
8 0.173±0.032 0.830±.126 1.42±0.21 117.66 ± 6.01 43.30±5.38 130.66 ±13.46
9 0.256±0.061 0.286±.286 0.49± 0.04 120.20 ±2.94 26.88±2.58 190.33±17.13
11 0.193±0.008 0.306±.031 0.52±0.05 129.56 ±4.22 28.37±1.49 357.40±34.84
1 0.176±0.012 0.256±0.017 0.44±0.03 128.65 ±15.35 27.59±2.59 126.93±9.87
2 0.186±0.0145 0.310 ±0.036 0.53±0.06 112.85 ±6.28 31.36±2.58 100.80±6.46
10 0.170±0.011 0.413±0.021 0.71±0.037 144.42 ±6.75 38.08±4.66 231.46±39.50
3 0.093±0.003 0.346±0.020 0.59±0.03 275.96 ±7.24 35.84±2.58 149.33±9.87
4 0.150±0.023 0.430±0.075 0.7±0.12 204.88 ±11.06 37.44±1.44 261.33±16.27
7 0.386±0.077 0.506±0.017 0.89±0.03 359.12 ±36.50 49.28±3.87 537.33±29.58
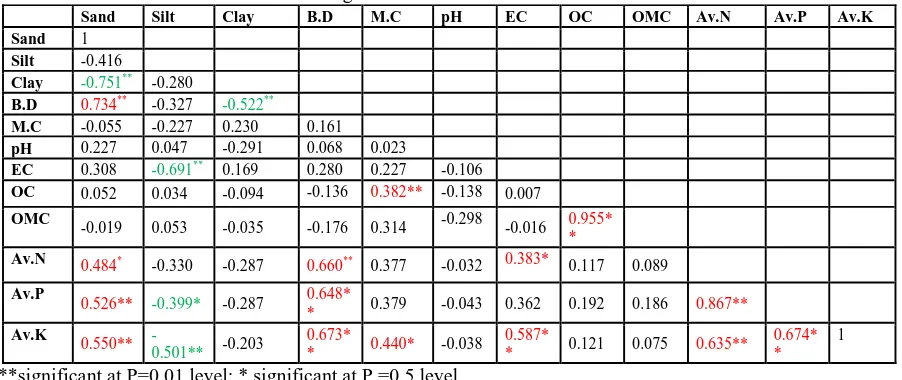
Pearson correlation of bulk density with the different physico chemical parameters of soil
The Pearson correlation was used to measure the relationship between two physico-chemical parameters. The degrees of correlation(r) between two soil physico chemical variables are presented in (Table3.3)
Pearson correlation between soil texture content and bulk density
High degree of positive correlation was found between sand and bulk density(r =.734**) while significant negative correlation was observed between clay and bulk density (r =-0.522**) and silt content (r=-0.327) of soil samples. Results indicated that sand had more effect on bulk density than the other texture content. Same results were observed in the study of (R. Chaudhary et al., 2013). He revealed the impact of texture on bulk density was due to organic carbon. Whereas Dinesh kumar et al .,2013 stated soil texture specific test required to determine the organic matter level to judge the bulk density to get off the problem of compaction.
Relationship between bulk density with the moisture content, pH and electrical conductivity of soil samples
Results revealed that bulk density had positive correlation with the electrical conductivity(r=0.161), pH (r =.068) and electrical conductivity (r =.280) in (Table3.3) but not significant. Negative non significant correlation was observed in the study (R. Chaudhary et al., 2013). It indicated that bulk density is independent whether the soil is acidic or alkaline in nature. However J. shaffer (2005) observed highest correlation between pH and bulk density but did not give any reason for it.
Relationship between bulk density and organic matter or organic carbon of soil samples
Results revealed that bulk density had a negative correlation with the organic carbon (r = -.136) and organic matter (r = -.176) .This indicates that organic matter increases when bulk density decreases as in (Table 3.3) which is required for proper growth of the plant. Strong negative correlation was observed by R. Chaudhary et al., 2013; however E. Sakin, 2011; K. Morisada et al., 2004; J. Leifeld et al., 2005 observed the strongest positive correlation between bulk density and organic matter.
Relationship between bulk density and macro nutrients (Available Nitrogen, Available potassium and Available phosphorus)
Results revealed that bulk density had a strong positive correlation with the Available Nitrogen (r = .660**), Available phosphorus (r =0.648**) and Available potassium(r =0.673**) show significant positive correlation. R. Laiho et al., 2004 indicated that total variance of Available potassium decreases with increase in depth i.e., bulk density.
Table 3.3: Pearson correlation matrix for Physico chemical parameters of soil at Pandoga sub watershed catchment area
**significant at P=0.01 level; * significant at P =0.5 level
B.D=Bulk Density, M.C=Moisture content, EC=electrical Conductivity, OC=Organic Carbon, OMC=Organic Carbon Matter, Av. N=available nitrogen, Av. P = available phosphorus, Av. K=available potassium.
Sand Silt Clay B.D M.C pH EC OC OMC Av.N Av.P Av.K
Sand 1
Silt -0.416
Clay -0.751** -0.280
B.D 0.734** -0.327 -0.522**
M.C -0.055 -0.227 0.230 0.161
pH 0.227 0.047 -0.291 0.068 0.023
EC 0.308 -0.691** 0.169 0.280 0.227 -0.106
OC 0.052 0.034 -0.094 -0.136 0.382** -0.138 0.007
OMC
-0.019 0.053 -0.035 -0.176 0.314 -0.298 -0.016 0.955* *
Av.N 0.484* -0.330 -0.287 0.660** 0.377 -0.032 0.383* 0.117 0.089
Av.P
0.526** -0.399* -0.287 0.648*
* 0.379 -0.043 0.362 0.192 0.186 0.867**
Av.K
0.550**
-0.501** -0.203
0.673*
* 0.440* -0.038
0.587*
* 0.121 0.075 0.635**
0.674* *
IV.
CONCLUSION
Soil Bulk Density is an important parameter in geochemical studies since it throws light on physico chemical parameters aspects such as soil texture, soil organic matter content and macro nutrients. The results of the present study shows that all wards had lower bulk densities (i.e. < 1.5), indicating the healthy condition of soil ideal for growth of floral. The texture of soil affects its ability to hold nutrients. Effect of sand content on soil bulk density was found to be higher than that of the other soil properties .Sand particles are the largest and allow water to move through the soil more quickly. Bulk density was independent on whether soil is acidic or alkaline. There was reverse correlation between organic matter and bulk density of soil. The method of correlation has been found to a significant approach to get an idea of quality of the soil. Macro nutrients show significant positive correlation with the bulk density. Watershed management had spatial impact upon the quality of soil in different wards which revealed that it may destroy the quality of soil in future. Therefore it was essential to assess the quality of soil in future to upgrade or to sustain the quality of soil.
REFERENCES
[1]. Adamu, GK. An assessment of erodobility of selected soils under different land management systems at Bayero University, Kano New campus: unpublished PGD Project Soil evaluation: BUK. 1997. [2]. Dinesh Kumar, M.L. Bansal and V.K. Phogat, “Compactability in Relation to Texture and Organic
Matter Content of Alluvial Soils,” Indian J. Agric. Res., 2009, Vol.43 (3), pp. 180-186.
[3]. E. Saki n, A. Deliboran and E. Tutar, “Bulk density of Harran plain soils in relation to other soil properties,” African Journal of Agricultural Research, 2011, Vol. 6(7), pp. 1750- 1757.
[4]. J. Leifeld, S. Bassin, and J. Fuhrer, “Carbon stocks in Swiss agricultural soils predicted by land-use, soil characteristics, and altitude, ” Agr. Ecosyst. Environ. Vol. 105, 2005, pp. 255–266.
[5]. Kjeldahl JGCT. Neue methode zur bestimmung des stickstoffs in organischen körpern. Fresenius' Journal of Analytical Chemistry. 1883; 22(1): 366-382.
[6]. K. Morisada, K. Ono and H. Kanomata, “Organic carbon stock in forest soils in Japan,” Geoderma, Vol.119, 2004, pp. 21-32.
[7]. Miller, R.W. and R.L. Donahue. Soils in our environment, 7th Ed. Prentice Hall Inc., Englewood Cliffs, New Jersey. 1995, 649.
[8]. Mortimore M. Adapting to drought: farmers, famine and desertification in West Africa: Cambridge: University Press.1989.
[9]. Olsen SR, CV Cole, Watanbe FS, Dean LA. Estimation of available phosphorus in the soil by extraction with sodium bicarbonate. U.S. Department of Agriculture Circular. 1954, 939.
[10]. Piper C.S. Soil and Plant Analysis. Hans Publishers Bombay. 1966, 135-136.
[11]. R. Laiho, T. Penttilä, and J. Laine, “Variation in soil nutrient concentrations and bulk density within peatland forest sites,” Silva Fennica, Vol. 38(1), 2004, pp. 29-41.
[12]. Sharma, V.K. and Anil Kumar, 2003. Characterization and classification of the soil of upper Maul Khad catchment in wet temperate zone of Himachal Pradesh. Agropedology, 13: 39-4.
[13]. Tisdale ST, Nelson WL, Beaton JD. Soil fertility and fertilizers. 4th ed. Macmillan publishing company, New York. 1985,499.
[14]. V. Smitha Asok and V. Sobha.Analysis of Variation of Soil Bulk Densities with Respect toDifferent Vegetation Classes, in a Tropical Rain Forest – A Study in Shendurney Wildlife Sanctuary, S. Kerala, India. Global Journal of Environmental Research 8 (1): 17-20, 2014.
[15]. Walkley A and Black IA. An examination of the Degtjareff method for Determining soil organic matter, and proposed a modification of the chromic acid titration method. Soil Science. 1934, 37:29-38.