SENSE OF WORTHINESS AMONG THE CHILDREN WITH SPECIFIC LEARNING DISABILITY
8
0
0
Full text
(2) Senthil Kumar A P., Int. J. Pharm. & H. Care Res., Vol.–03 (01) 2015 [12 - 19]. In the present scenario of education system 12-13 per cent of the children with specific learning disability are often left alone without any intervention provisions. Failure to meet out age appropriate academic standard has created low selfworthiness among these children. Prolonged state of feeling low self-worthiness will be converted into behavior problems. Finally, it will be reflected as academic backwardness and leads to more of low self-worthiness among the specific learning disability children.3. 13. research gap, the present study was selected, to know about the low self worthiness and difficulties of the specific learning disability children in school set up in Coimbatore district. The objectives of the present study was to study the socio-economic conditions of the specific learning disability children; to know the academic difficulties faced by the specific learning disability children and to assess self worthiness level of the specific learning disability children.. Methods Self-esteem is also part of sense of self-worth of the individual. It focuses the personality and psycho-social perspective on academic environment of specific learning disability children. It increases the gap between the academic achievement and academic difficulties. The academic difficulties and low self worthiness of specific learning disability children are due to dyslexic, dysgraphic or dyscalculia sometimes comorbid of above all. The specific learning disability children low self worthiness and difficulties are seen as a lazy child and are given punishment, isolated from other children and are forced to dropout from school. The main reason behind this due to lack of awareness about the specific learning disability among the parents and teachers. The children become victimized and these children are mostly deprived of basic rights to get education in academic accommodations with activity based learning and learning disability supportive systems. Lack of awareness about the specific learning disability is prevalent among the teachers, parents and students. Fear of situation, repeated academic failure, day dreaming, gap existing between the existing efficiency and their academic performance, low self image, demands from the parents, self-concept, and locus of control, loneliness, and depression and mood states further intensify the problem. Poor understanding on the psycho-social based approach, especially the developing countries like India, the specific learning disability children academic accommodation was ignored by their own parents (Margalit & Shulman, 1998).4. Objectives of the study To study the socio-demographic profile of the children with Specific Learning Disabilities. To assess the psycho-social problems of the children with specific learning disabilities. To examine the influence of the sociodemographic variables on psycho social problems of the children with specific learning disabilities.. Most of the studies related to low self-esteem and difficulties of learning among such children are more only in western countries. In Tamil Nadu and India very few studies have been reported in the area of specific learning disability. To fill the. Study Design A explanatory research design was used. Here the cause and effects of the respondents was explained.. Operational Definitions Specific Learning Disability It is a disability in one more of the basic psychological process involved in understanding or in using, language spoken or written, which may manifest itself in imperfect in listen, think, speak, read, write, and spell or mathematical calculation . It includes perceptual disability, brain injury, minimal brain dysfunction, dyslexia and developmental aphasia. Low self-worthiness Self-worthiness is also known as the evaluative dimension of the self that includes feelings of own, prides and discouragement. One's self-esteem is also closely associated with self-worthiness. Hypothesis Better the socio-demographic profile, lesser would be the low self-worthiness faced by the students with specific learning disabilities. Higher the low self worthiness experienced by the students with specific learning disabilities, lesser would be the academic achievements. www.ijphr.com.
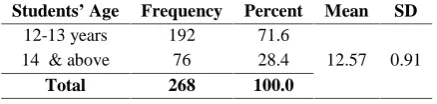
(3) 14. Senthil Kumar A P., Int. J. Pharm. & H. Care Res., Vol.–03 (01) 2015 [12 - 19]. Study area and Population The study was conducted in between 2010-2011 in Coimbatore District, Tamil Nadu, India. The state is located in south part of India. The study. participants were Children with Specific Learning Disability who were studying in 7th std and 8th std under SSA schemes (Serva Sikhsha Abhyian).. Table No. 01: Sample Size and Sample Technique S.No 1 2 3 4 5 6. Name of the selected schools Sulur boys higher secondary school CSI School Sulur girls higher secondary school Panchayat union middle school (south) Panchayat union middle school (north). No. of 7th and 8th standard students. No. of 7th and 8th standard identified students. % of SLD population. No. of sections. 398. 59. 14.8. 6. 308. 78. 25.3. 6. 316. 31. 9.81. 4. 355. 64. 20. 8. 179. 36. 20. 8. Total. 1556. 268. 18 (Average). 32. Sample size s was 268 Children with Specific Learning Disability those who were already identified by the Tamil Nadu Government Serva Sikhsha Abhiyan Schemes(SSA) in sulur Block, Coimbatore District. Multi-stage stratified disproportionate random Sampling Technique was adopted to conduct the study. In Tamil Nadu totally 31 districts were exist. Among 31 districts 49,919 Children with Specific Learning Disabilities were found as per 2010-2011 censuses. Coimbatore District was selected based random tippet method by using random table. In Coimbatore 19 Blocks were exist. Sulur Block was selected again on the same random tippet method. In Sulur Block 10 schools are functioning under the direct guidance of SSA Schemes(Serva Sikhsha Abhiyan) to provide service to the Children with Specific Learning Disabilities. Five schools out of 10 schools were selected randomly. Furthermore, 268 samples were picked up out 1556 samples from five schools based on random sampling procedure. Later the researcher identified that 268 picked up samples were from the 7th std and 8th std among five selected schools.. Data Collection Rosenberg self-esteem measurement scale was administered among the selected respondents to know their self-worthiness. This is a 10-item scale developed by Rosenberg in the year 1965 that captures positive or negative attitude towards a unidimensional self. Each subject rated on each item on a 2 point scale. This scale ranges from low to high. Higher scores indicate a more positive sense of self. Higher self-esteem expresses the feeling that one is “good enough”. The individual feels that he is a person of worth, he respects himself for what he is, but he does not stand in awe of himself or expect others to stand in awe of him. The 10item self-esteem scale is a widely used measure with strong reliability with the internal consistency ranging from 0.77 from 0.88. The researcher constructed the reliability test by using split of method that yields 0.82 to 0.85.5 Data processing and analysis Collected data were checked for completeness and entered into SPSS version 16 statistical package for analysis. Incidence of self-worthiness among the Children with Specific Learning Disability was calculated.. Results Socio-demographic variables of the study subjects Table No. 02: Distribution of the Respondents by Their Age Students’ Age 12-13 years 14 & above Total. Frequency 192 76 268. Percent 71.6 28.4 100.0. www.ijphr.com. Mean. SD. 12.57. 0.91.
(4) Senthil Kumar A P., Int. J. Pharm. & H. Care Res., Vol.–03 (01) 2015 [12 - 19]. The table no. 02 implies that majority (71.6%) of the respondents belonged to the age group of 12-13 years, more than one fourth (28.4 %) of the. 15. respondents belonged to the age group of 14 years and above. The mean of the age of the respondents was 12.57 and standard deviation was 0.91.. Table No. 03: Distribution of the Respondents by Their Education Status Education standard 7th Std 8th Std Total. Frequency 119 149 268. Percent 44.4 55.6 100.0. Mean. SD. 7.56. 0.50. percent) was in 8th standard, and the remaining 44.4 percent of them were in 7th standard.. The above table no. 03 shows the educational background of the respondents. Majority (55.6. Table No. 04: Distribution of the Respondents by their Gender Gender Male Female Total. Frequency 224 44 268. The table no. 04 indicates that majority of the respondents (83.6 percent) were males, and the. Percent 83.6 16.4 100.0. remaining 16.4 percent of the respondents were females.. Table No. 05: Distribution of the Respondent’s Father’s Education Status Father’s Education Illiterate Primary Education High School Collegiate Education No Father Total. Frequency 32 139 36 31 30 268. The above table no. 05 shows that more than half of the (51.9 percent) respondents’ fathers had completed primary education; 13.4 percent had. Percent 11.9 51.9 13.4 11.6 11.2 100.0. Mean. SD. 19.60. 28.62. high school education; 11.6 percent had collegiate education and 11.9 percent were illiterates.. Table No. 06: Distribution of the Respondent’s Mother’s Education Status Mother’s Education Illiterate Primary High School Total. Frequency 59 148 61 268. The table no. 06 indicates that more than half (55.2 percent) of the respondents’ mothers had primary education; 22.8 percent of the respondents mothers had high school education, and the rest of them (22 percent) were illiterates. It was inferred that the. Percent 22.0 55.2 22.8 100.0. Mean. SD. 9.46. 5.18. education level of the respondents’ mothers was up to primary school. The mean education status of the respondents’ mothers was 9.46 and standard deviation was 5.186.. Table No. 07: Distribution of the Respondent’s Father’s Occupation Father’s Occupation Coolies Self Employment Skilled Employees No Father Total. Frequency 166 30 42 30 268. www.ijphr.com. Percent 61.9 11.2 15.7 11.2 100.0.
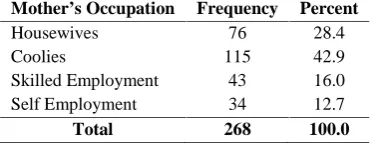
(5) 16. Senthil Kumar A P., Int. J. Pharm. & H. Care Res., Vol.–03 (01) 2015 [12 - 19]. The table no. 07 shows that more than three-fifth (61.9 percent) of the respondents’ fathers were coolies; 15.7 percent were skilled labourers like. weavers, plumbers and electricians, etc. 11.2 percent of the respondents’ fathers were self employed owing petty shops, hotels, call taxies etc.. Table No. 08: Distribution of the Respondent’s Mother’s Occupation Mother’s Occupation Housewives Coolies Skilled Employment Self Employment Total. Table no. 08 clearly shows that more than two fifth (42.9 percent) of the respondents’ mothers had employment as coolies in textile mills; 28.4 percent of the respondents’ mothers were housewives; 16.0 percent of the respondents’ mothers were skilled. Frequency 76 115 43 34 268. Percent 28.4 42.9 16.0 12.7 100.0. employees and the remaining 12.7 percent of the mothers had self-employment through self-help groups like mobile hotels, running canteens, and pickles making, etc.. Table No. 09: Distribution of the Respondents Family Income Family Income Low (upto Rs 5000) Medium (Rs 5001 to 9000) High (above Rs 9001) Total. Frequency 100 126 42 268. The Table no. 09 shows that nearly half of the respondents (47.0 percent) were in medium income group; 37.3 percent of the respondents’ families were in low income group; and the remaining 15.7 percent of them were in high income group. The. Percent 37.3 47.0 15.7 100.0. Mean. SD. 6340. 2.691. mean monthly family income was `6340 and standard deviation was 2.69. Out of 268 respondents, 42 respondents were coming under income of `9001and above.. Table No. 10: Factor Analysis : Self-esteem of the Respondents S. No. 1 2 3 4 5 6 7 8 9 10. Items on Self-esteem Check List I am not happy about the good relationship I have with my parents I am not sure that others give me much importance I do not expect others to respect me as much as I respect them I am not proud of my family I have no mental ability to pass the examinations easily I have no self-confidence I am not happy about my conduct and behaviour I can not maintain my concentration always With my abilities and skills I am not sure I can achieve more I hesitate to put forward my thoughts and ideas in any group. The respondents were asked to respond to the check list keeping in mind their self esteem. The above table found that all (100 percent) of them had not maintained good relationship with their parents; majority (97.8 percent) of them felt that others were not giving importance to them, and majority (91 Percent) of the respondents did not expect others to respect them. The study revealed that majority (86.2 percent) of them was not proud of their family. The item analysis revealed that majority (85.1 percent) of them did not have the mental ability/skills to pass the examination easily.. Yes 268 (100) 262 (97.8) 244 (91.0) 231 (86.2) 228 (85.1) 223 (83.2) 165 (61.6) 54 (20.1) 199 (74.3) 116 (43.3). No 6 (2.2) 24 (9.0) 37 (13.8) 40 (14.9) 45 (16.8) 103 (38.4) 214 (79.9) 69 (25.7) 152 (56.7). More than one fourth (83.2 percent) of them were not having self-confidence on their performance, majority (61.6 percent) of the respondents were not happy about their conduct and behavior, and 79.9 percent of them were not able to maintain their concentration on studies. Majority (74.3 percent) of the respondents were doubtful about their abilities and skills to achieve more in academic area. More than half (56.7 percent) of them hesitate to put forward their thoughts and ideas in any group. In general, majority of the respondents, self-esteem was poor.. www.ijphr.com.
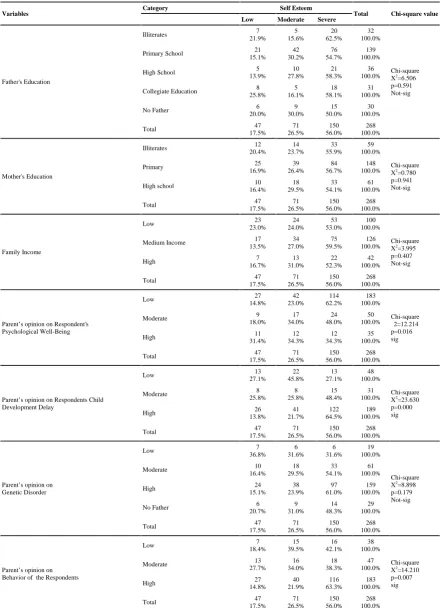
(6) 17. Senthil Kumar A P., Int. J. Pharm. & H. Care Res., Vol.–03 (01) 2015 [12 - 19]. Table No. 11: Summary of Self-esteem of the Respondents Variable. Mean. Median. Self-esteem score total 7.41 8.0 The respondents score ranged from 0-10 on the self-esteem test with a mean of 7.41 and standard deviation of 8.00. This indicates that the self-esteem check list of the respondents was. Mode. S.D. Range (max-min). 9 2.528 9(0-10) fairly low on the self-esteem. Lower the score, the lower Selfesteem.. Table No. 12: Socio-demographic Variables Vs Respondents Self Esteem Variables. Category. Self Esteem Low. 5 15.6%. 20 62.5%. 32 100.0%. Primary School. 21 15.1%. 42 30.2%. 76 54.7%. 139 100.0%. High School. 5 13.9%. 10 27.8%. 21 58.3%. 36 100.0%. Collegiate Education. 8 25.8%. 5 16.1%. 18 58.1%. 31 100.0%. No Father. 6 20.0%. 9 30.0%. 15 50.0%. 30 100.0%. Total. 47 17.5%. 71 26.5%. 150 56.0%. 268 100.0%. Illiterates. 12 20.4%. 14 23.7%. 33 55.9%. 59 100.0%. Primary. 25 16.9%. 39 26.4%. 84 56.7%. 148 100.0%. High school. 10 16.4%. 18 29.5%. 33 54.1%. 61 100.0%. Total. 47 17.5%. 71 26.5%. 150 56.0%. 268 100.0%. Low. 23 23.0%. 24 24.0%. 53 53.0%. 100 100.0%. Medium Income. 17 13.5%. 34 27.0%. 75 59.5%. 126 100.0%. High. 7 16.7%. 13 31.0%. 22 52.3%. 42 100.0%. Total. 47 17.5%. 71 26.5%. 150 56.0%. 268 100.0%. Low. 27 14.8%. 42 23.0%. 114 62.2%. 183 100.0%. Moderate. 9 18.0%. 17 34.0%. 24 48.0%. 50 100.0%. High. 11 31.4%. 12 34.3%. 12 34.3%. 35 100.0%. Total. 47 17.5%. 71 26.5%. 150 56.0%. 268 100.0%. Low. 13 27.1%. 22 45.8%. 13 27.1%. 48 100.0%. Moderate. 8 25.8%. 8 25.8%. 15 48.4%. 31 100.0%. High. 26 13.8%. 41 21.7%. 122 64.5%. 189 100.0%. Total. 47 17.5%. 71 26.5%. 150 56.0%. 268 100.0%. Low. 7 36.8%. 6 31.6%. 6 31.6%. 19 100.0%. Moderate. 10 16.4%. 18 29.5%. 33 54.1%. 61 100.0%. High. 24 15.1%. 38 23.9%. 97 61.0%. 159 100.0%. No Father. 6 20.7%. 9 31.0%. 14 48.3%. 29 100.0%. Total. 47 17.5%. 71 26.5%. 150 56.0%. 268 100.0%. Low. 7 18.4%. 15 39.5%. 16 42.1%. 38 100.0%. Moderate. 13 27.7%. 16 34.0%. 18 38.3%. 47 100.0%. High. 27 14.8%. 40 21.9%. 116 63.3%. 183 100.0%. Total. 47 17.5%. 71 26.5%. 150 56.0%. 268 100.0%. Family Income. Parent’s opinion on Genetic Disorder. Parent’s opinion on Behavior of the Respondents. Total. 7 21.9%. Mother's Education. Parent’s opinion on Respondents Child Development Delay. Severe. Illiterates. Father's Education. Parent’s opinion on Respondent's Psychological Well-Being. Moderate. www.ijphr.com. Chi-square value. Chi-square X2=6.506 p=0.591 Not-sig. Chi-square X2=0.780 p=0.941 Not-sig. Chi-square X2=3.995 p=0.407 Not-sig. Chi-square χ2=12.214 p=0.016 sig. Chi-square X2=23.630 p=0.000 sig. Chi-square X2=8.898 p=0.179 Not-sig. Chi-square X2=14.210 p=0.007 sig.
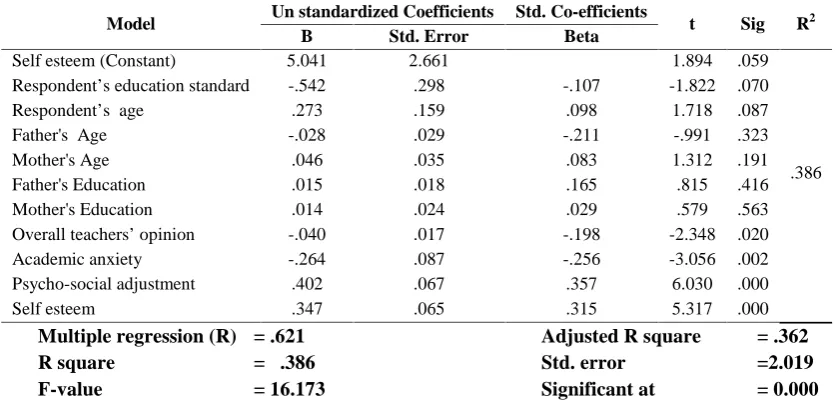
(7) 18. Senthil Kumar A P., Int. J. Pharm. & H. Care Res., Vol.–03 (01) 2015 [12 - 19]. The table no. 12 shows the association between respondents’ self-esteem and socio-demographic profiles of the respondents. Chi-square test indicated that there was significant association between self esteem of the respondents and parents’ opinion on psychological wellbeing of the respondents (X2=12.214, p=0.016), association between self-esteem of the respondents and parents’ opinion on child developmental delay. (X2=23.630, p=0.000) and also found association between self-esteem of the respondents and parents’ opinion on the behaviour of the respondents (X2=14.210, p=0.007). There was no association between family profiles on father’s education, mother’s education, family income, parents’ opinion on genetic disorder and selfesteem of the respondents.. Regression analysis Table No. 13: Predictors for the Dependent Variable on Self-Esteem Model Self esteem (Constant) Respondent’s education standard Respondent’s age Father's Age Mother's Age Father's Education Mother's Education Overall teachers’ opinion Academic anxiety Psycho-social adjustment Self esteem. Un standardized Coefficients B Std. Error 5.041 2.661 -.542 .298 .273 .159 -.028 .029 .046 .035 .015 .018 .014 .024 -.040 .017 -.264 .087 .402 .067 .347 .065. Multiple regression (R) = .621 R square = .386 F-value = 16.173. Std. Co-efficients Beta -.107 .098 -.211 .083 .165 .029 -.198 -.256 .357 .315. t. Sig. 1.894 -1.822 1.718 -.991 1.312 .815 .579 -2.348 -3.056 6.030 5.317. .059 .070 .087 .323 .191 .416 .563 .020 .002 .000 .000. Adjusted R square Std. error Significant at. Multiple Regression Analysis was carried out to determine which of the predictor variables such as respondents’ age, education standard, father’s age, mother’s age, father’s education, mother’s education, overall teachers’ opinion, academic achievement, academic anxiety and psycho-social adjustment. From the Table 69, it could be seen that the R2 _ value was found to be 0.386, which means 38.6 % of total variation in the dependent variable was explained by all the independent variables. Further, the obtained F-value of 16.17 was found to be significant. Hypothesis testing and interpretations First hypothesis was that ‘better the sociodemographic profile, lesser would be the psychosocial problems faced by the Students with Specific Learning disabilities’. Fathers’ education (X2=6.595; & p=0.581), mothers’ education (X2=0.861; & p=0.930), family income (X2=7.187; & p=0.126). Thus, the current hypothesization was not supported by the chi-square analysis for association between socio-demographic variables and psychosocial problems.. R2. .386. = .362 =2.019 = 0.000. Second hypothesis was that ‘higher the psychosocial problems experienced by the Students with Specific Learning disabilities, lesser would be the academic achievements’. In order to test this hypothesis, total scores on psychosocial problems was correlated to academic achievement using Pearson’s correlation. The result reveals that there is a significant positive correlation between psychosocial problems and academic anxiety (r = .476; & p<.001). The result indicates that when psychosocial problems increase, academic anxiety of children with special learning disability also increase, therefore, alternate hypothesis is accepted.. Discussion In the present study respondents’ score ranged from 0-10 on self-esteem scale with a mean of 7.41 and a standard deviation of 2.528. The current study shows that a larger number of them scored between 0-3. Lower the score indicate lower self-esteem. The result of the present study is concordance with the study of whitely and Jessica Lynn McKenna (2007).6 They reported that poor social skills,. www.ijphr.com.
(8) Senthil Kumar A P., Int. J. Pharm. & H. Care Res., Vol.–03 (01) 2015 [12 - 19]. interpersonal skills and their self-concept made them to have poor self-image.. 2.. There was no mean significant difference between socio-demographic items like age, education, family type, family income and religion showed no significant difference in its means on the psychosocial problems. The result of the study is confirmed with the earlier studies of Ramankutty and Krishnan (2003). 7 They observed that specific learning disability children were not influenced by the socio-cultural environment. Multiple regression shows that the independent variables such as father’s age, mother’s age, father’s education, mother’s education, father’s occupation, mother’s occupation, religion, caste, marriage type , family type, father’s drinking habits, overall teachers’ opinion on respondent’s academic performance and academic anxiety, selfesteem and academic achievement account for 40.2 % variance in the dependent variable adjustmental problems (R square=0.402). From the regression analysis it is clear that academic achievement, selfesteem and anxiety are predicting each other. The results of the present study concur with the study of Bevington et al. (1991).8 They studied the association between the academic achievement and adjustmental difficulties like behaviour and emotional difficulties.. 3.. 1.. 2.. 3.. Conclusion. 5.. 6.. 7.. Recommendations For improving self-worthiness of the Children with Specific Learning Disability the study recommend the following 1. An Awareness programme on coping mechanism should be conducted among the Children with Specific Learning Disability in every school.. To overcome the academic backwardness among the Children with Specific Learning Disability supportive systems like video conferencing, reading soft ware’s, audio and video recording instruments, computer aided programme to be used. It will increase their self confidence about their understanding and reproducing abilities. In each school educational councelor should be appointed to deal with the Children with Learning Disability to reduce their inferiority’ complex.. References. 4. The study found that psychological problems like low self-worthiness were found very high among the Children with Specific Learning Disability. Moreover, the Children with Specific Learning Disability experienced marked level of poor Academic performance in their academic tasks. It created stress and strain in their academic life. Besides, the current study found that significant difference and variance of low self-worthiness and academic achievement of the Children with Specific Learning Disability.. 19. 8.. www.ijphr.com. Afreen, H., &Dilshad, M. (2006), Prevalence of learning difficulties /disability among primary school children: Effect on emotional problems and academic achievement. Unpublished dissertation submitted to University of Agricultural science. Deng & Ling.(2005), A study of Time Management Disposition between Middle school Students with Learning Achievements and Difficulties. Journal of Clinical Psychology,Vol.13(2),pp.190-192-202. Aggarwal, Y.P., & Sunita, C. (2003), Learning achievement of slum children in Delhi. New Delhi: National Institute of Educational Planning and Administration, pp.59. Margalit,M.,(1998), Loneliness and coherence among pre-school children with learning disabilities, Journal of Learning Disabilities,Vol. 31,pp.173-180. Rosenberg, M. (1965), Society and the adolescent self-image. Princeton, NJ: Princeton University Press. Whitley and Mckenna, J. L. (2007). A model of general self-concept for students receiving services for a learning disability, Dissertation abstracts from Humanities and Social Sciences, 68 (2-A), 472. Ramankutty & Krishnan, T.N. (2003). Epidemiological survey of learning disabilities in Kerala. Bevington, J., & Wishart, J.G. (1999). The influence of classroom peers on cognitive performance in children with behavioural problems. British Journal of Educational Psychology, 69, 19-32..
(9)
Figure

+2
Related documents
The Department of Veterans Affairs’ (VA) Program of Comprehensive Assistance for Family Caregivers (PCAFC), established by Congress in 2010 under Public Law (P.L.) 111-163, is
one or both of the constituent gates senses both input oligonucleotides... cleavage in the presence of only one input oligonucleotide. Two AND gates could be tiled together around
After 18 ... Instead 21 Rh4!? might be stronger, when the stakes quickly become quite high after 21 ... Rd5 22 Nf4 Rf5 and it feels like anything could happen.. Black is
We answer this question in Table 7. Like for high-seniority workers, there is evidence that earnings start to fall prior to displacement. Moreover, earnings losses reach their
It should also be stressed that the morphological differences between the honeybee’s antennae in the number of olfactory sensilla found (Frasnelli et al., 2010b) and the
facilitating the integration and provision of aid to the thousands of migrants and asylum seekers in Greece (PRAKSIS 2018; Solidarity Now 2016; Urban Working Group,
Each supplier meets on the market with the offer of its competitors, with credibility, establish an appropriate trustworthy relationship and understanding of customer needs is
Results from the pooled and individual faecal samples and environmental samples collected for the evaluation of the protection against Salmonella Typhimurium and its
