JETIR1505061 Journal of Emerging Technologies and Innovative Research (JETIR) www.jetir.org 1675
Project Performance Evaluation by Earned Value
Analysis
A case study on multi-storeyed building at Bengaluru
1
Raveesh L R, 2Sundip Shenoy
1
Post graduate student, 2Assistant Professor Department of Civil Engineering,
NMAM Institute of Technology, Nitte, Karnataka, India
Abstract—Earned value is a project control technique which provides cost and schedule performance measurements. It compares actual accomplishment of scheduled work and associated cost against an integrated schedule and budget plan. EVM provides project managers and the organization with triggers or early warning signals that allow them to take timely actions in response to indicators of poor performance and enhance the opportunities for project success. The concept of earned value is generally used in the context of fixed price contracts where the objective is to calculate the amount of payment that is due to the contractor. In this study, an attempt is made to analyse the real construction project and come up with forecasts about the cost and schedule variances at the end of the project.
Index Terms—Project Performance Evaluation, Earned Value, Earned Schedule, Cost Control, Forecasting.
________________________________________________________________________________________________________
I.INTRODUCTION
The main objective of project management is that the project is completed on schedule and within budget achieving the project goals. To achieve success stringent project controls are necessary to provide early identification of potential schedule slippage and budget overruns. Every project is different and should have its own project monitoring and control system. The management should be able to take decisions effectively about the redistribution of resources and schedule adjustments based on the system adopted for the project.
II.USE OF EVA IN CONSTRUCTION PROJECTS
EVA can be used for progress payments to contractors based on the earned value (EV) of contracted or outsourced work. Since such contractual arrangements create legal and financial obligations, it is important to consider the method specified for evaluating progress. These methods and tools for the determination of progress should be carefully considered and negotiated to achieve a fair and equitable environment that encourages successful accomplishment of contracted or outsourced project items.
Once a project has advanced to a stage of performance, the consistent and constant flow of information on the true status of the project is essential. The fundamental principle of EVM is that the patterns and trends of performance, when compared against a soundly developed baseline, can be excellent predictors of the future project performance. Feedback is critical to the success of any project. Getting the relevant feedback in time enables project managers to identify problems early and make adjustments that keeps a project on time and on budget. One of the most effective performance analysis and feedback tools for controlling construction projects is EVM.
In EVM system, the three parameters that influence the project performance control are:
Planned Value (PV)
The sanctioned budget assigned to a scheduled work is the Planned value (PV). It may also be known as the Budgeted Cost for Work Scheduled (BCWS). This budget is allocated by phases over the life of the project, but at a given moment, planned value outlines the physical work that should have been accomplished. The overall PV is at times referred to as the PMB (Performance Measurement Baseline). The total PV of the project is also known as budget at completion () [1].
Earned Value (EV)
The measure of work performed at a specific point in time is Earned value (EV), which is expressed in terms of the authorized budget for that work. The EV being measured needs to be related to the PMB, and it cannot be greater than the authorized budget for an activity. The EV is often used to calculate the percentage completion of a project. Progress evaluation criteria should be established for each work breakdown structure (WBS) component to measure work in progress. The earned value methodology used to plan the baseline should be used consistently to determine the earned value. Current status of the project can be determined by incrementally calculating EV. Also overall performance tendencies can be known by cumulatively calculating EV [2], [1].
Actual Cost (AC)
JETIR1505061 Journal of Emerging Technologies and Innovative Research (JETIR) www.jetir.org 1676
time period as EV and for the same activity or work breakdown structure component as EV. Fig. 1 shows the actual cost at time now, and indicates that the organization has spent more than it planned to spend in order to achieve the work performed to date.
Fig. 1 Earned Value curve for a project over budget and behind schedule
III.CALCULATING PERFORMANCE
EVA analysis involves calculating variances and indices related to the cost and schedule of the project. They are:
Schedule Variance (SV)
Schedule variance (SV) at a given point in time indicates whether the project is ahead or behind the planned delivery date. SV is a degree of schedule performance of a project, which is equal to the difference of earned value (EV) and the planned value (PV). This is a useful metric which indicates when a project is lagging behind or is ahead of its baseline schedule. The EVM schedule variance will be equal to zero when the project is completed since all of the planned values will have been earned.
(1)
Cost Variance (CV)
Cost variance (CV) at a given point in time is the amount of budget shortage or surplus. It defines the cost performance of a project, which is the difference between the earned value (EV) and the actual cost (AC) of the project. The budget at completion (BAC) minus the actual amount spent will be the CV at the completion of the project.
(2)
Schedule Performance Index (SPI)
The schedule performance index (SPI) is a measure of schedule efficiency expressed as the ratio of earned value to planned value. SPI indicates the rate at which the project is progressing. It is sometimes used in combination with the cost performance index (CPI) to calculate the final project completion estimate forecasts. An SPI value less than 1.0 shows less work completed than the planned. An SPI greater than 1.0 indicates that more work was completed than was planned.
(3)
Cost Performance Index (CPI)
The cost performance index (CPI) is a measure of the cost efficiency of budgeted resources, expressed as a ratio of earned value to actual cost. It is termed as the most critical EVM metric that measures the cost efficiency for the work accomplished. A CPI value of less than 1.0 indicates a cost overrun for work completed and greater than 1.0 shows a cost underrun for performance till date.
(4)
IV.FORECASTING PERFORMANCE
During the development stage of the project, the future cost and schedule performance can be forecasted. Common forecasting data includes:
Estimate to Complete (ETC)
Co st
JETIR1505061 Journal of Emerging Technologies and Innovative Research (JETIR) www.jetir.org 1677
The estimate to complete (ETC) is the expected cost needed to complete all of the remaining work for a control account, work package, or the project. The most accurate method is to develop a new, detailed, bottom-up estimate based on an analysis of the remaining work.
Estimate at Completion (EAC)
Estimate at completion (EAC), is the expected total cost of a control account, work package, or the project when the defined scope of work will be completed. The EAC is typically based on the actual cost incurred for work completed (AC), plus an estimate to complete (ETC) for the remaining work.
Variance at Completion (VAC)
The cost variance at completion (VAC), derived by subtracting the EAC from the BAC, forecasts the amount of budget deficit or surplus at the end of the project. The VAC shows the team whether the project is forecasted to finish under or over budget. This can be expressed as a percentage by dividing VAC by BAC.
To Complete Performance Index (TCPI)
The TCPI is a comparative measure. It compares work completed to date with budget required to complete the remaining work. The TCPI data can be used as the basis for a discussion which explores whether the performance required is realistically achievable. It is the ratio of remaining work to the remaining budget.
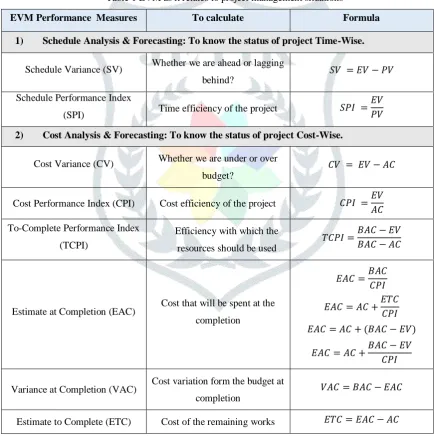
Table 1 EVM as it relates to project management situations
EVM Performance Measures To calculate Formula
1) Schedule Analysis & Forecasting: To know the status of project Time-Wise.
Schedule Variance (SV) Whether we are ahead or lagging behind?
Schedule Performance Index
(SPI) Time efficiency of the project
2) Cost Analysis & Forecasting: To know the status of project Cost-Wise.
Cost Variance (CV) Whether we are under or over budget?
Cost Performance Index (CPI) Cost efficiency of the project
To-Complete Performance Index (TCPI)
Efficiency with which the resources should be used
Estimate at Completion (EAC) Cost that will be spent at the completion
Variance at Completion (VAC) Cost variation form the budget at completion
Estimate to Complete (ETC) Cost of the remaining works
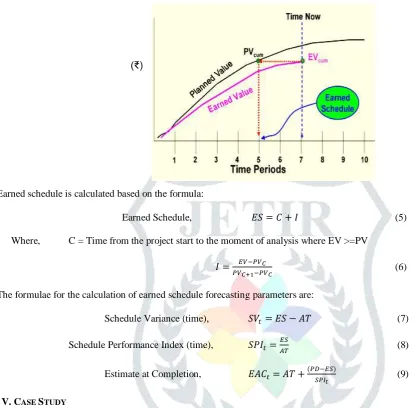
Earned Schedule (ES)
JETIR1505061 Journal of Emerging Technologies and Innovative Research (JETIR) www.jetir.org 1678
currency in EVA. ES theory provides updated formulas for the computation of SV and SPI in two distinct domains: SV(₹) and SPI(₹), relating to currency; and SV(t) and SPI(t), relating to time.
Fig 2 Earned Schedule
Earned schedule is calculated based on the formula:
Earned Schedule, (5) Where, C = Time from the project start to the moment of analysis where EV >=PV
(6)
The formulae for the calculation of earned schedule forecasting parameters are:
Schedule Variance (time), (7) Schedule Performance Index (time),
(8)
Estimate at Completion,
(9)
V.CASE STUDY
The selected site for the case study is located in Nayandahalli, Bengaluru. The building consists of residential apartments of 2B+G+24 with a helipad on the terrace equipped with modern amenities, Spacious Residential Dwellings, Private Garden Sit-outs, Club House, Gymnasium, Helipad on the Terrace. Each floor consists 10 no.s of combination of 2BHK AND 3BHK Luxury apartments comprising of total 246 apartments.. The project is a “turn-key” where the scope of the contractor is to carry out every work included in the BOQ at the quoted rate. The details are shown in Table 2.
Table 2 Project Details
Client Apple Shelters (I) Ltd. Contractor SICL, Bengaluru Name of the project Apple Spire
Total Duration 30 Months Contract Amount ₹. 74,43,45,00,000/-
The details of the project are collected from the site and project activities, cost and schedule details are prepared. It is shown in Table 3 and Table 4. This gives an overview of activities involved and total cost of the project. Also gives an idea of time required to complete the construction.
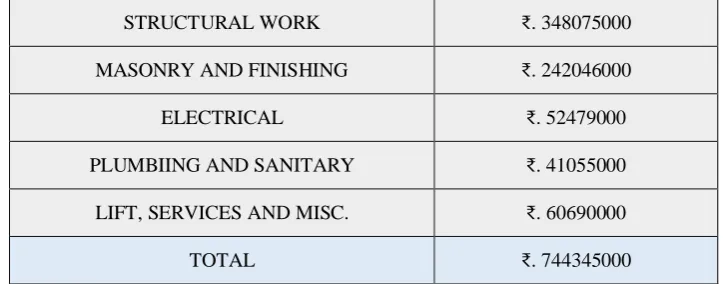
Table 3 Project cost details
JETIR1505061 Journal of Emerging Technologies and Innovative Research (JETIR) www.jetir.org 1679
STRUCTURAL WORK ₹. 348075000 MASONRY AND FINISHING ₹. 242046000 ELECTRICAL ₹. 52479000 PLUMBIING AND SANITARY ₹. 41055000 LIFT, SERVICES AND MISC. ₹. 60690000 TOTAL ₹. 744345000
Table 4 Project Schedule details
Task Activity Duration Start Finish
Project 925 days Wed 18-09-13 Fri 01-07-16 Issue of WO 1 day Wed 18-09-13 Wed 18-09-13 Mobilisation 15 days Mon 23-09-13 Thu 10-10-13 Drawings 50 days Mon 16-12-13 Wed 12-02-14 Tower (2B + G + 24F +
Helipad) 758 days Tue 17-12-13 Tue 14-06-16 Marking & Preliminary
Activities 2 days Tue 17-12-13 Wed 18-12-13 Sub Structure 437 days Tue 17-12-13 Mon 25-05-15 Super Structure 606 days Fri 31-01-14 Sat 30-01-16 Finishes Works 595 days Mon 30-06-14 Tue 14-06-16 Lift Installation 60 days Thu 18-02-16 Fri 29-04-16
STP 692 days Fri 14-02-14 Thu 26-05-16 UG Sump 476 days Wed 30-07-14 Wed 24-02-16 Storm Water Drain 273 days Fri 16-01-15 Thu 10-12-15 Swimming Pool 128 days Tue 17-11-15 Sat 16-04-16 External Landscape,
paving and fencing 150 days Thu 03-12-15 Sat 28-05-16 Electrical Works 105 days Thu 13-08-15 Mon 21-12-15
HVAC Works 51 days Mon 28-03-16 Fri 27-05-16 Organic Waste
Convertor
60 days Fri 18-03-16 Sat 28-05-16
JETIR1505061 Journal of Emerging Technologies and Innovative Research (JETIR) www.jetir.org 1680
piping works
Compound Wall 114 days Fri 18-12-15 Mon 02-05-16 Road Work 70 days Sat 16-01-16 Thu 07-04-16
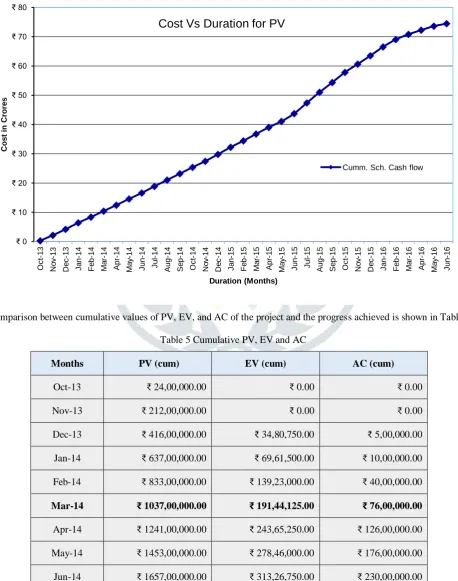
From the collected data, cost Vs duration curve is plotted for the planned value (PV) of the project. This curve is called the S-curve, which forms the base for EV analysis. The curve is shown in Fig 3.
Fig 3 S-Curve for the project
The comparison between cumulative values of PV, EV, and AC of the project and the progress achieved is shown in Table 5. Table 5 Cumulative PV, EV and AC
Months PV (cum) EV (cum) AC (cum)
Oct-13 ₹ 24,00,000.00 ₹ 0.00 ₹ 0.00 Nov-13 ₹ 212,00,000.00 ₹ 0.00 ₹ 0.00 Dec-13 ₹ 416,00,000.00 ₹ 34,80,750.00 ₹ 5,00,000.00
Jan-14 ₹ 637,00,000.00 ₹ 69,61,500.00 ₹ 10,00,000.00 Feb-14 ₹ 833,00,000.00 ₹ 139,23,000.00 ₹ 40,00,000.00
Mar-14 ₹ 1037,00,000.00 ₹ 191,44,125.00 ₹ 76,00,000.00
Apr-14 ₹ 1241,00,000.00 ₹ 243,65,250.00 ₹ 126,00,000.00 May-14 ₹ 1453,00,000.00 ₹ 278,46,000.00 ₹ 176,00,000.00 Jun-14 ₹ 1657,00,000.00 ₹ 313,26,750.00 ₹ 230,00,000.00
₹ 0 ₹ 10 ₹ 20 ₹ 30 ₹ 40 ₹ 50 ₹ 60 ₹ 70 ₹ 80 O c t-13 N o v-13 D e c -13 J a n -14 F e b -14 M a r-14 Ap r-14 M a y-14 J u n -14 J u l-14 Au g -14 Se p -14 O c t-14 N o v-14 D e c -14 J a n -15 F e b -15 M a r-15 Ap r-15 M a y-15 J u n -15 J u l-15 Au g -15 Se p -15 O c t-15 N o v-15 D e c -15 J a n -16 F e b -16 M a r-16 Ap r-16 M a y-16 J u n -16 C o s t in C ro re s Duration (Months)
Cost Vs Duration for PV
JETIR1505061 Journal of Emerging Technologies and Innovative Research (JETIR) www.jetir.org 1681
Jul-14 ₹ 1884,00,000.00 ₹ 348,07,500.00 ₹ 300,00,000.00
Aug-14 ₹ 2100,00,000.00 ₹ 382,88,250.00 ₹ 370,00,000.00 Sep-14 ₹ 2316,00,000.00 ₹ 417,69,000.00 ₹ 441,00,000.00
Oct-14 ₹ 2534,00,000.00 ₹ 487,30,500.00 ₹ 526,00,000.00
Nov-14 ₹ 2742,00,000.00 ₹ 522,11,250.00 ₹ 626,00,000.00
Dec-14 ₹ 2977,00,000.00 ₹ 556,92,000.00 ₹ 726,00,000.00
Jan-15 ₹ 3221,00,000.00 ₹ 591,72,750.00 ₹ 846,00,000.00
Analysis and Results
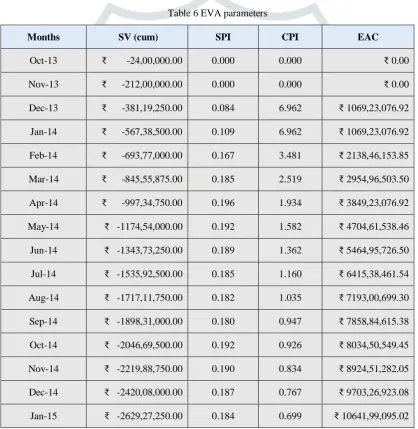
Using EVA, the schedule variance and indices are calculated which are further helpful in arriving at EAC or future cost predictions. It is tabulated in Table 6.
Table 6 EVA parameters
Months SV (cum) SPI CPI EAC
Oct-13 ₹ -24,00,000.00 0.000 0.000 ₹ 0.00 Nov-13 ₹ -212,00,000.00 0.000 0.000 ₹ 0.00 Dec-13 ₹ -381,19,250.00 0.084 6.962 ₹ 1069,23,076.92 Jan-14 ₹ -567,38,500.00 0.109 6.962 ₹ 1069,23,076.92 Feb-14 ₹ -693,77,000.00 0.167 3.481 ₹ 2138,46,153.85 Mar-14 ₹ -845,55,875.00 0.185 2.519 ₹ 2954,96,503.50 Apr-14 ₹ -997,34,750.00 0.196 1.934 ₹ 3849,23,076.92 May-14 ₹ -1174,54,000.00 0.192 1.582 ₹ 4704,61,538.46 Jun-14 ₹ -1343,73,250.00 0.189 1.362 ₹ 5464,95,726.50 Jul-14 ₹ -1535,92,500.00 0.185 1.160 ₹ 6415,38,461.54 Aug-14 ₹ -1717,11,750.00 0.182 1.035 ₹ 7193,00,699.30 Sep-14 ₹ -1898,31,000.00 0.180 0.947 ₹ 7858,84,615.38 Oct-14 ₹ -2046,69,500.00 0.192 0.926 ₹ 8034,50,549.45 Nov-14 ₹ -2219,88,750.00 0.190 0.834 ₹ 8924,51,282.05 Dec-14 ₹ -2420,08,000.00 0.187 0.767 ₹ 9703,26,923.08 Jan-15 ₹ -2629,27,250.00 0.184 0.699 ₹ 10641,99,095.02
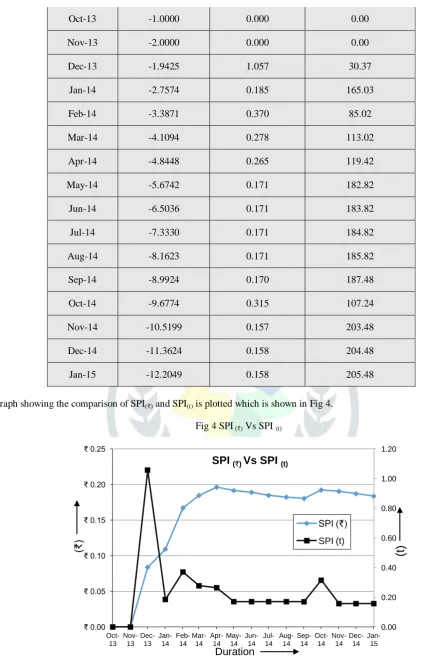
As the EV analysis produces schedule variances in terms of cost, we adopted earned schedule analysis for the computation of schedule variance in the domain of time. The results are tabulated under Table 7.
Table 7 ES parameters
JETIR1505061 Journal of Emerging Technologies and Innovative Research (JETIR) www.jetir.org 1682
Oct-13 -1.0000 0.000 0.00 Nov-13 -2.0000 0.000 0.00 Dec-13 -1.9425 1.057 30.37
Jan-14 -2.7574 0.185 165.03 Feb-14 -3.3871 0.370 85.02 Mar-14 -4.1094 0.278 113.02 Apr-14 -4.8448 0.265 119.42 May-14 -5.6742 0.171 182.82 Jun-14 -6.5036 0.171 183.82 Jul-14 -7.3330 0.171 184.82 Aug-14 -8.1623 0.171 185.82 Sep-14 -8.9924 0.170 187.48 Oct-14 -9.6774 0.315 107.24 Nov-14 -10.5199 0.157 203.48 Dec-14 -11.3624 0.158 204.48 Jan-15 -12.2049 0.158 205.48 A graph showing the comparison of SPI(₹) and SPI(t) is plotted which is shown in Fig 4.
Fig 4 SPI (₹) Vs SPI (t)
Fig 5 shows the comparison of cumulative values of EVA parameter SV(₹) and ES parameter SV(t) for the project.
Fig 6 SV(₹) Vs SV(t)
0.00 0.20 0.40 0.60 0.80 1.00 1.20
₹ 0.00 ₹ 0.05 ₹ 0.10 ₹ 0.15 ₹ 0.20 ₹ 0.25
Oct-13
Nov-13
Dec-13
Jan-14
Feb-14
Mar-14
Apr-14
May-14
Jun-14
Jul-14
Aug-14
Sep-14
Oct-14
Nov-14
Dec-14
Jan-15
(t)
(₹
)
Duration SPI (₹) Vs SPI (t)
SPI (₹)
JETIR1505061 Journal of Emerging Technologies and Innovative Research (JETIR) www.jetir.org 1683
VI.RESULTS
The EV analysis brings out a number of facts and figures about the project. These values are required for the evaluation of the project performance. At the end of Jan-15, a SV of ₹. -26,29,27,250 indicates the amount by which the project is lagging behind the schedule. It simply means that the scheduled activities of worth ₹. 26,29,27,250 should have been carried out till the end of Jan-15. In other words, a SPI of 0.184 gives an idea of percentage of work accomplished as compared to the schedule. The project is progressing at 18.4% of the rate originally scheduled. And moreover this rate is being achieved at the expense of 30.1% more budget which is indicated by a CPI of 0.699. This simply means that for every rupee spent on the project, we are getting a productivity of 69.9 paisa only. This is a clear indicator of over budget in the project.
As it is confusing to say the schedule variations in terms of money or cost, earned schedule is used for the calculation of actual lag. ES parameters presented in table 4.6 present the insight into the actual project delay. As on Jan-15, i.e., on 16th month of the project, SV(t) of -12.20 conveys that the project is effectively lagging behind the schedule by 12.20 months, which is to say a work of 3.8 months have been carried out at the site. Now, taking EVA into consideration, this may tell us that 3.8 months of work carried out to accomplish 18.4% of the schedule, at a value of ₹.1.30/- instead of ₹.1/-.
Further, Fig 4 provides comparison between schedule variances and schedule indices of EVA and ES analysis. SPI(t) shows sharp increase in the month of Dec-13, which then falls abruptly in the month of Jan-14. The curve then nearly follows the SPI(₹) trend. Sudden compliance with schedule leads to the higher SPI(t) and subsequent delay hints to the fall in SPI(t). The trend is similar in the case of Fig 5, where the variance SV(₹) is minimum in the month of Dec-13. Then onwards the variance increases indicating a deviation from the schedule to a larger extent.
VII.CONCLUSIONS
Project management plays a crucial role in completing the project within time and budget. EVA is a very efficient tool in achieving it. Earned Schedule combined with EVA produces schedule performance in terms of time that is easy for interpretation of performance. Based on the results the project manager can take decisions to accelerate the project for achieving the planned activities.
From the collected data and calculated results it can be concluded that:
• Currently the project is lagging behind the schedule and is running over budget.
• At the beginning stage of the project the critical activities were not closely monitored, which seems to be the reason for the delay of the project.
• Due to the delay in completing the activities, cost escalations and overheads are being experienced which is leading to increase in actual cost of the project.
• The project needs immediate attention to get it back on track.
Now, the future predictions have been detailed in this analysis, based on the final completion of this project, we can find out the reasons for the variance in schedule and cost of the project.
VIII.ACKNOWLEDGEMENT
I extend my gratitude to Renaissance Construction Technologies (I) LLP for giving me an opportunity to take up my project at their site and for providing me all the required details about the project.
REFERENCES
[1] PMI, A Guide to the Project Management Body of Knowledge (PMBOK), 4th Edition, Project Management Institute, USA, 2008.
[2] PMI, Practice Standard for Earned Value Management, 2nd Edition, Project Management Institute, USA, 2005.
-14.00 -12.00 -10.00 -8.00 -6.00 -4.00 -2.00 0.00
-₹40 -₹35 -₹30 -₹25 -₹20 -₹15 -₹10 -₹5 ₹0
(t)
(₹
)
x
1
0
0
0
0
0
0
0
Months
SV(₹) Vs SV(t)
SV(₹)
JETIR1505061 Journal of Emerging Technologies and Innovative Research (JETIR) www.jetir.org 1684
[3] Pramod M, K. Phaniraj and V. Srinivasan, “Monitoring System for Project Cost Control in Construction Industry”, in International Journal of Engineering Research & Technology (IJERT), Vol. 3, Issue 7, pp. 1487-1491, July 2014. [4] Jose Angelo Valle and Carlos Alberto Pereira Soares, “The Use of Earned Value Analysis (EVA) in the Cost
Management of Construction Projects”, International Journal of Engineering and Innovative Technology, pp1-11, Mar 2011.
[5] Antony Prasanth M A and K Thirumalai Raja, “Project Performance Evaluation by Earned Value Method”, International Conference on Engineering Technology and Science, Volume 3, Special Issue 1, Feb. 2014.