Optimization of Partial Oxidation of Methane for
Hydrogen Production on NiO-CoO/MgO Catalyst
Using Design of Experiment
T.D. Kusworo*
1, A.R. Songip
2, N.A.S. Amin
2*1Department of Chemical Engineering, University of Diponegoro, Jl. Prof Sudharto, Tembalang, Semarang, Indonesia
2
Department of Chemical Engineering, Faculty of Chemical and Natural Resources Engineering, Universiti Teknologi Malaysia, 81310 UTM Skudai, Johor, Malaysia.
Abstract— Statistical experimental method was employed to study the effect of Co/Ni ratio, temperature and CH4/O2 ratio
on partial oxidation of methane. Full factorial design and response surface methodology (RSM) coupled with central composite design (CCD) were used to optimize the partial oxidation of methane for hydrogen production. A central composite design was used to determine the optimum variables (Co/Ni ratio, temperature and CH4/O2 ratio) in obtaining the
maximum conversion of methane and selectivity of hydrogen. The optimal conditions for maximum conversion of methane were found as follows: Co/Ni ratio = 0.8, CH4/O2 ratio = 1.8 and
T = 572 oC while corresponding values of 0.8, 2 and 560 oC, respectively for maximum hydrogen selectivity.
Index Term
—
optimization, response surface methodology, central composite designI. INTRODUCTION
Steam reforming of methane (SRM) is a well established process for converting natural gas into synthesis gas (a mixture of hydrogen and carbon monoxide) in industry [1-4]. Synthesis gas is used for methanol production and synthesis of higher hydrocarbons [3]. Partial oxidation of methane (POM) and autothermal reforming (a combination of steam reforming and partial oxidation) have been investigated as potential effective processes to produce hydrogen for fuel cells [5]. Fuel cell systems employing partial oxidation generally have lower electrical generation efficiencies than those employing steam reforming where unused heat from the fuel cell is used for supplying the endothermic reforming reaction. However, for certain applications the lower efficiency maybe offset by advantages such as compactness, rapid start-up, responsiveness to load change and overall cost [5-6]. The partial oxidation of methane (Equation 1) to CO and H2,
CH4 + ½ O2 CO + 2 H2 (1) is a mildly exothermic reaction (ΔH = -5.4 kcal/mole) [6]. Therefore, unlike steam reforming process, POM is not an energy intensive process.
The reaction mechanism of POM is yet to be established [6]. One possibility is that part of the methane is completely oxidized to CO2 and H2O followed by reforming reaction converting the remainder of the methane to synthesis gas [5,6, 8]. Hickman and Schmidt [7] claimed that CO and H2 are formed directly as primary product on Pt and Rh impregnated monoliths at high temperatures and short residence time.
Highly active and stable catalyst becomes more significant for an on site H2 generation system or a compact fuel system [2, 8]. Noble metal catalysts such as Ir, Pt, Pd, and Rh have excellent activity for partial oxidation of methane [9-10], but they are costly. Therefore, different kinds of base metal catalysts like Co, Fe, Ni have been tested [2, 3, 11-14]. Many studies have focused on nickel catalyst due to their high activity and relatively low cost. NiO on alumina is an effective catalyst for the oxidation of methane to synthesis gas [8-9]. However, the catalyst deactivates with time on stream due to nickel crystallite growth, formation of a spinel, NiAl2O4, and carbon deposits [11]. Previous work reported that it is difficult to prevent the sintering of nickel [23]. The decomposition of methane (equation 2) and the Boudouard reaction (equation 3) are the main routes leading to carbon deposition on nickel catalysts [20].
CH4 C + 2H2 ΔH = 89.9 kJ/mole (2) 2CO C + CO2 ΔH = -171 kJ/mole (3) Choudhary et al. (1998) and Ruckenstein and Hu (1999) reported that the Ni-MgO catalyst showed high activity and selectivity in the process with very low carbon deposition rates. It was suggested that the formation of a NiO/MgO solid solution suppressed the agglomeration of small Ni particles to large crystallites, which are generally susceptible to carbon deposition. However, when this catalyst is directly supported on different catalyst carrier to increase its mechanical strength and thermal/hydrothermal stability, the resulting supported catalyst showed lower activity and selectivity in the process [13]. Mixed metal oxides, Co-MgO [14] was reported to be a highly active catalyst at high temperature with improved carbon resistance. It is, therefore, interesting to investigate the performance of the combined Co-Ni-MgO catalyst in the partial oxidation of methane.
number of experiments [16]. Experimental design techniques usually depend on empirical model structure in order to interpret experimental data and provide optimum process conditions.
In general, response surface methodology (RSM) allows an empirical model to be built from data collected from a minimal set of systematically designed experiments. The RSM integrates mathematical and statistical techniques, [17] and was essentially developed from numerical method. The RSM is initiated with an experimental design commonly called design of experiment (DOE) to screen model parameters before going to the optimization process [17].
Statistical technique has been successfully applied in the field of quality experimental work [4, 15-17]. Larentis et al [4] studied optimization of the combined process of carbon dioxide and partial oxidation of methane. In their work, they use full factorial experimental design to obtain maximum methane conversion and maximum synthesis gas selectivity. The authors concluded that experimental design could be used to optimize the process and obtain maximum methane conversion and synthesis gas selectivity. Effects of calcination conditions on the mechanical properties of a PCoMo/Al2O3 hydrotreating catalyst were studied by Wu et al. [18]. They used response surface methodology and central composite design to develop mathematical model and to optimize the mechanical properties of solid catalyst in the calcinations process. They demonstrated that central composite design and response surface methodology are useful in optimization process and mathematical modeling of the mechanical properties of solid catalyst.
In this study, full factorial design was employed in planning the experiment to determine the effect of the process variables in partial oxidation of methane and evaluate the performance of Co-Ni/MgO catalyst in the process. A response surface methodology and central composite design was used in optimization experiments and iterative regression analysis to determine the maximum methane conversion and synthesis gas selectivity. The main goal of this paper is to optimize independent variables such as ratio of feed gas, ratio of cobalt and nickel in different operating temperatures.
II. EXPERIMENTAL
A. Catalysts
The supported NiO-CoO/MgO catalysts were prepared by impregnating the supports Mg (NO3)2 6 H2O with aqueous solutions of Ni (NO3)2, 6 H2O or Co (NO3)2 6 H2O followed by overnight drying at 120 oC. The samples were then calcined in a box furnace for four hours at 800 oC. The catalysts were characterized by nitrogen adsorption, XRD, and TPR.
B. Apparatus
The partial oxidation of methane to synthesis gas was studied using a fixed bed reactor with 9 mm inside diameter and 300 mm length. The reaction temperature was controlled with a digital controller. The flow of each gas stream was controlled with a mass flow meter (Alicat Scientific). The analysis of effluent gases was performed with a GC-TCD using Porapak N packed column. The reactants used were pure methane (>99.95 %) and oxygen (99.99%). In this study,
CH4 conversion, H2 selectivity and CO selectivity are defined according to equations (4) - (6).
CH4conversion = (4)
CO selectivity = (5)
H2selectivity = (6)
C. Experimental Design
The reaction parameters were optimized using a technique called the response surface methodology [17]. A central composite design and full factorial design were employed in this regard. Three independent experimental variables, namely, Co/Ni ratio (X1), operation temperature (X2) and CH4/O2 ratio (X3) were selected as controlled factors. Their experimental range and levels used in this work are given in Table 1. The lower, upper, and centre point of the design were coded as -1, 1, 0 and α, where + 1 denotes high level, -1 low level, α = 2 n/4 (n = number of variables or factors) is the star point, and 0 corresponds to the center point. The star points were added to the design to provide of curvature estimation for the model. Based on the type of experimental design used, 16 experiments were needed.
According to this design, the total number of treatment combinations is 2k + 2 k + no, where ‗k‘ is the number of independent variables and no is the number of experiments repeated at the center point. The experimental plan and levels of independent variables are shown in Table 2. For statistical calculation, the variables Xi have been coded as xi according to equation (7):
xi = (Xi-Xo)/δX (7)
where, xi = dimensionless coded value of the variable Xi, Xo = the value of the Xi at the center point, and δX = step change.
TABLE I
THE LEVELS OF VARIABLES CHOSEN FOR TRIALS
- -1 0 +1 +
Co/Ni 0.309 0.5 0.75 1 1.2
Temperature
(o C)
393 450 525 600 658
CH4 / O2 1.18 1.5 2 2.5 2.88
100% stream inlet in methane of mole
reacted methane of
mole
100% CH from reacted atom carbon of mole
produced CO in atom carbon of mole
4
100% CH from reacted atom hydrogen of
mole
produced H
in atom hydrogen of
mole
4
TABLE II
FACTORIAL CENTRAL COMPOSITE EXPERIMENTAL DESIGN
Run
Coded Variables
Co/Ni T, oC CH 4/O2
1 0.5 450 1.5
2 0.5 450 2.5
3 0.5 600 1.5
4 0.5 600 2.5
5 1.0 450 1.5
6 1.0 450 2.5
7 1.0 600 1.5
8 1.0 600 2.5
9 (C) 0.75 525 2.0
10 0.309 525 2.0
11 1.19 525 2.0
12 0.75 393 2.0
13 0.75 657 2.0
14 0.75 525 1.1
15 0.75 525 2.88
16 (C) 0.75 525 2.0
Response surface methodology was applied to the conversion and selectivity data using the commercial Statistica Stat Software version 6. The statistical experiment design provides second order polynomial equation for the prediction of the effects of experimental variables and their interactions on the response variables. Each response Y can be represented by a quadratic model of the response surface, here with three independent variables as shown in equation (8)
(8)
where Yi is the predicted response (YCCH4,YSCO and Y SH2), βo the offset term, βj the linear effect, βij the interaction effect, βjj the squared effect. In this study, the conversion of methane and the selectivity of hydrogen and carbon monoxide were obtained as the responses of the experiment. Response contour and surface plots, analysis of variance and standard deviation were generated with Statistica Stat Software version 6.The statistical analysis of the model was performed in the form of analysis of variance (ANOVA). This analysis included the Fisher‘s F-test (overall model significance), its associated probability p(F), correlation coefficient R, and determination coefficient R2 which measure the goodness of the fitted regression model. It also includes the student‘s t-value for the estimated coefficients and the associated probabilities p(t). For each variable, the quadratic models were represented as contour plots (2D) and surface plots (3D).
III. RESULTSANDDISCUSSIONS
A. Checking Fitted Model
The experimental results according to the proposed experimental design are given in Table 3. The coefficients of the model developed for the three responses were estimated with multiple regression analysis on the experimental data. The following second order polynomial equations [eqs (9-11)]
provided the predicted responses for all three dependent variables;
YCH4 conversion = -259.9 + 82.8 (Co/Ni) + 0.9 (Temp) + 68.0 (CH4/O2) – 100.3 (Co/Ni)2 – 0.001(Temp)2 – 23.5(CH4/O2)2 + 0.053(Co/Ni)(Temp) + 26.8 (Co/Ni) (CH4/O2)- 0.009
(Temp) (CH4/O2) (9)
YCO Selectivity = -453.7 + 231.8 (Co/Ni) + 1.1 (Temp) + 111.8 (CH4/O2) – 125.9(Co/Ni)2 – 0.001(Temp)2 – 25.7 (CH4/O2)2 – 0.162(Co/Ni)(Temp) + 22.9(Co/Ni) (CH4/O2)– 0.052(Temp) (CH4/O2)
(10)
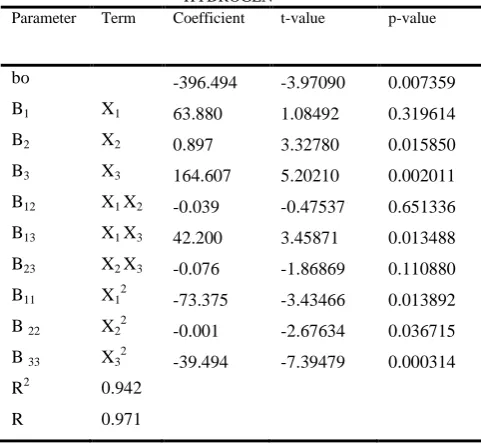
YH2Selectivity = -396.5 – 63.9 (Co/Ni) + 0.897 (Temp) + 164.6 (CH4/O2) – 73.4 (Co/Ni)2 – 0.001(Temp)2– 39.5 (CH4/O2)
2 – 0.039(Co/Ni)(Temp) + 42.1(Co/Ni) (CH 4/O2)– 0.076 (Temp) (CH4/O2)
(11)
The quality of fit of the models can be judged from their coefficients of correlation. The R value for the conversion and selectivity are 0.94, 0.91 and 0.97, respectively, indicating there is a fairly good agreement between the experimental and predicted values from the models. From Tables IV - VI the values of R2 for the conversion and selectivity are 0.89, 0.83 and 0.94, respectively which implies that 89 %, 83 % and 94 % of the total variation in the three responses are attributed to the experimental variables.
TABLE III
FACTORIAL CENTRAL COMPOSITE DESIGN THREE VARIABLES WITH THE OBSERVED RESPONSES AND PREDICTED VALUES Run Yo m Yp m YoCO YpCO Yo H2 Yp H2
1 72.70 75.40 19.50 13.23 19.40 21.90
2 64.20 58.55 13.50 10.05 11.60 15.43
3 89.90 84.91 27.7 31.04 33.50 36.43
4 60.90 66.66 21.30 20.01 20.80 18.56
5 80.60 73.69 17.40 15.37 18.70 21.76
6 66.40 70.24 30.30 23.63 38.50 36.39
7 82.70 87.20 20.90 21.02 36.40 33.38
8 86.20 82.36 18.50 21.44 38.30 36.62
9 92.60 91.63 38.20 37.99 46.40 45.59
10 65.30 65.97 9.20 11.92 27.00 23.42
11 77.50 78.30 13.50 15.06 36.70 39.23
12 64.90 67.75 9.20 18.01 31.70 27.97
13 88.20 86.83 36.30 31.77 38.30 40.98
14 80.80 82.90 18.10 19.21 19.00 16.30
15 64.40 63.77 13.60 16.77 11.80 13.45
16 90.50 91.63 37.30 37.99 44.90 45.59
Yo m = Observed CH4 conversion Yp m = Predicted CH4 conversion Yo CO = Observed CO selectivity Yp CO = Predicted CO selectivity Yo H2 = Observed H2 selectivity Yp H2 = Predicted H2 selectivity
31 2 3
1 j
j jj j
i
j i ij j
j j o
i
x
x
x
x
The adequacy of each model was further checked with the analysis of variance (ANOVA) [17] as shown in Tables IV - VI. In ANOVA, the sum of squares of the total variation of each response is broken down into two components, i.e. regression and residual. The F-value for the regression is defined as MSreg/MSres, where MSreg is the mean square of regression, obtained by dividing the sum of squares of regression by the degree of freedom. MSres is the mean square of residual. In general, the calculated F value should be several times greater than the tabulated value for a good model. If the value of F is greater than the tabulated F (p-1, N-p, α), then the null hypothesis is rejected at the α-level of significance and implies that the variation accounted for by the model is significantly greater than the unexplained variation. The results in Table IV indicated the F values for methane conversion, CO selectivity and H2 selectivity are 5.14, 3.45 and 10.82, respectively, which are greater than the tabulated F (p-1, N-p, α), value of 3.37. Therefore, the null hypothesis is rejected, and the Fisher F test demonstrates a 95 % confidence level (α = 0.05). Consequently, the three models developed are correct and adequate.
TABLE IV
ANOVA FOR THE METHANE CONVERSION Sum of
squares
Degree
of
freedom
Mean
square F
Value F
Value
0.05 R2
SS
regresion
1644.04 9 182.67 5.14 3.37 0.88 S.S. error 213.05
6 35.51 S.S. total 1857.09
TABLE V
ANOVA FOR CO SELECTIVITY Sum of
squares
Degree
of
freedom Mean
square
F Value F
Value
0.05 R2
SS
regression
1254.60 9 139.4 3.47294 3.37 0.8277 S.S. error 240.83 6 40.14
S.S. total 1495.43
TABLE VI
ANOVA FOR HYDROGEN SELECTIVITY Sum of
squares
Degree
of
freedom Mean
square F
Value F
Value
0.05 R2
S.S.
regression
1811.77 9.00 201.31 10.82 3.37 0.94 S.S. error 111.65 6.00 18.61
S.S. total 1923.42
B. Significance of Regression Coefficientls
The significance of the regression coefficient was determined using the student‘s t tests [17-18]. The results are shown in Tables VII - IX. The p-value is used as a tool to check the significance of each of the coefficients. The larger
the t-test value and the smaller the p-value, the more significant is the corresponding coefficient and consequently, the greater is the distribution of the corresponding model term towards the response variable. The coefficients with one factor represent the effect of that particular factor, while the coefficients with two factors and those with second-order terms represent the interaction between the two factors and quadratic effect, respectively. Positive sign in front of the terms indicates synergistic effect, while negative sign indicates antagonistic effect.
TABLE VII
MULTIPLE REGRESSION RESULT AND SIGNIFICANCE OF REGRESSION COEFFICIENT FOR THE CONVERSION OF METHANE
Parameter Term Coefficient t-value p-value
bo -259.998 -1.88497 0.108405
B1 X1 82.763 1.01754 0.348159
B2 X2 0.911 2.44708 0.049988
B3 X3 68.036 1.55650 0.170594
B12 X1 X2 0.053 0.47465 0.651818
B13 X1 X3 26.800 1.59008 0.162919
B23 X2 X3 -0.009 -0.16613 0.873513
B11 X1
2
-100.253 -3.39719 0.014546 B 22 X2
2
-0.001 -2.49969 0.046548 B 33 X32 -23.520 -3.18806 0.018883
R2 0.8852
R 0.94
TABLE VIII
MULTIPLE REGRESSION RESULT AND SIGNIFICANCE OF REGRESSION COEFFICIENT FOR THE CO SELECTIVITY Parameter Term Coefficient t-value p-value
bo -453.661 -3.09353 0.021292
B1 X1 231.810 2.68062 0.036506
B2 X2 1.064 2.68744 0.036176
B3 X3 111.769 2.40503 0.052931 B12 X1 X2 -0.162 -1.35606 0.223890 B13 X1 X3 22.900 1.27793 0.248485 B23 X2 X3 -0.052 -0.87614 0.414651 B11 X12 -125.995 -4.01572 0.006993 B 22 X2
2
-0.001 -2.14711 0.075406 B 33 X32 -25.713 -3.27811 0.016862 R2 0.8277
TABLE IX
MULTIPLE REGRESSION RESULT AND SIGNIFICANCE OF REGRESSION COEFFICIENT FOR THE SELECTIVITY OF
HYDROGEN
Parameter Term Coefficient t-value p-value
bo -396.494 -3.97090 0.007359
B1 X1 63.880 1.08492 0.319614
B2 X2 0.897 3.32780 0.015850
B3 X3 164.607 5.20210 0.002011
B12 X1 X2 -0.039 -0.47537 0.651336
B13 X1 X3 42.200 3.45871 0.013488
B23 X2 X3 -0.076 -1.86869 0.110880
B11 X1 2
-73.375 -3.43466 0.013892 B 22 X22 -0.001 -2.67634 0.036715
B 33 X32 -39.494 -7.39479 0.000314
R2 0.942
R 0.971
From Tables VII - IX, the significant term for response model can be determined. For example, it can be found from Table VII that the variable with the largest effect on methane conversion is the quadratic term of Co/Ni ratio (X12) having a t-test value of 3.397 and a p-value = 0.0145. This is followed by the quadratic term of CH4/O2 ratio (X32) and temperature (X22) with p-values of 0.018 and 0.046, respectively. The effect of linear term of temperature (X3) is also significant (p-value = 0.0498). The effects of other terms on conversion are statistically insignificant. Next, from Table VIII, it can be observed that quadratic term of Co/Ni ratio (X12) produces the largest effect on selectivity of carbon monoxide (p-value = 0.0069), followed by CH4/O2 ratio (X32) (p-value = 0.0168). The effect of linear terms temperature (X2) and Co/Ni ratio (X1) are also significant with p-values of 0.0361 and 0.0365, respectively.
Likewise, from Table IX, it can be seen that quadratic CH4/O2 ratio (X32) is the most significant in determining the optimum H2 selectivity with p-value = 0.000314. This is followed by temperature (X2) with p-value = 0.0367. The effect of linear term of CH4/O2 ratio (X3) and temperature (X2) are also significant with p-values 0.00201 and 0.0158, respectively. One interesting factor is the effect of interaction between X1 and X3 is considerably important (p = 0.013). From the observation, tabulated in Tables VII-IX, CH4/O2 ratio in the feed is tremendously vital in the process of determining maximum methane conversion, CO selectivity and hydrogen selectivity. From statistical model, the optimum point for maximum methane conversion of 94.84 % when Co/Ni ratio = 0.803, temperature = 572 oC and CH4/O2 = 1.8. The highest CO selectivity is 39.03 % when Co/Ni ratio = 0.732, temperature = 565 oC and CH4/O2 = 1.9 and the highest H2 selectivity is 47.5 % when Co/Ni ratio = 0.87, temperature = 560 oC and CH4/O2 = 2.
C. Effect of Process Variables
The effect of Co/Ni ratios on the conversion and selectivity are shown in Fig. 1. The conversion of methane (X CH4) increased with increasing Co/Ni ratio up to Co/Ni
ratio = 0.75. When Co/Ni ratio was further increased, the conversion of methane reduced to 77.5 % at Co/Ni ratio = 1.2. As shown in Fig. 1, H2 selectivity and CO selectivity increased with respect to the increasing Co/Ni up to Co/Ni ratio = 0.75. As Co/Ni ratio was further increased the H2 selectivity and CO selectivity reduced to 38.5 % and 18.5 %, respectively at Co/Ni ratio = 1.2. As expected the surface area of catalysts increased with increasing Co/Ni ratio up to Co/Ni ratio = 0.75. As Co/Ni ratio was further increased the surface area reduced to 15.36 m2/gcat at Co/Ni ratio = 1.2.
Fig. 1. The effect of Co/Ni ratio in the partial oxidation of methane on CH4/O2 = 2 and temperature 525 oC, GHSV = 30,000 ml/gcat.h, Solid lines
= simulated; Dashed lines = experiment.
In general, if one reactant in a bimolecular reaction is present in more than its stoichiometry the surplus of this reactant will basically remain. One role of the surplus reactant is to act as a driver to shift the reaction equilibrium towards consumption of the other reactant involved in the same reaction. Partial oxidation of methane includes many chemical reaction steps. These reactions can lead to a variety of intermediate product. In order to understand the relationship between the methane conversion and synthesis gas selectivity, experiments were conducted with different CH4/O2 ratios.
The effect of CH4/O2 ratios in the feed on the conversion and selectivity at Co/Ni = 0.75 and T = 525 oC are shown in Fig. 2. The conversion of methane and selectivity for CO and hydrogen decreased with increasing CH4/O2 ratio. Oxygen conversion remained 100 % for all CH4/O2 ratios while methane conversion decreased from 95.5 to 64.4 % with the increase of CH4/O2 ratio. When CH4/O2 ratio was increased, the partial pressure of methane increased while the partial pressure of oxygen remained the same. Therefore, the methane conversion decreased due to the limited amount oxygen that was used up in all range of CH4/O2 ratio. The more oxygen in the feed is needed to obtain complete conversions of methane. The decrease in the selectivities for CO and H2 at below the CH4/O2 ratio = 2, indicates that the total combustion reaction (equation 12) occurs to form CO2 and H2O.
When the CH4/O2 is increased above 2, the conversion is decreased; the CO selectivity is also decreased. The results could be attributed to a contribution of the water gas shift reaction (equation 14) in the process. Roh et al [10] reported that the water gas shift reaction is more favorable when CH4 conversion is relatively low. The similar observation has been reported over Ni/La2O3 [12]. The resemblance between these works is the reactivity test was conducted in the range of CH4/O2 1 – 5. Therefore, CH4/O2 ratios in the feed are the important factor, which determines the product composition of partial oxidation. The investigation conducted by Wang and Ruckenstein [14] over Ni/SiO2 composite catalyst in partial oxidation of methane for hydrogen production also exhibited this phenomenon at CH4/O2 1.25 – 5.
Fig. 2. The effect of CH4/O2 ratio in the partial oxidation of methane on
Co/Ni = 0.75, temperature 525 oC and GHSV = 30,000 ml/gcat.h, Solid lines
= simulated; Dashed lines = experiment.
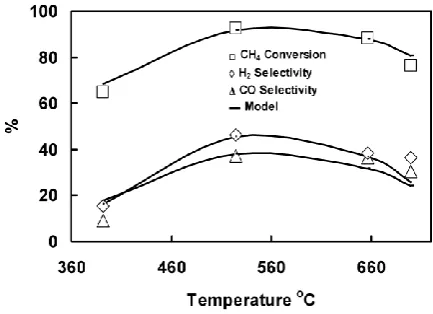
The effect of reaction temperature on methane conversion and selectivity for CO and H2 are shown in Fig. 3. The
results show that, with the increase in temperature the conversion of methane and selectivities for CO and H2 increased and reached maximum values at about T = 525 oC. At lower temperature (< 525 oC), the heat produced is more because of the highly exothermic total combustion (equation 12), the main products being CO2 and H2O, as the CO and H2 selectivities are lower than at 525 oC. However, at temperatures above about 525 oC the main products of partial oxidation were CO and H2.
Fig. 3. The effect of temperature in the partial oxidation of methane on Co/Ni = 0.75, CH4/O2 ratio = 2 and GHSV = 30,000 ml/gcat.h, Solid lines =
simulated;Dashed lines = experiment.
These experimental results could be explained through the two step mechanism for the partial oxidation of methane. According to this mechanism, in the first stage combustion of methane occurs, producing CO2 and H2O. In the second step, synthesis gas is produced via carbon dioxide and steam reforming reaction. This result is in agreement with previous works [14-16]. Their works stated that the mechanism for the partial oxidation of methane follow the indirect pathway. The reaction sequence is first methane combustion (equation 12), followed by reforming of the remaining methane by the resultant CO2 and H2O (equations 13 and 14).
CH4 + 2 O2 <===> CO2 + 2 H2O ΔH = -191.8
kcal/mole (12)
CH4 + H2O <===> CO + 3 H2 ΔH = 49.2 kcal/mole
(13)
CH4 + CO2 <===> 2CO + 2H2 ΔH = 59.1 kcal/mole
(14)
CO + H2O <===> CO2 +H2 ΔH = -9.8 kcal/mole
(15)
IV. CONCLUSIONS
The optimization of the production of hydrogen from methane using fixed bed reactor process could be accomplished using statistical methods. The present study has shown that response surface methodology can be successfully used to optimize the hydrogen production. The use of central composite design allowed fitting the experimental data to second order polynomial expression that could predict the CO selectivity, hydrogen selectivity and methane conversion as a function of the most significant variables. ANOVA confirmed the adequacy of the second degree polynomial equation to represent the data.
From the analysis, all the three variables identified and included in the experimental design have significant effects on the reaction process. The obtained equations were plotted as contours. The optimal values for CO selectivity of 39.0 % are: Co/Ni (X1) = 0.73; Temperature (X2) = 565 oC; CH4/O2 (X3) = 1.95. The corresponding optimum values for maximum hydrogen selectivity of 47.5 % are 0.87, 560 oC and 2 while for maximum methane conversion of 94.8 % are 0.8, 572 oC and 1.8..
REFERENCES
[1] J.R. Rostrup-Nielsen, ―Production of Synthesis Gas‖. Catalysis Today 1993; 18:305-324.
[2] W.-S.Dong, H.-S.Roh, K.-W.Jun, S.-E. Park and Y.-S. Oh, ―Methane Reforming over Ni/Ce-ZrO2 Catalysts: Effect of Nickel Content‖Appl.
Catal. A 226, 63, 2002
[3] T. Takeguchi, S.-N.Furukawa, M. Inoue and K. Eguchi, ―Autothermal Reforming of Methane over Ni Catalysts supported over CaO-CeO2
-ZrO2 Solid Solution‖ Appl Catal. A 6330, 1-11, 2002
[4] A.L. Larentis, N.S. de Resende, V.M.M. Salim and J.C. Pinto, ―Modeling and Optimization of the Combined Carbon Dioxide Reforming and Partial Oxidation of Natural Gas‖Appl. Catal. A 215, 211-224, 2001
[5] N. Mouaddib, C. F. Jantou, E. Garbowski and M. Primet, ―Catalytic Oxidation of Methane over Palladium Supported on Alumina: Influence of the Oxygen-to-Methane ratio‖ Appl Catal A 87, 129, 1992
[6] A.Heitnes, K. Lindberg, S. Rokstad and O.A.Holmen, ―Partial Oxidation of Methane to Synthesis Gas over Rhodium Catalysts‖ Catalysis Today 21, 471, 1994
[7] D.A. Hickman and L.D. Schmidt, ―Synthesis Gas Formation by Direct Oxidation of Methane over pt Monoliths‖Journal of Catalysis. 138, 267-282, 1992
[8] S.C. Tsang, J.B. Claridge, and M.L.H. Green, ―Recent Advances in the Conversion of Methane to Synthesis Gas‖ Catalysis. Today 23, 3-15, 1995
[9] M.A. Pena, J.P.Gomes and J.L.B. Fierro, ―). New Catalytic Routes for Syngas and Hydrogen Production.‖ Appl. Catal. A 144, 7-57, 1996 [10] H.S. Roh, K.W.Jun, W.S. Dong, J.S. Chang, ―Highly Active and
Stable Ni/Ce-ZrO2 Catalyst for H2 Production from Methane‖ Journal
of Molecular Catalysis. A. 181, 137-142, 2002
[11] V.R.Choudhary, A.M. Rajput, A.S. Mamman, ―NiO-Alkaline Earth Oxide Catalysts for Oxidative Methane-to-Syngas Conversion: Influence of Alkaline Earth Oxide on the Surface Properties and Temperature-Programmed Reduction/Reaction by H2 and Methane‖ J. Catal. 157, 576-585, 1998.
[12] E. Ruckenstein and Y.H. Hu, ―Methane Partial Oxidation over NiO/MgO Solid Solution Catalysts‖, Appl. Catal. A. 183, 85-92, 1999. [13] V.R.Choudhary, B.S. Uphade, A.S. Mamman, ―Partial oxidation of Methane to syngas with or without Simultaneous CO2 and Steam
Reforming reactions over Ni/AlPO4‖ Catal. Lett. 32, 387, 1995
[14] H.Y.Wang and E. Ruckenstein, ―Partial Oxidation of Methane to Synthesis Gas over Alkaline Earth Metal Oxide Supported Cobalt Catalysts‖ Journal of Catalysis. 199, 309-317, 2001
[15] J.M. Montegudo, L. Rodriquez, J. Rincon, and J. Fuertes, ―Optimization of the Conditions of the Fermentation of Beet Molasses to Lactic Acid by Lactobacillus delbrueckii‖ Acta Biotechnol. 14, 252, 1994
[16] M.Nele, A.Vidal, D.L.Bhering, J.C.Pinto and V.M.M.Salim, Preparation of High Loading Silica Supported Nickel Catalyst:
Simultaneous Analysis of the Precipitation and Aging Steps― Appl.Catal.A 178, 177-189, 1999
[17] J,A. Cornell, American Society for Quality Control, USA, (1990)., 1990