Philip Nagy
Ross E. Traub
and
*
Shawn Moore
The Ontario Institute for Studies in Education of the University of Toronto
A Comparison of Methods for Portraying
School Demography Using Census Data
Several ways of indexing the demography of a school from Canadian census data were devised and compared. In one comparison, statistics based on the complete catchment area of a school were set against statistics specific to the neighborhoods inhabited by the students actually attending the school. In a second comparison, catchment-area statistics, which were based on the total population in the area, were compared with statistics based on the subpopulation of mothers of school-aged children residing in the area. The results indicate that the methods are not interchangeable, although the degree of discrepancy observed between methods varied with the demographic variable considered. The demography-index-ing methods were also compared for degree of correlation with student achievement in language or mathematics. The demographic indicators obtained using the enrollment method were found to correlate a little more strongly with achievement than the indicators obtained using the catchment area method. All results are merely suggestive, however, pending further study.
On a conçu et comparé plusieurs façons d'indexer la démographie d'une école à partir des résultats du recensement canadien. Dans une comparaison, les statistiques basées sur toute l'aire de recrutement d'une école ont été juxtaposées à des statistiques spécifiques aux quartiers où vivaient les élèves qui fréquentaient l'école. Une deuxième étude a comparé des statistiques basées sur la totalité de la population de l'aire de recrutement et des statistiques basées sur une sous-population de mères d'enfants d'âge scolaire vivant dans l'aire. Les résultats nous indiquent que les deux méthodes ne sont pas interchangeables, bien que le degré de divergence que l'on observe entre les méthodes varie selon la variable démographique à l'étude. Les méthodes basées sur l'indexation démographique ont également été comparées quant à leur corrélation avec la performance langagière et en mathématiques des étudiants. Cette performance entrait dans une corrélation plus élevée avec les indices démographiques découlant de la méthode basée sur l'inscription à l'école qu'avec ceux découlant de la méthode basées sur l'aire de recrutement. Cependant, jusqu'à ce que la recherche soit poursuivie, tous les résultats sont à titre indicatif.
Introduction
This research was undertaken to examine the utility of Canadian census data for understanding differences in school-level achievement. The Canada census takes place every five years. Limited information is collected from, ostensibly, 100% of the population and more detailed information from a 20% sample
(Statistics Canada, 1993). This study is based on data from the 20% sample surveyed in the 1991 census.
Census data offer educators an opportunity to examine the relationship between achievement (or other variables of interest) and demographic data related to language, education, and a host of other socioeconomic variables. They offer the particular advantage of not having to collect the ancillary vari-ables using the education or educational research budget. Such data are useful in understanding variations in achievement and also in allocating resources to schools (Adams & White, 1997; Lee & Loeb, 1995).
From the outset our objectives for this study were strictly limited. We wanted to explore the use of Canadian census data collected in 1991 to con-struct observations on demographic variables for schools. More specifically, we wanted to compare what we thought would be a relatively more difficult, more laborious, and more costly way of doing this with what we believed would be a relatively less difficult, less demanding, and less expensive way, making the comparison both in terms of process and in terms of equivalence of outcomes for schools.
We wanted to see if choice of method for constructing demographic vari-ables had any effect on the relationship subsequently observed between the census variables and available measures of school achievement. It was our intention to pursue these objectives in two settings: one big city/urban, the other small town/rural. We hoped to test our expectation that urban and rural districts would differ in the types of demographic variables found related to achievement test results. For example, large numbers of immigrants can be found in some urban schools, requiring ESL classes. Rural schools are frequent-ly small and distinguished by limited resources, but second language is rarefrequent-ly an issue. A s well, the urban and county districts provided a contrast in the relationship of census data to schools through the postal code system. In urban areas the ratio of postal codes to school catchment areas is many to one, whereas in rural areas the ratio is one to one or one to several.
In the course of our work we were forced to modify these objectives some-what. Before considering how, we pause here to outline the methods we at first set out to compare.
The school catchment area method. We thought this method would be relative-ly less difficult, laborious, and costrelative-ly to implement. The demography of the residents of the school's catchment area is taken to represent the demography of the families of the students attending a school. The assumption underlying this method is invalid to a greater or lesser degree for such reasons as (a) the presence of childless, older citizens in the catchment area, (b) the operation of special programs that bring additional students into the school or take them out of the school, and (c) the adoption of an open-boundaries policy under which students can attend schools other than those nearest their homes.
When we began this work we held the belief that the enrollment method would necessarily and in general produce better demographic indices for schools than the catchment-area method.
Data from the 1991 Canadian census are available at the level of enumera-tion areas (EAs), which are defined for federal elecenumera-tion purposes and include about 250 households. In an urban setting the catchment area for a school includes parts or all of several, perhaps as many as 10 EAs. These E A s are linked to schools through the postal code system, provided by the Postal Code Conversion File (PCCF). The difference between our two initial methods of indexing demographic variables for schools can be described as follows: a reliance on the census data for the E A s of all the postal codes partly or entirely within a school's catchment area versus a reliance on the census data for the EAs of the postal codes of the students attending the school (weighted by numbers of students from each EA). There might be either more or fewer postal codes associated with the enrollment method compared with the catchment method—more if the school draws from a larger area than its o w n boundaries, and fewer if the catchment area includes regions with no children in residence. In urban communities the areas defined by postal codes tend to be smaller than EAs. In rural communities, however, several EAs, and sometimes more than one school, often share a single postal code. The area spanned by a rural postal code can be large and encompass rural delivery routes and subdivisions with only centralized postal pick-up. Thus the connection from schools to census data through postal codes is probably less firm for rural schools than for urban schools, especially at the elementary level.1 The advantage in terms of difficulty, labor, and cost suggested earlier for the catchment-area approach over the enrollment approach is less likely to be realized in rural than in urban settings, at least at the elementary level from which our sample was drawn.
A second alternative to simple catchment area statistics was prompted by the realization that communities are often populated in a generational way. For example, older and now childless residents who moved into an area some years ago may have substantially different demographics than younger, recent arrivals who have children. A s an alternative to basing catchment-area statis-tics on the whole of the census population in an area, we had Statisstatis-tics Canada produce statistics based on the population consisting of mothers with children in the age range 6-14 years. This population is referred to subsequently simply as mothers.
separate census data by religion, we did not. Doing so is as costly as the isolation of data from mothers.
Obtaining statistics pertaining to mothers is relatively costly because these statistics derive from a cross-tabulation of the raw census data for the E A s of school catchment areas. To ensure the confidentiality of the data, this cross-tabulation can be done only by Statistics Canada staff. Budget restrictions forced us to limit this part of the study to a few (20) schools.
Once in possession of demographic indicators for the schools, we were able to address a subsidiary objective, stated here in question form: Is the strength of the relationship observed over the schools of a district between the demographic variables and the measures of student achievement affected by the method used to obtain the demographic indices for schools?
This question was addressed for the catchment-area and enrollment meth-ods of indexing school demography using demographic and achievement data for 123 (of the 127) schools of an urban district. For cost reasons demographic and achievement data were available for just 20 schools in comparing the demographic statistics based on the catchment area method for total popula-tion with that for mothers only. The 20 schools were chosen randomly, 12 from the urban district, and eight from the larger set of 39 schools in two of the three rural districts that had agreed to participate in the study. The schools of the third rural district could not be included due to difficulties encountered in obtaining the requisite postal code data in a timely fashion.
Perspective
Before taking a detailed look at procedure and results, we offer a brief perspec-tive on this work. The rationale for undertaking it at all is two-pronged. First, informed discussion of the educational assessment results for a school can be promoted by the ready availability of statistics on the demography of the populace served by the school (White, 1982; Willms, 1992). Second, the collec-tion of demographic informacollec-tion is costly and time-consuming, even for those school districts with the resources and staff to do it, and most smaller districts do not possess either the means or qualified personnel. In addition, collection of such data runs the risk of charges of invasion of privacy and the risk of inaccuracy (if one assumes that people w i l l be more accurate in responding to a census worker than in filling out a school questionnaire). Census data repre-sent a resource that, if it can be tapped efficiently and cost-effectively, would make it possible for any interested school system to obtain school-linked demographic data.
To preserve the confidentiality of the data collected during a census, it is not possible to extract individual data from census files; consequently, our focus had to be on the school. Both Goldstein (1987) and Willms (1992) dismiss aggregate (only) data as largely uninteresting. This would seem to condemn our efforts from the start, although Willms does allow that aggregate data have limited usefulness. We have persisted because of the enormous difference in cost and ease of availability of census data compared with any other data a school system might collect. Census-based information is accessible and affor-dable to school districts with limited resources, and to those who choose to be noninvasive of their parents' privacy. In addition, we note that virtually all of the extant literature is set in the United States or Britain, countries where, it seems, the widespread collection of personal data on students' families by school officials is more accepted than here in Canada.
The prevailing methodology for studying school effectiveness calls for the adoption of longitudinal designs to assess the effect of school on achievement (Willms, 1992). A s our primary purpose was to study the feasibility of extract-ing demographic information from census files and evaluatextract-ing its quality, we felt it unnecessary to employ a longitudinal design; any advantage of one of our methods relative to another would be available to researchers using either a one-time or a longitudinal design.
On a slightly related theme, however, we note the difficulties presented by the collection of census data only every five years. Unless one is willing and able to work with achievement data only from census years, researchers will always introduce some level of error because they must work with data from different sources spread over few years. In this study, we were forced to work with achievement data from three different years, not including the actual census year, 1991. The amount of error introduced by this problem in the present study is acknowledged but unexplored.
Method Data
The data were obtained from two sources, a large, urban, public (non-Roman Catholic) school district with 127 elementary schools, and three small, county public school districts with a total of 46 elementary schools. Two kinds of school districts were deliberately chosen for the contrast they furnish in means of access to the required data. The catchment areas of the schools of the urban board were defined in lists of postal codes, whereas the catchment areas of county schools were defined by boundaries drawn by hand on census maps.2
The postal codes of students were supplied in computer files from the central offices of the urban district and two of the county districts. Achieve-ment test results were available in computer files from the central office of the urban district; the county districts granted us permission to approach the publisher/administrator of the commercial tests administered in district schools for records of results. A criterion used in originally selecting these rural districts was that they administer the same standardized achievement tests to the same grade.
electronic files available in the library of our university. Data for the com-parison of total population versus mothers methods had to be produced by Statistics Canada.
The census data were processed to yield the following demographic in-dicators for all schools:
• Percentage of population for w h o m English was the language spoken at home;
• Percentage of population who had immigrated to Canada within three years of the census;
• Percentage of those over age 1 who had not moved residence in one year or more;
• Percentage of those over age 15 who had not graduated from high-school; • Percentage of those over age 25 who were employed;
• Percentage of single-parent families; • Mean family income.
The achievement data were the scores on tests of language and mathematics earned by students in grades 3 and 6. In the urban district the tests had been developed by district personnel, and administered during the 1992-1993 school year (mathematics) or the 1993-1994 school year (language). The tests ad-ministered in the rural districts were standardized instruments from a commer-cial publisher and had been administered during the 1996-1997 school year.
Analysis
Simple bivariate scatterplots (and the Pearson correlation coefficients pertain-ing thereto) were used to study the relationships between school-level vari-ables that had been observed in different ways. In addition, the difference in the coefficient values produced by the different methods were obtained for each school and studied to see (a) whether for each index the mean of the distribu-tion of these differences over schools was significantly different from 0, and (b) whether there was any consistency to the rank-order of schools by magnitude of difference for different demographic indices. Finally, the relationships of demographic variables to school achievement measures were studied using Pearson product-moment correlation coefficients.
Results
Catchment-area indices versus enrollment indices. Figures 1 and 2 represent the results of the comparison between the enrollment and catchment methods of calculating two census variables. The indices based on the enrollment method are presented on the Y axis, and those based on the catchment area method are presented on the X axis. Each point in a plot represents one of the 123 urban schools to which the indices being compared pertain. As an aid to interpreta-tion, both plots contain the equality line for indices from the two methods.
In considering the results displayed in Figures 1 and 2, attention should be focused on three features of the plots: the extent to which points are con-centrated along the equality line, the extent to which points depart from the equality line, and the extent to which outliers are apparent.
30 40 50 60 70
Catchment Area Method
Figure 1. Percentage of recent immigrants.
Recent (within three years) Immigrants M o v i n g into the Area. The enrollment method is seen to yield slightly larger percentages than the catchment area method, particularly among schools with fewer than 50% immigrants as deter-mined by the catchment area method. As regards the two schools in this Figure identified as outliers, G and H , the administrative personnel of the school district w h o m we consulted offered no explanation for the location of School G ,
75 85 95
Catchment A r e a Method
but identified School H as "very small." We have not investigated size-related issues of error, but School H flags a potentially important problem.
The plot for the variable "Percentage speaking English at home" is not shown as it parallels Figure 1 (with a correlation coefficient of 0.92). Worthy of note, however, is that this plot did include an outlier different from those in Figure 1. This outlying school was described by officials of the school district as "inner-city, serving many refugee children."
Examination of the plots for two other variables, also not shown, revealed patterns similar to that displayed in Figure 1. The correlations for "Percentage lacking high-school graduation" and "Percentage over age 25 employed" were 0.90 and 0.88 respectively. In both these plots a particular school appeared as an outlying point. This school was described as serving a large group of special education students, most of w h o m were transported to the school by bus.
A second pattern of relationship between the estimated demographics of a school using the catchment area and enrollment methods is displayed in Figure 2. The variable here is "Percentage who have not moved within a year." The plot for this variable is clearly not concentrated along the equipercentage line. The statistics produced by the catchment area method show less moving of residence than those produced by the enrollment method. This is probably because parents are generally younger and less settled than nonparents, and more likely to move.
The plot for "mean family income," not shown, reveals a pattern of rela-tionship similar to that seen in Figure 2. Mean family income estimates are systematically higher for the catchment area method than for the enrollment method. The reverse conclusion holds for the variable "percentage of single-parent families," with enrollment statistics generally larger than catchment area percentages. This partly reflects the truism that children tend to come from neighborhoods with parents, including single parents. That is, catchment areas include older neighborhoods with fewer children and therefore parents (single or otherwise), whereas enrollment statistics by definition are drawn more from areas with more children. Some schools appear consistently in these plots as outliers.
A n investigation was made of the distributions of differences between the statistics produced by the catchment area and enrollment methods for the seven demographic variables. Box-plots of these distributions are displayed in Figures 3 and 4. The means and standard deviations of these distributions, together with coefficients of intercorrelation, are presented in Table 1. The means of all but one of these distributions—that for "Percentage of Population over 15 with no H i g h School Diploma"—are significantly different from 0, although none of the mean differences for the variables defined as percentages is large in absolute terms. Mean family income is substantially larger on average when based on the catchment area instead of the enrollment method.
One Parent Fam. —
Employ. Rate —
No H S Diploma —
Recent Move —
Immigrants —
English at Home —
* * *
- O hmm—
{J}- *
H D —
— d r — *
— [ f c ] —
-40 -30 -20 -10 0
Percentage Difference
i i r 10 20 30
Figure 3. Box plots of distributions of differences in percentages for six demographic variables on 123 schools, catchment method—enrollment method.
of boxes with respect to the mid-line is in keeping with this general pattern. Consistent with these differences are the smaller percentages (on average) of recent immigrants, of residents over the age of 15 lacking a high-school diploma, and of one-parent families associated with the catchment area meth-od than the enrollment methmeth-od.
The coefficients of correlation among the differences between the catchment area and enrollment methods for the seven demographic variables over the 123 schools, as reported in Table 1, are for the most part significantly different from
Mean Family _ Income
-10000 10000 20000
Dollar Difference
30000 40000
Table 1
Means and Standard Deviations of Distributions of Differences Between Catchment A r e a and Enrollment B a s e d Statistics for S e v e n Demographic
Variables, and Intercorrelations* Among the Variables
Mean StDev Variable
1 2 3 4 5 6
% of English Speakers 1.3 4.8 % of Recent
Immigrants - 1 . 3 3.6 - 8 3 % Not Moving
Residence Last
Year 2.4 3.6 56 -50
% No H-S Diploma -0.6 2.8 - 2 3 16 00
% Employed 0.5 3.0 - 1 3 18 - 2 0 -40
% One-Parent
Families -3.7 6.0 - 1 0 09 -14 28 -26
Mean Family Income 4,300 6,200 50 -46 51 -46 24
"Intercorrelations are multipled by 100.
0. They also carry the algebraic signs we would expect them to have given their definition. For example, the largest correlation coefficient (in absolute terms) is -0.8—one would expect it to be negative—between the difference in percentage of English-speakers at home and the difference in percentage of recent im-migrants. A m o n g the next largest set of correlations (in absolute terms) is that between "the percentage who have not moved residence in the last year" and "mean family income" (r=0.5).
The results we obtained for the catchment area and enrollment methods convey a mixed message. It appears that schools are rank-ordered similarly on several demographic variables by the catchment-area and enrollment methods. Nevertheless, the enrollment method produces results that differ from those for the catchment area method by a statistically significant, albeit relatively small, amount—small at least for all variables save mean family income. This suggests that the enrollment statistics possess greater validity than the catchment area statistics for describing the demographics of the schools.
Catchment-area indices—Whole population versus subpopulation of mothers. Figures 5 and 6 represent the kinds of results found for the 20 schools—12 from the urban district, 8 from two rural districts—in the comparison of statistics based on the whole population and the population of mothers. In these plots the index based on the population of mothers appears on the Y axis, and that based on the whole population appears on the X axis. The points for the schools have been labeled U (urban) or R (rural). Each plot also contains the equal-per-centage or equal income line for reference purposes.
2 <D "5 c o "O CD Co m
100 —
90 — 80 — 70 — 60 — 50U - Urban School
R - Rural School
u y
Equal Percentage Urn
I
50
~~T~
60 70
" T " 80
~ r
90 100
Based on Total Population
Figure 5. Percentage speaking English at home.
Figure 5, "percentage speaking English at home," reveals an expected urban-rural difference. This urban-rural split resembles that found in the plot (not shown) for "percentage of recent immigrants." In the urban center we studied, the population of mothers of young children were somewhat less likely to speak English at home than were members of the general population. Figure 6, "percentage who have not moved for one year," reveals a slight tendency for mothers to move more frequently than members of the general population, regardless of whether they live in urban or rural setting. Of note
100 —
¡2 90 CD O 5 c o •o CD m 80 70 —I
U - Urban School r • y y
R •
R - Rural School y y y
r • y
•Vfi \
•Vfi \
• •y • \u
•
y U \
u
•
y y u . u \ yy
ï *
R
% \
y
• \
y Equal Percentage Lkw
y
•
/ - R
S • U • U
I
70 80 90 100
Based on Total Population
regarding Figure 6 is the relatively large scatter, reflecting a low correlation.
The plot for "percentage over age 25 employed" resembles Figure 6.
We produced plots comparing three other statistics for the population of mothers with the corresponding statistics for the population at large. These plots (not presented) show a strong tendency over the 20 schools that were
studied (a) for the percentage of mothers with a high school diploma to be larger than the corresponding percentage for the general population, (b) for the
percentage of mothers with low incomes to be larger than the percentage for the population at large, and (c) for the proportion of single mothers to be larger than the proportion of single parents in the population at large. N o clear pattern of urban-rural differences can be seen in any of these three plots.
The comparison of mother-based and population-based demographic in-dicators revealed differences in several plots. These differences were not com-pletely unexpected in view of the role mothers usually play in parenting children and the effect this has on mothers' employment, earning power, and, when marriages or other relationships break down, their living arrangements. What remains to be considered is the extent, if any, of the difference in correla-tion between these indices and scholastic achievement. We turn to this quescorrela-tion next.
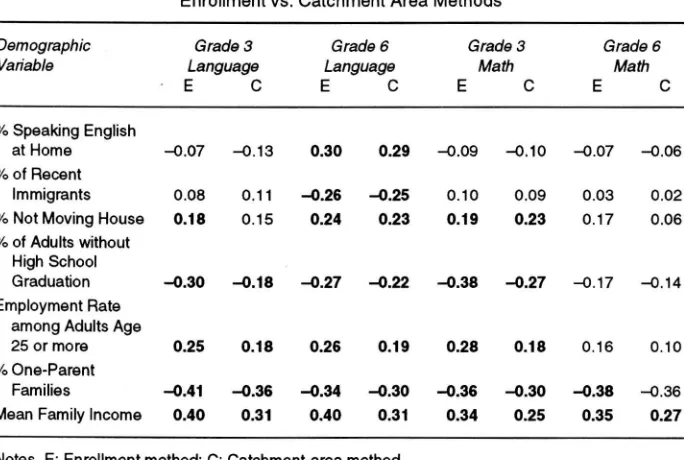
Association with school achievement indicators. Coefficients of correlation were computed, using school as the unit of analysis, between the means of student
Table 2
Coefficients of Correlation between Measures of Language or Math Achievement and S e v e n Indices of School Demography
for 123 Urban Schools
Enrollment vs. Catchment A r e a Methods
Demographic Grade 3 Gradeó Grade 3 Gradeó Variable Language Language Math Math
• E C E C E C E C
% Speaking English
at Home -0.07 -0.13 0.30 0.29 -0.09 -0.10 -0.07 -0.06
% of Recent
Immigrants 0.08 0.11 -0.26 -0.25 0.10 0.09 0.03 0.02
% Not Moving House 0.18 0.15 0.24 0.23 0.19 0.23 0.17 0.06
% of Adults without High School
Graduation -0.30 -0.18 -0.27 -0.22 -0.38 -0.27 -0.17 -0.14
Employment Rate among Adults Age
25 or more 0.25 0.18 0.26 0.19 0.28 0.18 0.16 0.10
% One-Parent
Families -0.41 -0.36 -0.34 -0.30 -0.36 -0.30 -0.38 -0.36
Mean Family Income 0.40 0.31 0.40 0.31 0.34 0.25 0.35 0.27
Notes. E: Enrollment method; C: Catchment-area method. Each correlation is based on observations for 123 schools.
scores on tests of language or mathematics achievement and each of the seven demographic indicators we studied. In the comparison of the enrollment ver-sus catchment area indicators of demography, the study involved an urban school district for which we had achievement data at each of grades 3 and 6. The correlation coefficients are presented in Table 2.
Regarding Table 2, we note that the coefficients are at best of moderate magnitude (absolute values). This is to be expected in view of previous find-ings on the relationship between scholastic achievement and demographic variables at the school level (White, 1982; Willms, 1992). We also note that the direction of the correlation is for the most part what we would expect, and for five of the seven indicators consistent across both grades, both achievement domains, and both methods of indexing the demographic variable. The incon-sistent indicators are percentage speaking English at home and percentage of recent immigrants.
Close study of Table 2 shows that most of the correlation coefficients for the enrollment method are larger in absolute value than the corresponding correla-tion coefficients for the catchment-area method. Having made this observacorrela-tion, we computed the distribution of differences between the correlation coeffi-cients for the two ways of indexing each of the demographic variables. These differences were viewed from two perspectives—that of a signed difference between correlation coefficients (rE - rc) and that of an unsigned (absolute) difference ( I r E - r c I).
Figure 7 contains summaries of the two distributions of differences between the 28 pairs of correlation coefficients presented in Table 2. As Figure 7 reveals, the distribution of signed differences is slightly more variable than the distribu-tion of differences in absolute values, and the distribudistribu-tion of differences in
0.1 —
E
I
S c 111
0.0
-0.1 —
Difference in Signed fs
(Eactiboxp(o«i3b»Mdonth9<ai«fBoce5b«twe8n28 paira of correlatoci
Difference in Absolute Values of r*s
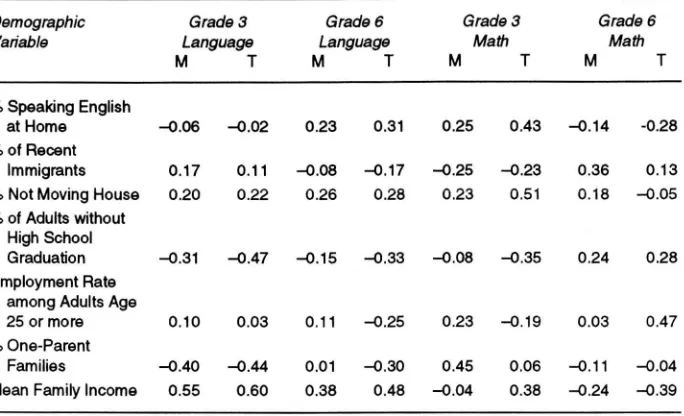
Table 3
Coefficients of Correlation between Measures of Language or Math Achievement and S e v e n Indices of School Demography for a Sample of
Urban Schools
Catchment-Area Methods: Total Population (T) vs. Subpopulation of Mothers (M)
Demographic Grade 3 Gradeó Grade 3 Gradeó Variable Language Language Math Math
M T M T M T M T
% S p e a k i n g English
at H o m e - 0 . 0 6 - 0 . 0 2 0.23 0.31 0.25 0.43 - 0 . 1 4 -0.28
% of Recent
Immigrants 0.17 0.11 - 0 . 0 8 - 0 . 1 7 - 0 . 2 5 - 0 . 2 3 0.36 0.13
% Not Moving H o u s e 0.20 0.22 0.26 0.28 0.23 0.51 0.18 - 0 . 0 5
% of Adults without High S c h o o l
Graduation - 0 . 3 1 - 0 . 4 7 - 0 . 1 5 - 0 . 3 3 - 0 . 0 8 - 0 . 3 5 0.24 0.28
Employment Rate a m o n g Adults A g e
25 or more 0.10 0.03 0.11 - 0 . 2 5 0.23 - 0 . 1 9 0.03 0.47
% One-Parent
Families - 0 . 4 0 - 0 . 4 4 0.01 - 0 . 3 0 0.45 0.06 -0.11 - 0 . 0 4
M e a n Family Income 0.55 0.60 0.38 0.48 - 0 . 0 4 0.38 - 0 . 2 4 - 0 . 3 9
Note. E a c h language correlation is b a s e d on observations for 12 schools, and e a c h math correlation is b a s e d on observations for 10 schools.
absolute values has a slightly larger median than the distribution of signed differences. This result would be expected if it were believed that demographic indicators are predictive of scholastic achievement and that the enrollment method yields indices that more faithfully describe the population of students served by a school than the catchment area method.
A similar argument would lead us to expect demographic indices based on mothers alone to be more representative of the students in a school than those based on total population of the school's catchment area. This in turn would lead us to expect mother-based demographic indices to correlate more strongly with achievement than total-population-based indices. Tables 3 and 4 contain results for the two samples of 12 urban and eight rural schools. (The two samples had to be separated because the achievement tests used in the two settings were different.)
Table 4
Coefficients of Correlation between Measures of Language or Math Achievement and S e v e n Indices of School Demography for a Sample of
Rural Schools
Catchment-Area Methods: Total Population (T) vs. Subpopulation of Mothers (M)
Demographic Grade 4 Grade 4
Variable Language Math
M T M T
% S p e a k i n g English at Home - 0 . 2 0 0.04 - 0 . 1 3 - 0 . 0 6
% of Recent Immigrants 0.55 0.71 0.65 0.51
% Not Moving H o u s e - 0 . 2 6 -0.31 0.13 0.04
% of Adults without High S c h o o l Graduation 0.15 - 0 . 5 5 0.16 - 0 . 4 0
Employment Rate a m o n g Adults A g e 25 or more 0.69 0.49 0.64 0.62
% O n e - P a r e n t Families 0.16 0.21 - 0 . 0 2 0.01
M e a n Family Income 0.81 0.61 0.85 0.59
Note. Each correlation is b a s e d on observations for eight schools.
Conclusions
Catchment area demographic statistics cannot in general be substituted for enrollment demographic statistics.
The enrollment method produced results that varied in degree of agreement with the corresponding results derived from the catchment area method. For some variables—for example, percentage of the populace speaking English at home—a high correlation was observed between the values from the two methods. For other variables—for example, percentage of the populace who had not moved recently, percentage of single parent families, and mean family income—the two methods produced somewhat different index values. The differences between the methods, although small for most schools, are statisti-cally significant over all schools, suggesting that statistics based on the catch-ment area approach are not as valid as those based on the enrollcatch-ment method. Surprisingly, given our a priori expectations, the catchment area and enroll-ment methods of index production did not differ greatly in effort and cost of production in the urban context. This was because in the present case the urban school district could supply computer lists of postal codes, both for school catchment areas and for students' home addresses. This conclusion would differ for districts where postal codes are unavailable in computer files.
negotiat-ing power that a large organization might brnegotiat-ing to discussions with data providers.
Our evidence regarding catchment area statistics on the total population versus comparable statistics on the subpopulation of mothers is inconclusive.
Degree of congruence between indices based on these two methods varied considerably across demographic variables. The most highly congruent results for the seven variables and 20 schools we studied occurred for the percentage of the population speaking English at home and the percentage of recent immigrants. The least congruent results were for the percentage of adults who had not graduated from high school. (The latter result is readily explained by the fact that younger people tend to have more education than older people.) Again, however, we can offer no basis for a priori classification of demographic variables by degree of congruence between total-population-based and mothers-based catchment area statistics.
As regards practicalities, we found it considerably more difficult to produce statistics on rural schools than urban schools. The principal reason in our context was ready availability of relevant computer files in the urban setting. Added costs were also incurred in producing readings for demographic vari-ables from data on the subpopulation of mothers, making this a less attractive method both for research and accountability purposes. One should note, how-ever, that our view of the costs of purchasing "special runs" from Statistics Canada is colored by the fact that this was a relatively low-budget project. Presumably provinces and large school districts would have more negotiating power.
The correlational study of demographic variables and achievement produced suggestive results.
The absolute values of correlations between achievement and enrollment-based indicators were slightly larger than those with catchment-enrollment-based in-dicators, although the difference was not statistically significant. Of the 28 comparisons between methods that can be made from the data in Table 2, 24 favor the enrollment method. Almost all these differences taken one at a time are trivial, but as a pattern the results are at least suggestive.
We also computed correlation coefficients between measures of achieve-ment and either of two versions of catchachieve-ment-area-based indicators, one based on the total population and the other based on the subpopulation of mothers. Nothing can be concluded from these coefficients, however, for they are based on extremely few schools. More work is needed before anything definitive can be said about the differential validity of the two catchment area approaches in relation to school achievement.
Notes
'Large rural district high schools, not part of this study, still draw from rrfan y different postal codes and EAs, especially in sparsely populated areas.
The latter task was accomplished with the assistance of the bus supervisor for each county dis-trict, as this individual knew exactly which areas of the county fed students to each school.
References
Bryk, A.S., & Raudenbush, S.W. (1992). Hierarchical linear models: Applications and data analysis methods. Newbury Park, C A : Sage.
Garner, C.L., & Raudenbush, S.W. (1991). Neighborhood effects on educational attainment: A multilevel analysis. Sociology of Education, 64,251-262.
Goldstein, H . (1987). Multilevel models in educational and social science research. New York: Oxford University Press.
Knapp. T.R. (1977). The unit of analysis problem in applications of simple correlation analysis to educational research. Journal of Educational Statistics, 2,171-186.
Lee, V.E., & Loeb, S. (1995). Where do Head Start attendees end up? One reason why preschool effects fade out. Educational Evaluation and Policy Analysis, 17,62-82.
Statistics Canada. (1993). 2991 Census of Canada: Data documentation for theprofile series—Part B. Ottawa: Supply and Services Canada.
White, K.R. (1982). The relation between socioeconomic status and academic achievement. Psychological Bulletin, 92(3), 462-481.