Developing Testing Plant and Methods for Water
Processing and Control for Thermal Power
Stations
M.K.L. Bhatti
1, B.M. Larin
2, A.B. Larin
2, and W.Q. Awan
2 1-NFC IET Multan (Pakiatan) 2- ISPU Ivanova (Russia)Abstract-- In this paper we discussed about establishment of an experimental filter plant which combine 3 different filtration techniques and used for testing of ionite material and instruments used for process control. Also discussed a calculating method used for determining the concentration of different minerals at different stages of filtration.
I. INTRODUCTION
The analysis of references [1] shows that offers on perfection of demineralization technology at thermal power stations (TPS) can be divided waters into following groups:
Optimization of chemical demineralization technology on the basis of the operating installations, directed on reduction of the charge of reagents and drains;
Development of demineralization plants on the basis of counter flow filters and methods (technology UPCORE and so on);
Development of demineralization plants on the basis of membrane technology;
Creation of low – wasted technologies on the basis of thermo-chemical methods.
Approved in 1981 and operating now norms of technological designing of thermal power plants in Russia provide use chemical demineralization of raw water containing anion of strong acids. up to 5 mg-eq/m3.
For the years, characteristics of back osmosis membranes have sharply improved. New technologies with repeated use of regenerating solutions have essentially affected economy of thermal methods of water-preparation.
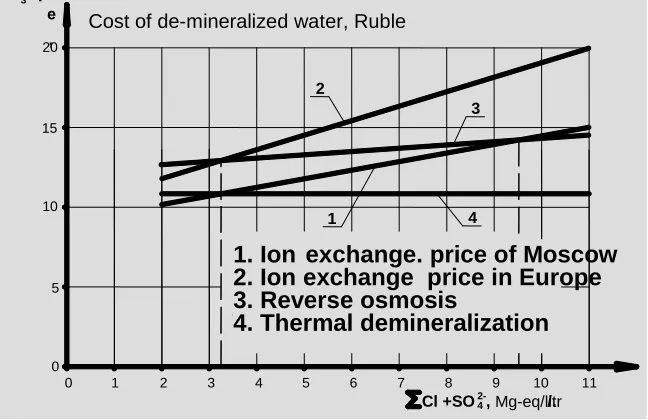
In the given work expense’s comparison of ion – exchange, thermal and reverse osmosis demineralization superficial water [2] is resulted.
Graphic interpretation of analysis results for raw waters with various salt concentration is presented on fig.1. In fig. line (4) describing net cost of de-mineralized water at application of evaporators with repeated use of sewage in a cycle of regeneration. Advantages of such technology appreciable for natural waters of average and high mineralization (ΣАс=[Cl–] + [SO42–]>3 mg-eq/litr.).
Fig. 1. Results of analysis for raw waters with different salt concentration
Comparison for this mineralization, ecological efficiency of ionic exchange and membrane technologies shows significant advantage of reverse osmosis plant[2]. For natural waters of the center and the north of Russia with a small mineralization
(ΣАс< 3 mg-eq/litr.) the most economic is chemical demineralization method.
Testing Filtration Plant
For studying perspective ionite technologies in laboratory of chemistry department of Ivanovo state power university
0 1 2 3 4 5 6 7 8 9 10 11
0 5 10 15 20
C
стоимость обессоленной воды
, руб/ .
3
Cl +SO2- , мг-экв/л.
4
1.Ионный обмен. Цены г. Москвы. 2.Ионный обмен. Цены Запада. 3.Обратный осмос.
4.Термическое обессоливание. 2
3
1 4
water, rub
1. Ion
2. Ion
-
-
exchange. Price of Moscow
exchange. Price of west
3. Back osmosis
4. Thermal demineralization
0 1 2 3 4 5 6 7 8 9 10 11
0 5 10 15 20 е
,
.
3
Cl +SO2- ,Mg-eq/litr/.
4
1.Ионный обмен. Цены г. Москвы. 2.Ионный обмен. Цены Запада. 3.Обратный осмос.
4.Термическое обессоливание. 2
3
1 4
1. Ion
exchange. price of Moscow
2. Ion
exchange price in Europe
3. Reverse osmosis
4. Thermal demineralization
(ISPU) experimental plant is created: working on model of thermo-chemical demineralization of additional water for
boilers. The scheme of laboratory plant is represented on fig.2.
t0 С (а)
(а) pH (а) pNa (а) [Cl-]
H0
A0
pNa (а) H0
t0 С (а)
(а) pH (а)
t0 С (а)
(а)
t0 С (а); (а); pH(а);
ROH HR
E.P NaR
Fig. 2. Basic diagram of water treatment stand with system of chemical control: t0 С (а), (а), рH (а), pNa (а) – chemical monitoring device; H
0, A0, [Cl –
] – operational chemical control indexes
Tap water having quality of clarified water; enter in Na-cationite filter. Filtrate Na-Na-cationite filter is fed to evaporating plant (E.P), and distillate E.P by pump moves on H-cationite filter, and then on OH-anionite.
Thus, the scheme of laboratory stand models thermo-chemical demineralization scheme for boilers of TPS.
Development of Calculation Method
In conditions of modern power technology transition on automatic control systems of thermal –power processes (ACS TP), including subsystems chemical – cycle monitoring system(CMS), important role are played with development of automatic control system of additional water’s
demineralization, realized on the laboratory stand according to fig. 2.
Presented on fig. 2 chemical control contains automatic measurements by devices (t0C, χ, рН, pNa) and laboratory analyses (Hо, Aо [Cl–]). Purpose of the last consists to check methods of quantitative control on the basis of conductivity and рH; a method developed in chemical department of ISPU for monitoring and diagnostics of processes on stages of water treatment.
For initial water the method assumes following mathematical model of ionic balance.
Measuring during adjustment of installation the general hardness (H0), alkalinity (A0), concentration of chlorides, and also temperature and specific conductivity, it is possible to calculate mineralization of waters and concentration of sulfate-ions and ions of sodium by equations (1) – (3).
av SOav HCO о av Cl
о
Cl
A
A
Cl
М
2 4
3
028
,
0
028
,
0
, (1)
av
SO
av
HCO о
av
Cl
A
Cl
SO
2 4
3
028
,
0
48
2
4 , (2)
Na
A
о
Cl
SO
H
о
2
4
0208
,
0
028
,
0
23
, (3)where
avHCO av
SO av
Cl 2 3
4
,
,
– average value (according to Са2+, Mg2+ и Na+) equivalent to conductivity of chlorides, sulfates and bicarbonates, determinate by equations (4) – (6) in range of temperature 15 - 45 °С, typical for water at TPS.
1
0
,
0203
18
0
,
0597
2
1
,
4317
110
,
172
o o
av
Cl
t
M
M
, (4)
1
0
,
0208
18
0
,
195
24
,
095
106
,
61
2
4
o
o
av
SO
t
M
M
, (5)
1
0
,
0201
18
0
,
065
21
,
743
83
,
578
3
o o
av
HCO
t
M
M
where Мо – initial approximate mineralization value of water,
equal 0,01χ, g-eq/litr.
For filtrate NaR - Na-cationite filter, monitoring of cationite exhaustion and switching-off of the filter for regeneration on differential measurement pNa before and after filter is accepted.
Normally, switching-off of Na-cationite filters for regeneration carry out by skipping cation’s hardness in filtrate. For the waters entering in Na-cationite filters with the small
concentration of sodium ion, can be recommended automated control by measurement of a parameter pNa in filtrate. On fig. 3 data of laboratory experiment by automated control of cationite exhaustions in the Na-filter are presented. In experiment the general hardness of water acting on the filter is 2.8 mg-eq/litr. and concentration of sodium – 8 mg/litr. The general hardness (H0) and potential of sodium electrode (ENa) were measured in filtrate. On fig. 3 is presented value ΔЕNa, potential difference between sodium electrode in entering water and in filtrate.
2,5
2
1,5
1
0,5
0 10
20
30
40
50
60 40
50
60
70
80
90
1 2 3 4 5 6 7 8 9 τ, hr.
H0
,
mg
-eq
/l
itr
.
Δ
ЕNa
,
mV
ЕNa
,
mV
3
2
1
Fig. 3. Exhausting control of Na-cationite filter by рNa measurement of filtrate:
1 – Changes in H0 of filtrate by passage of time; 2 – change in ΔЕNa by passage of time; 3 – change in ЕNa by passage of time;
We can see from fig. 3, by measuring pNa of filtrate, can be controlled skipping of cations causing hardness at level of 1,0 mg-eq/litr. Thus concentration of sodium ions in filtrate of laboratory’s Na–cationite filter decreases from 70 to 40 mg/litr.
Quality control of distillate can be executed by measurement of three parameters: χ, рН и χн.
Rated contents of method are those:
After evaporating plant, partially de-mineralized water passes trough H-cationite filter. In this case equations of electro-neutrality (7) and conductivity (8) will look so:
H
EPNa
EPOH
EPHCO
EP
CO
EPCl
EP
2
33
2
, (7)
Cl EP CO
EP
HCO EP OH
EP Na
EP H
EP EP
Cl
CO
HCO
OH
Na
H
3
3
2 3
3
2
1000
(8)
For filtrate of H-cationite filter equation of electro-neutrality and conductivity look like: Equation of electro-neutrality:
H H
H
H
Na
HCO
Cl
H
]
[
]
[
]
[
]
[
3
(9)Equation of conductivity:
Cl H HCO
H Na
H H
H
H
H
Na
HCO
Cl
3
3
In filtrate of H-cationite filter, concentration of sodium ions is much less than concentration of hydrogen ions. Product of ([Na+]нλNa+) is much less than product of ([H
+
]нλH+), since λNa+ << λH+. Then, considering, that at H-cationite filter concentration of chloride ions in water does not change, we shall receive equations (9) and (10) in the form of:
H
HHCO
HCl
EP
3 , (11)
Cl EP HCO H H HH
H
HCO
Cl
3 3
1000
, (12)In system of equations (7), (8), (11), and (12) can be added following equations: dissociation of water
H
OH
k
W
t
, (13) dissociation of carbonic acids on first and second steps
H
HCO
3
k
I
t
H
2CO
3
, (14)
3 2
3
k
t
HCO
CO
H
II , (15)Considering system of equations for water after evaporating plant, including equations (13) - (15), (7) and (8), and for filtrate of H-cationite filter, including equations (13) - (15), (11) and (12), we find, that in 10 equations contains 14
unknown parameters. The system of the equations can be solved by measurement of three parameters, if expand its with equation of material balance for all forms of carbonic acid by cation exchanging of water at H-cationite filter:
HCO
3
EP
CO
32
EP
H
2CO
3
EP
HCO
3
H
H
2CO
3
H . (16)As three measured parameters, it is easy to take specified above conductivity and рH in water after evaporating plant, and also conductivity in filtrate after H-cationite filter.
Calculation of de-mineralized water’s quality index (after OH – filter) can be executed on the same equations, as for partially de-mineralized waters, that is by equations (13) - (15), (7) and (8) under condition of [Cl] →0
Then by indications of conductivity meter and рH-meter working on way of de-mineralized waters, it is possible to calculate quality index of de-mineralized water by equations (17) - (19).
2 33 Na CO
II Na HCO Na Н Na ОН w 3
]
H
[
'
K
2
]
H
[
]
H
[
'
K
1000
]
HCO
[
; (17)
] H [ ] H [ ' K ] H [ ' K 2 1 ] HCO [ ] Na
[ 3 II w
;
(18)
6 I 3 32
CO
]
[
H
]
K
[
HCO
'
]
44
10
H
[
,
(19)
where [H+]=10–pH.
Results of device reading and calculations are presented here for example.
Table I
Measurements and calculation results of de-mineralized water’s quality at evaporating plant
Device reading Calculation results
рН χ,
µS/cm χНб , µS/cm
[Na+] + H0, µg-eq/litr.
[HCO3 -], µg-eq/litr.
СО2, mg/litr.
[Cl-], mg/litr.
distillate of evaporating plant 5,9 5,26 5,18 5,98 3,12 3,92 7,5 4,1 4,6 63 13 19 48 15 17 68 9,2 10,7 0,57 0,14 0,3 After demineralization at Н-ОН-filters
7,0 7,4 7,2 0,39 0,37 0,43 - - - 3,9 3,6 4,4 4 4 5 0,038 0,013 0,030 - - - CONCLUSION
REFERENCES
[1] Larin B.M., Bushuev E.N., Bushueva N.V. technological and ecological perfection of water-treatment plants at TPS // Thermal engineering, 2001. № 8
[2] Jurchevskij E.B., Larin B.M. Development, research and introduction of the water-treatment equipment for TPS with improved ecological characteristics // Thermal engineering. 2005. № 10
[3] А.С. USSR № 1248962 Methods of water demineralization [4] Larin B.M., Korotkov A.N., Oparin M.U. Automatic control of
![Fig. 2. Basic diagram of water treatment stand with system of chemical control: t0 С (а), (а), рH (а), pNa (а) – chemical monitoring device; H0, A0, [Cl–] – operational chemical control indexes](https://thumb-us.123doks.com/thumbv2/123dok_us/1384687.1649243/2.612.51.535.476.611/diagram-treatment-chemical-control-chemical-monitoring-operational-chemical.webp)