IJIRT 143784
INTERNATIONAL JOURNAL OF INNOVATIVE RESEARCH IN TECHNOLOGY370
Numerical study of flow over vortex generators
D.Rohit
1, Deelip Wagh
21
MTech Automobile Engineering, VJTI Mumbai
2Project Manager
Abstract— In a vehicle, aerodynamic drag force adversely affects flow and motion of vehicle, which in turn reduces its overall fuel efficiency. If the vehicle is redesigned to optimize its aerodynamic forces it could produce fuel efficiency. Effective way of controlling flow at rear end of vehicle is achieved by Vortex generators which are placed near rear windshield on roof line. With optimized angular placement of vortex generators, flow separation is reduced in automobile, effectively reducing pressure drag and hence improving fuel efficiency
Keywords—Vortex generators, Flow separation control, computational fluid dynamics
I.INTRODUCTION
Over the years starting from year 2000, different OEMs are more focused on improving the vehicle performance and reducing fuel consumption. Average trend for fuel economy shows increment of 0.7kmpl per year. Many OEMs are focusing marketing on fuel economy as their selling point. In a vehicle there are various losses to overcome engine heat loss, auxiliary loss, friction & inertial losses. One of the contributions in loss is Aerodynamic drag which is 5% of overall loss. To reduce aerodynamic loss, one of the proposed to improve the same is vortex generator. To optimize the effectiveness of fuel economy, vortex generator’s specification and its location of placement in vehicle is important.
This paper discusses on how to reduce aerodynamic drag arising at rear windshield of the car in order to improve overall drag coefficient and increasing mileage using same. Computational fluid dynamics help understands flow characteristics around vortex generator. There have been previous studies that corroborate with fact that vortex generator helps in flow control .This is achieved by energizing boundary layer to avoid pressure difference between freestream air and boundary layer.
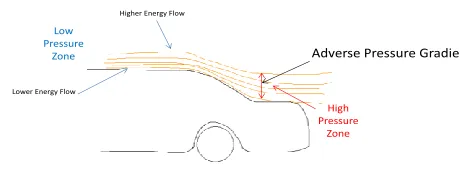
II FlOW SEPARATION AND ITS CONTROL Flow separation occurs mainly when the boundary layer travels against adverse pressure gradient so that its relative velocity is zero. Due to this the flow
separates and eddies are developed. These eddy and vortices manifest as parasitic drag also known as pressure drag. It constitutes of form drag, induced drag and wave drag. One of the primary reasons of flow separation is adverse pressure gradient. Adverse pressure gradient occurs when the static pressure progresses in the direction of the flow.
Since the fluid in the inner part of the boundary layer is slower, it is more affected by the increasing pressure gradient. For considerate pressure increase, this fluid may even become reversed. When flow reversal happens, the flow is said to be separated from the surface. This has very significant effects in aerodynamics since flow separation significantly changes the pressure distribution along the surface and hence the lift and drag characteristics.
III.
I
LLUSTRATION OF FLOW SEPARATION
Figure 1: Flow Separation
Figure 2: Flow separation on rear windshield
Adverse Pressure Gradient Higher Energy Flow
Lower Energy Flow
High Pressure
Zone Low
IJIRT 143784
INTERNATIONAL JOURNAL OF INNOVATIVE RESEARCH IN TECHNOLOGY371
Model Advantages Weaknesses
Spalart-Allmaras
Economical (1-eq.); good track record for mildly complex B.L. type of flows.
Not very widely tested yet; lack of sub-models (e.g.
combustion, buoyancy).
Standard k-ε
Robust, economical, reasonably accurate; long accumulated performance data.
Mediocre results for complex flows with severe pressure gradients, strong streamline curvature, swirl and rotation.
Renormalization Group Method k-ε
(RNG k-ε)
Good for moderately complex behavior like jet impingement, separating flows, swirling
flows and secondary flows.
Subjected to limitations due to isotropic eddy
viscosity assumption. Same problem with
round jets as standard k-e
Realizable k-ε
Offers largely the same benefits as RNG but also resolves the round-jet anomaly.
Subjected to limitations due to isotropic eddy viscosity assumption.
Reynolds Stress Model
Physically most complete model (history, transport, and anisotropy of turbulent
stresses are all accounted for).
Requires more CPU effort (2-3x); tightly coupled momentum and turbulence
equations. The outer boundary layer has higher momentum in
comparison to inner boundary layer. This is because innermost layer has low velocity and outer most layers have highest velocity. Due to this pressure difference, flow tends to move to low pressure region from high pressure region for equilibrium. Due to reverse flow to accomplish equilibrium, flow gets separated.
Since the vehicle height in the rear section becomes lower as the flow moves downstream, an enlarged airflow is created there. This causes the downstream pressure to increase, which in turn creates reverse force acting against the main flow and creates reverse flow at downstream. The prime cause of flow separation is difference between pressure gradients in outer and inner boundary layer.
On vehicle aerodynamic drag force adversely affects flow and motion of vehicle, which in turn reduces its efficiency. If the vehicle is redesign to optimized its aerodynamic forces it could produce better results. Effective way of controlling flow at rear end of vehicle is achieved by Vortex generators.
Systematic aerodynamic study of rear end of vehicle can help to improve its aerodynamics. This is one of the causes of aerodynamic drag and separation of flow at rear end. Various experiments show that VG’s are better to energize boundary layer by mixing some of free stream air and hence delaying the separation which is seen as study goes.
IV.TURBULENCE MODELS FOR CFD ANALYSIS To perform CFD analysis on vortex generator, we need to choose a suitable turbulence model, Turbulence model depend upon nature of analysis and processing power. Turbulence modeling is the
method to predict the effects of turbulence. A turbulent fluid flow has features on many different length scales. A familiar approach is to average the governing equations of the flow, in order to focus on large-scale and non-fluctuating features of the flow.
We have numerous turbulence models, RANS based models are applicable in our case of flow separation investigation, to optimize time required for computing, we select k-e model. Reynolds stress transport model is most complete model but requires higher computing power.To tradeoff between accuracy and time, we select k-e model with realizable wall treatment, which gives us satisfactory accuracy and requires less computing power as compared to RSM
IJIRT 143784
INTERNATIONAL JOURNAL OF INNOVATIVE RESEARCH IN TECHNOLOGY372
• RANS-based models
• Linear eddy-viscosity models
o Algebraic models
o One and two equation models
o k-ε Model
o k-ω Model
o Prandtl's one-equation model
o Baldwin-Barth model
o Spalart-Allmaras model
• Non-linear eddy viscosity models and algebraic stress models
• Reynolds stress transport models
• Large eddy simulations
• Detached eddy simulations and other hybrid models
• Direct numerical simulations
V. TURBULENT FLOW
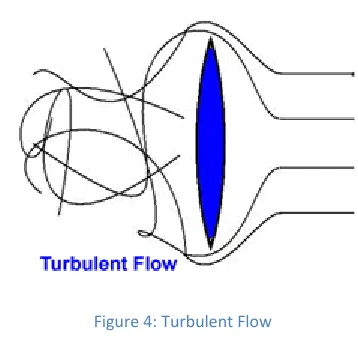
Turbulent flow is a type of fluid flow in which the fluid undergoes irregular variations or mixing, in contrast to laminar flow, in which the fluid moves in smooth course or layers.
In turbulent flow the speed of the fluid at a point is continuously undergoing changes in both magnitude and direction. The flow of wind and sea water is generally turbulent in this sense, even if the currents are gentle.
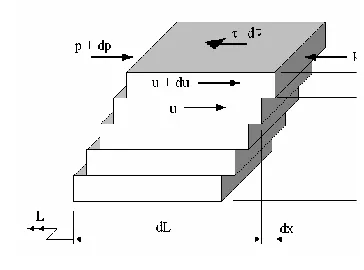
Turbulent flows are made up of two regions:
An inner region near the boundary that is dominated by viscous shear,
i.e.
(1)
And an outer region which is dominated by turbulent shears i.e. transfer of fluid momentum by the movement of the fluid up and down in the flow.
(2)
Where
is the eddy viscosityVI.
W
ORKING OF A VORTEX GENERATOR Passive vortex generator works by creating streamwise vortexes that transfer momentum from outermost layer to inner boundary layer. This energizes inner layer, which reduces the equilibrium point, hence flow separation is delayed and separation point moves further. The shape and angle of attack of flow into vortex generator decides the streamwise vortex and its character.The purpose of adding VGs is to supply the momentum from higher region where has large momentum to lower region where has small momentum by streamwise vortices generated from VGs located just before the separation point. This Figure 4: Turbulent Flow
y
du
dy
y
du
du
dy
dy
IJIRT 143784
INTERNATIONAL JOURNAL OF INNOVATIVE RESEARCH IN TECHNOLOGY373
allows the separation point to shift further downstream. Shifting the separation point downstream enables the expanded airflow to persist proportionately longer, the flow velocity at the separation point to become slower, and consequently the static pressure to become higher. The static pressure at the separation point governs over all pressures in the entire flow separation region. It works to reduce drag by increasing the back pressure. Shifting the separation point downstream, therefore, provides dual advantages in drag reduction: one is to narrow the separation region in which low pressure constitutes the cause of drag; another is to raise the pressure of the flow separation region. A combination of these two effects reduces the drag on the vehicle.
VII.
G
EOMETRY OFV
ORTEXG
ENERATOR In connection with the size, the thickness of the boundary layer is measured based on the assumption that the optimum height of the VG would be almost equal to the boundary layer thickness. The boundary layer thickness at the roof end immediately in front of the separation point is about 30 mm. As to the location of VGs, a point immediately upstream of the flow separation point was assumed to be optimum. The effects of half-delta wing VGs mounted at this point are presented. Consequently, the optimum height for the VG is estimated to be up to approximately 3ated to be up to approximately 20 mm. As to the shape, a bump-shaped piece with a rear slope angle of 10°-20° is selected.The effectiveness of the delta-wing-shaped VG is also examined. The recommended shape of the delta wing- shaped VG is defined by the following: Length/height = 5
Yaw angle = 10°-20° Interval/height = 20mm
VIII.
F
LOW SIMULTATIONS OVER HALF DELTA WINGA CAD model of half delta wing was designed using Unigraphics NX9 , the dimensions and geometry is shown in following :
The geometry of half delta wing is dependent on L/H ratio i.e. 5:1. This geometry gives us appreciable results in CFD as well as simulation softwares. Mesh size was set as 0.1mm and five prism layers were used on vortex generator to capture boundary layer.
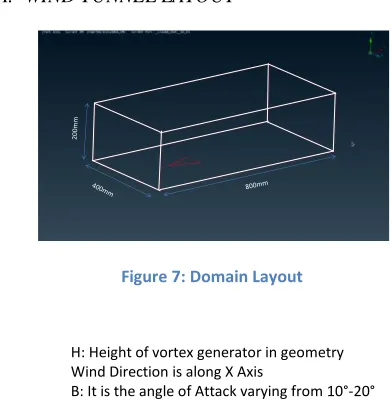
A. WIND TUNNEL LAYOUT
The dimensions of domain is chosen as 800 X 400 X 200mm
Wind tunnel is kept at 22.22m/s and angle of attack is kept as 15°-20°. We obtain favorable results and low drag coefficient of 0.40. On counter rotating the vortex generator we obtain similar results.
IX.
F
LOW VISULIZATIONSThe vortex generator of shape half delta wing was kept in a virtual wind tunnel, which performed a mesh and airflow to simulate flow over it. We observe that on both rotating and co-rotating setup, the drag force and drag coefficient remains almost same.
In all simulation runs the wind speed was set to 31m/s and tunnel layout was kept as shown in above layout. Various angle of attacks i.e. 15°, 10°, 20° were tested for drag force and Cd
Figure 6: VG Geometry
2X20mm 3X20mm
H=2
0m
m
18.4° 26.56°
H: Height of vortex generator in geometry Wind Direction is along X Axis
B: It is the angle of Attack varying from 10°-20°
IJIRT 143784
INTERNATIONAL JOURNAL OF INNOVATIVE RESEARCH IN TECHNOLOGY374
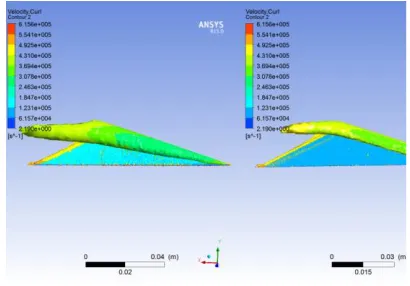
A. 15°& 20° Angle of Attacks : Top ViewComparing the pressure contours of the two
angles of attacks, we see in 15° angle the vortex
core is longer. This is due to higher pressure
difference and circulation around VG is higher
than 20°, when we compare the values i.e.
Average swirling strength between both, we
incur that 15° has higher swirling strength than
20°.
AoA Parameter Location Value
15
Max Pressure VG
219.52
20 204.199 [Pa]
15
Min Pressure VG
-796.30
20 -412.779 [Pa]
B.
15°& 20° Angle of Attacks : Isometric View
k
As seen from above images and table, as seen from above images, circulation for 15° is higher than 20°, but even a small change in vorticity results in change in swirl strength or circulation of the vortex flow, below are the values for vorticity in three axes and their resultant.
Comparing various angles of attacks and their corresponding values we obtain a table suggesting 15° giving us most positive and promising results.
AoA Function Parameter Direction Value
15
Area
Integral Vorticity
Magnitude 308.86 m2/s
X -0.42
Y 4.9
Z -0.02
20
Magnitude 198.47 m2/s
X -0.06
Y 2.39
Z -0.31
Figure 8: Pressure Contour Top View
Figure 9: Pressure Contour Isometric View
IJIRT 143784
INTERNATIONAL JOURNAL OF INNOVATIVE RESEARCH IN TECHNOLOGY375
X. RESULT DISCUSSION
CFD analysis was performed on same geometry, number of iterations was kept at 1000 or convergence and the various parameters for solver setup were:
Boundary Conditions:
• Gauge Pressure : 0 Pa
• Ambient Pressure : 1 Bar
• Inlet Velocity : 22.22 m/s (80kmph)
• No. of iterations : 1000 or convergence
• Turbulence Model : k-epsilon model
• Mesh type : Prism near half delta wing and unstructured tetra mesh in fluid domain
• Domain Size : 800X400X200 mm
• Angle Of Attack : 10,15&20° Wall Conditions
• Half Delta wing : Solid Wall No Slip
• Fluid domain : Free slip at side walls
• Fluid domain inlet :Velocity Inlet
• Fluid Domain outlet : Pressure Outlet
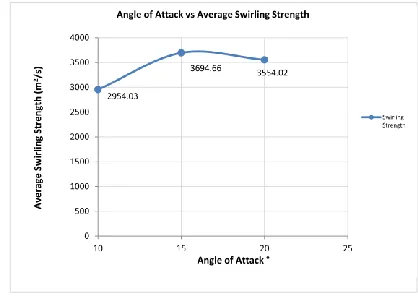
From the above values we can incur that higher the area integral of vorticity i.e. circulation, higher will be the vortex strength. This is indicated in average swirling strength also.
AoA Function Parameter Location Value
10 Average
Velocity. Swirling Strength
VG 2954.03 [s^-1]
15
Average
Velocity. Swirling Strength
VG
3694.66 [s^-1]
20 3554.02
[s^-1]
Above values of swirling strength , which show that for 15° they are higher as depicted by circulation around VG , From this we can conclude that between these two angle of attacks,15° gives us stronger vortex , which in turn delays flow separation by providing inner boundary layer with higher energy.
Above graph shows variance of three angles of attacks and change of average swirling strength, Swirling strength is a function of circulation which in turn is function of vorticity. As stated from previous graph, we find that 15° gives us highest circulation hence it can be said that for a given geometry of vortex generator 15° gives us the highest vortex strength. Higher the vortex strength, higher will be the momentum transferred to inner boundary layer.
Figure 12: AoA vs Average Swirling Strength
Figure 1: AoA vs Swirling Strength
Figure 11: AoA vs Circulation
25.16 308.86
198.47
0 40 80 120 160 200 240 280 320 360
0 10 20 30
Angle of Attack vs Circulation
Ci rc u…
Angleof Attack
°
C
ir
cu
lati
o
n
(m
IJIRT 143784
INTERNATIONAL JOURNAL OF INNOVATIVE RESEARCH IN TECHNOLOGY376
XI. CONCLUSION AND FUTURE WORK
With the help of CFD simulations, we can conclude that for given geometry 15° gives us the maximum vortex strength (circulation), this in turn provides inner boundary layer higher momentum which delays flow separation
Improved aerodynamics results in the enhancement of many factors required with the motion of a car such as fuel consumption and performance. With the decrease in the drag coefficient the fuel consumption can be enhanced as there would be less opposing force acting on the car.
As a result of the verifications, it is confirmed that VGs create stream wise vortices, the vortices mix upper and lower layers of boundary layer and the mixture causes the flow separation point to shift downs, consequently separation region is narrowed. From this, we could predict that VGs cause the pressure of the vehicle’s entire rear surface to increase therefore decreasing drag,
R
EFERENCES[1] Masaru Koike; Tsunehisa Nagayoshi and Naoki Hamamoto. Research on Aerodynamic Drag Reduction by Vortex Generators, technical papers (2004)
[2] Ahmed, H And Chacko, S, Computational Optimization Of Vehicle Aerodynamics, Daaam International (2012)
[3] J. Katz, Race-Car Aerodynamics, Robert Bentley Inc., Cambridge, Massachusetts (2006)
[4] Debojyoti Mitra, Design Optimization of Ground Clearance of Domestic Cars, International Journal of Engineering Science and Technology (2010)
[5] Md. Rasedul Islam, Md. Amzad Hossain, Mohammad Mashud, Md. Tanvir Ibny Gias,