www.nat-hazards-earth-syst-sci.net/8/1277/2008/ © Author(s) 2008. This work is distributed under the Creative Commons Attribution 3.0 License.
and Earth
System Sciences
Analysis of NOAA particle data and correlations to seismic activity
C. Fidani1and R. Battiston1,2 1INFN, Via A. Pascoli, Perugia, Italy
2Dipartimento di Fisica Universit`a di Perugia, Via A. Pascoli, Perugia, Italy
Received: 14 July 2008 – Revised: 26 September 2008 – Accepted: 29 September 2008 – Published: 26 November 2008
Abstract. A decade of NOAA-15 particle flux data of-fers an opportunity to test claims of correlations between seismic activity and effects on the ionosphere. Over the last two decades, potentially interesting observations in the ionosphere-magnetosphere transition region have been in-vestigated. Specifically these consists of anomalous particle fluxes detected by several space experiments and correlated with the earthquake occurrence. These particle fluxes are characterised by anomalous short-term and sharp increases in high energy particle counting rates, referred to as particle bursts. In this work, more general rules for particle bursts se-lection have been defined and tested on the NOAA database, for particles inside and outside the South Atlantic Anomaly region. The whole period of ten years burst activity from NOAA-15 database is reported. Data from four satellites, NOAA-15, 16, 17 and 18, were analyzed during periods of solar quiet activity in connection with strong earthquakes, re-vealing presence of bursts detected on more than one satellite close to the time of the same seismic events. This prelimi-nary study presented here concentrates on periods of major Indonesian earthquakes from 1998 to date, including Suma-tra event M=9, during which geomagnetic Ap index was less than 16 and with no sudden ionospheric disturbances. During this period particle burst temporal distributions have shown some correspondence with earthquake times. The limits of the analysis presented in this papers are discussed as well as prospects for future work.
1 Introduction
This study presents for the first time some preliminary result of an ongoing analysis of the National Oceanic and Atmo-spheric Administration (NOAA) particle database in
connec-Correspondence to: C. Fidani ([email protected])
tion with seismic activity. This work started in 2006 from a general study of particle data (Esposito, 2008).
The NOAA and the National Aeronautics and Space Ad-ministration (NASA) jointly developed a series of Polar Op-erational Environmental Satellites (POES). These Advanced TIROSN (ATN) spacecrafts, named after the prototype satel-lites, TIROS-N (Television Infrared Observation Satellites), have been flying since 1978 (Davis, 2007). The system consists of pairs of satellites, which ensure that every part of the Earth is regularly observed at least twice every 12 h from about 800 km altitude. Starting with the NOAA-15 satellite in 1998, an upgraded version of the Space Environ-ment Monitor (SEM-2) is being flown. The SEM-2 contains two sets of instruments that monitor the energetic charged-particle environment near the Earth. They detect and monitor the influx of energetic ions and electrons into the atmosphere and the particle radiation environment at the altitude of the satellite.
Ray Bursts as the X-Ray portion of these events will have the same effect as a solar flares X-Ray emissions (Mandea and Balasis, 2006).
Several types of electromagnetic waves in the ionosphere and magnetosphere can produce particle acceleration and precipitation (Millan and Thorne, 2007). A brief list of such phenomena include: electron precipitation coincident with ELF/VLF wave bursts (Walt et al., 2002); ULF modulation of energetic particles in the dayside magnetosphere (Zong et al., 2007); electron micro-bursts in association with chorus (Lorentzen, 2001); acceleration and loss depending on plas-maspheric hiss (Meredith et al., 2004); precipitation of radia-tion belt electrons induced by whistlers (Lauben et al., 2001); electron precipitation induced by magnetospheric reflected whistler waves (Bortnik et al., 2006); pitch-angle scatter-ing by electromagnetic ion cyclotron waves (Summers and Thorne, 2003). Some mechanical wave interactions were in-vestigated: acceleration by fast magnetosonic waves (Horne et al., 2007) and electrons precipitation in relation to equa-torial plasma wave turbulence phenomena (Morioka et al., 2001). Furthermore, there are some kinds of electromag-netic waves coming from the surface of the earth, such as anthropogenic noise and natural emissions. In order to ex-plain the existence of electron precipitation zones at middle latitudes, several hypotheses are currently under investiga-tion (Millan and Thorne, 2007). One of these hypotheses re-garding the connection with ground-based radio-transmitters has been recently confirmed (Inan et al., 2007a). Another hypothesis concerning global thunderstorms activity has also been considered and it was confirmed that lightning induces electron precipitation (Inan et al., 2007b).
Short term variations in high energy charged particles fluxes near the South Atlantic Anomaly (SAA) space were associated to seismic activity (Voronov et al., 1989). The electromagnetic link between particle fluxes and earthquakes (EQs) constitute another interesting hypothesis based on the observation that VLF radiation is related to seismic activ-ity (Larkina et al., 1983), which was recently confirmed by the DEMETER satellite in (Rozhnoi et al., 2007). Experi-mental data on high-energy charged particle fluxes, obtained from various near-Earth space experiments (MIR orbital sta-tion, METEOR-3, GAMMA and SAMPEX satellites) were processed and analyzed; a 2 to 5 h precursor effect resulted (Aleksandrin et al., 2003), although its statistical signifi-cance was somewhat limited. A re-analysis of the SAM-PEX database also shows a 4 h precursor effect (Sgrigna et al., 2005). The case study of HF wave measurements and gamma rays diagnostic performed on board the CORONAS-I satellite have shown a possible correlation between enhance-ments of whistler wave activity and soft gamma ray fluxes related to seismic activity (Rothkaehl et al., 2006).
Satellite experiments including Vulkan constellation (Pu-linets, 2006), ESPERIA (Sgrigna et al., 2007), CSES (Xuhui et al., 2007) and ARINA (Bakaldin et al., 2007) are aimed to study in detail the seismic effects in the near-Earth
magne-tosphere. While Vulkan constellation, ESPERIA and CSES are still at the design level, ARINA has been build and is cur-rently operated on a Resurs-DK1 satellite (Casolino et al., 2008), since 2006 both studied and implemented.
A limitation of these correlation studies is that they have been performed over short time intervals (less than 16 months) compared to the frequency of strong EQs. The NOAA database includes up to 10 years of recording parti-cle data from NOAA-15, nearly eight years from NOAA-16, six years from NOAA-17 and three years from NOAA-18 (Davis, 2007). Therefore, correlations among similar instru-ments located in more than one satellite can also be studied.
2 NOAA polar satellites and instruments
POES circle the Earth in an almost North-South circu-lar orbits, passing close to both poles, with an altitude between 833 (morning orbit) and 870 (afternoon orbit) km. Their orbital period is about 100 min and they are sun synchronous: NOAA-15 ascending orbit retrievals sults in a 07:30 p.m. analysis, and the descending orbits re-trievals results in a 07:30 a.m. analysis; NOAA-16 and 18 ascending orbit retrievals results in a 02:00 p.m. analysis, and the descending orbits retrievals results in a 02:00 a.m. analysis; NOAA-17 ascending orbit retrievals results in a 10:00 p.m. analysis, and the descending orbits retrievals re-sults in a 10:00 a.m. analysis (NASA, 2004). Geographically the satellites cover all longitudes and all dipole tilts, while the satellites cover virtually all magnetic latitudes. Due to of the polar orbit, the satellites sample virtually all values of the McIlwain parameter L, although the coverage in (B, L) space, where B is the geomagnetic field, is somewhat limited.
The electron detector is a thin (700µm) 25 mm2 solid-state detector covered by 0.51µm thick nickel foil, that sup-presses detector response to photons and reduces pulse pile-up caused by incident low-energy electrons or ions. Elec-tronic pulse-height discrimination is used to select pulses due to incident electrons of nominal energies greater than 30 keV, 100 keV and 300 keV. The contaminant response to protons that deposit more than 1 MeV in the detector is eliminated electronically. The detectors are, however, sensitive to pro-tons between about 135 keV and 1 MeV. Data from the direc-tional proton detectors may be used to correct for this effect. The proton (ion) detector within each telescope pair is a two-element, solid-state detector telescope. The front el-ement has an effective area of 25 mm2 and thickness of 200µm. The back element has an effective area of 50 mm2 and a thickness of 200µm. A 2500-gauss magnet is mounted across the input aperture of this detector assembly to pre-vent any electrons of energies less than 1.5 MeV from reach-ing the detectors. Electronic pulse height discrimination, to-gether with coincidence logic on the pulses from the two detectors in the telescope, is used to select protons in six energy pass bands (nominally 30–80 keV, 80–250 keV, 250– 800 keV, 800–2500 keV, 2500–6900 KeV and >6900 KeV) and an integral channel for energies greater than 2.5 MeV. This detector is also sensitive to heavy ions (e.g. He and O) although the particle energies defining the pass bands will be marginally higher than those given for protons. The geomet-ric factor for both the electron and proton directional detector systems is 9.5×10⁻⁷m2sr.
The omnidirectional sensors consist of three nominally identical Kevex Si (Li) solid-state detectors of 50 mm2area by 3 mm thickness, independently mounted under spherical shell moderators. Each detector has a full-opening view an-gle of 120◦in the zenith direction. The detectors are shielded from below by approximately 0.5 cm of Mallory, and the spacecraft itself provides additional shielding from below. Assuming that it is an isotropic flux the omnidirectional ge-ometric factor would be 0.215 cm2(Evans and Greer, 2004).
3 NOAA data preparation
The NOAA database binary files were downloaded from the NOAA web page http://poes.ngdc.noaa.gov/. A binary file contains a daily archive record and is free to download from the NOAA web page a day after its recording. The archive record comprises (Evans and Greer, 2004) 32 s of data, in-cluding a full set of orbital parameters provided every 8 s (sub-satellite latitude and longitude every 2 s), 16 full data collection cycles from the TED, the MEPED electron and proton telescope instruments and 4 full cycles of the omni-directional detector sensors. A full set of background data from the 8 TED detector systems is included once in the 32 s archive record. Finally, a selected portion of the SEM-2
in-strument status, temperature, and system health data as well as data quality and ancillary information are included.
As the amount of NOAA data is large we have used the HBOOK Fortran package for histogramming and fit-ting, which are developed at CERN. The HBOOK system consists of a few hundred Fortran subroutines which en-able the user to symbolically define, fill and output one-and two-dimensional density estimators, under the form of histograms, scatter-plots and tables and to handle Ntuples (Couet and Goossens, 1998). Ntuples is a suitable way of writing micro data-summary-files for further processing, al-lowing for the projections of individual variables or correla-tion plots and a seleccorrela-tion mechanisms may be defined. The first step in the preparation of NOAA data consists of the transformation of all binary files into Ntuples, making op-portune selections and additions of data.
First of all we included in Ntuples only orbital parame-ters, MEPED and omni-directional data from binary files. The instrument status, temperature, and system health data as well as data quality and ancillary information were used to select the data coming from instrumental errors. Daily average geomagnetic and ionospheric activities were included in the Ntuples with the respective indexes Ap and SID. Data were downloaded respectively from the In-dices of Global Geomagnetic Activity of Geo Forschungs Zentrum (GFZ) Postdam at ftp://ftp.gfz-potsdam.de/pub/ home/obs/kp-ap/tab/ and from the American Association of Variable Star Observers (AAVSO) at http://www.aavso.org/ observing/programs/solar/sidbase/. Furthermore, we added the calculus of the minimum mirror point altitudes by the UNILIB libraries (Krunglanski, 2002) to determine if parti-cles were precipitating. The library consists of FORTRAN subroutines which enable computation of the geomagnetic field strength, to evaluate averaged quantities along a drift trajectory and to trace magnetic field lines and drift shells. As well as the widely used (Bm, L) coordinates, the library
enables evaluation of parameters such as the magnetic field intensity, the McIlwain parameter L, the third adiabatic in-variant I, the altitude of the lowest mirror point, etc. (Schmitz et al., 2000).
Fig. 1. CR daily average common data cell filling in the adiabatic coordinates on 26 December 2004.n=satellite passes through the same cell.
To correlate seismic activity with NOAA data we built an-other Ntuple which contains EQs data including: time of events, locations, magnitudes and depths. These data were downloaded from the Earthquake Center of US Geological Survey (USGS) at http://neic.usgs.gov/neis/epic/epic.html. The values of the corresponding L-shells of the EQ epicen-ter projected to different altitudes were also calculated by UNILIB and included in the Ntuples. This was done to de-termine the presence and location of a possible link between EQ and particle fluxes.
Finally, after Ntuples were filled, we converted them into ROOT files to compress the data rendering them simpler to manage, study and plot the results using ROOT framework. ROOT is an object-oriented C++ analysis package aimed at solving the data analysis challenges of high-energy physics (Brunet al., 2007) and it is downloadable from the ROOT web site at: http://root.cern.ch/root/Availability.html.
4 NOAA data analysis
Sharp, short-term increases in particle CRs ranging from tens of seconds to a few minutes were observed for the first time in the MARIYA experiment, operating on board of the SALYUT-7 orbital station during 1985 (Voronov et al., 1987). It was in that occasion that the term high-energy charged “particle bursts” (PBs) was coined. Our data analysis started from a selection of PBs from the NOAA database. Our analysis method follow the strategy introduced by Sgrigna et al. (2005) but implements some differences. These differences were necessary because, compared to the previously published experiments, NOAA satellites operate at higher orbits and covers different energy range intervals. We calculated the daily averages of CRs and then defined the condition for which a CR fluctuation was not likely due to possible statistical fluctuations with a probability equal to 99%, the PBs. We then proceeded to fill the Ntuples with the PBs information.
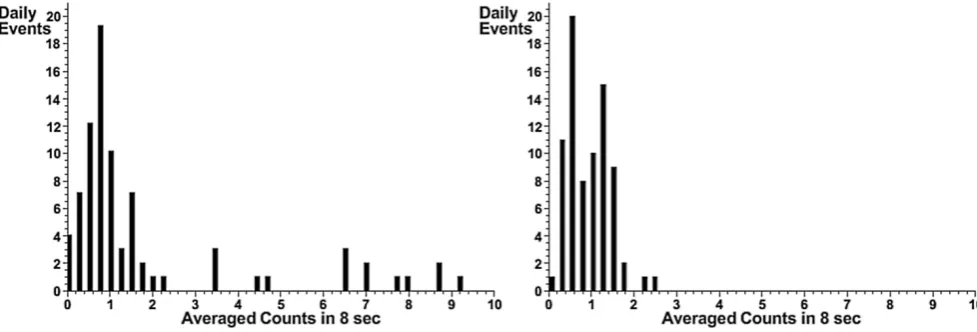
Fig. 2. Distribution of averaged 8 s counts on 26 December 2004, for 0◦electrons with energy from 30 KeV to 100 KeV, 1.1<L<1.2 and 90◦<α<105◦. The left distribution was detected outside the SAA with 22µT <B<25µT while the right distribution was detected entering the SAA with 20.5µT <B<22µT.
geomagnetic field B at the satellite locations. It was nec-essary to take into account the CRs amplitude and variation versus geomagnetic coordinates, because the spatial gradient of particle fluxes near the SAA was too large. In this situa-tion B can be considered a suitable parameter for delimiting the transition region between inner and outer radiation belts (Walt, 1994) where large gradient are located, sub intervals of the B are defined, so that the CR amplitude variations are limited. The averages were calculated in every sector of a three dimensional matrix divided by L-shell, pitch angleα and B. The L-shell bin was set at 0.1 as in the past cases (Sgrigna et al., 2005) and the range between 0.9 and 2.2 so that we have 13 intervals. In this study the pitch angle is equal to the difference between the particle telescope and ge-omagnetic field directions. The SEM-2 detectors however, have a finite aperture of 30◦so that we chose a bin of 15◦for a total of 12 intervals. The geomagnetic bin was fixed to be B dependent with shorter intervals going through the radiation belts, because we needed to compensate for the non linear increase of CRs when the satellite goes through the SAA. The nine B intervals are the following: 16.0–17.5µT, 17.5– 19.0µT, 19.0–20.5µT, 20.5–22.0µT, 22.0–25.0µT, 25.0– 29.0µT, 29.0–33.0µT, 33.0–37.0µT and 37.0–41.0µT. A two dimensional matrix (L, B) was used to examine particle data of the 4 omni-directional telescopes. In all other cases, we used a three dimensional matrix (L,α, B). To obtain a re-liable statistic we made sure that the satellite passed at least 20 times through the cells with the same intervals for all the variables. We did not consider the CRs and CR daily aver-ages relative to the cells in which satellite passed less than 20 times. Figure 1 shows typical average daily CR data filling of the adiabatic intervals for every geomagnetic cell and the first four pictures are relative to the SAA.
Figure 2 shows typical 8 s CR distributions inside two dif-ferent cells; they are compatible with Poisson distributions in
agreement with earlier works (Sgrigna et al., 2005). To de-fine the condition for which a CR is a non-poissonian fluctu-ation with 99% probability, we introduced the numbernσ of
σthat the amplitudexof the CRs must exceed the averagex¯. In other words we usednσ for whichP (x>x¯+nσσ )<0.01.
We had to remember that our amplitudes are the results of an average of four independent variables, so the correct condi-tion for the probability became (Young, 1964)
P
x >x¯+n√σσ
3
<0.01. (1)
To obtainnσ that satisfy the relation above we considered
the tabulated confidence interval for a Poisson distribution (Cowan, 1998). From the upper value of the intervalxM,
which correspond to the probability less than 0.01, we have nσ =
xM− ¯x
σ , (2)
whereσ= √
¯
x for a Poisson distribution. Sincex¯ is not an integer number, we interpolatednσ for every value ofx¯using
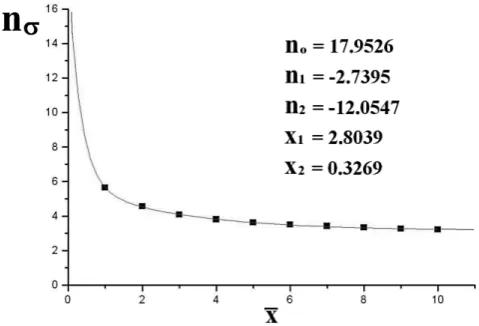
a double exponential fitting: nσ(x)¯ =no+n1
1−e− ¯x/x1+n 2
1−e− ¯x/x2; (3) the behavior of this function is plotted in Fig. 3.
In order to select the 8 sx events to be considered as PBs we applied condition in Eq. (1). However, near the SAA re-gion we interpolated thex¯between two cells to have a better precision in the selection algorithm. The interpolation of the points outside the SAA was realized by a linear method while a non-linear bicubic method (Press et al., 2001) was used for the points inside the SAA. Special attention was given to the calculus of first and second derivatives for the interpolation algorithm along the boundary of the (L, B) subspace.
Fig. 3. The double exponential behavior ofnσ used to select the
fluctuations which had 99% probability to be non-poissonian. The squared point positions were calculated from the tabulate ampli-tudes of the confidence intervals.
each point on the (L,α, B) space. The idea was to consider a number of cells in the (L, B) subspace so that a more precise definition of average hyper-surface become possible. But, to have such precision we needed a large number of data as one day was not sufficient to assure 20 satellite passages through the very small cells. Given this we used 3 months of data that preceded the day which was examined. The requirement of at least 20 satellite passages through each cell was respected with a division of 130 intervals for L range multiplied by 100 intervals for B range. In this way, a reliable value of the averages in the regions near SAA can be obtained and selection rules in Eq. (1) can be directly applied. Periods of strong solar activity were also excluded from the 3 months of averaged data, but these were not for the trend due to long periods of solar variations. Hence, the use of a larger portion of the database should be done with great attention. Identi-cal results in PBs selection were obtained using this different method, thereby confirming the results of the previous anal-ysis and rendering them more robust.
The Fortran program filled the new daily Ntuples with both orbital and invariant coordinates, geomagnetic and iono-spheric activities, CRs values of all particles and energies, selection rules and PB features. Selected rules are referred to asx¯ andnσ. For the PB features we defined an index
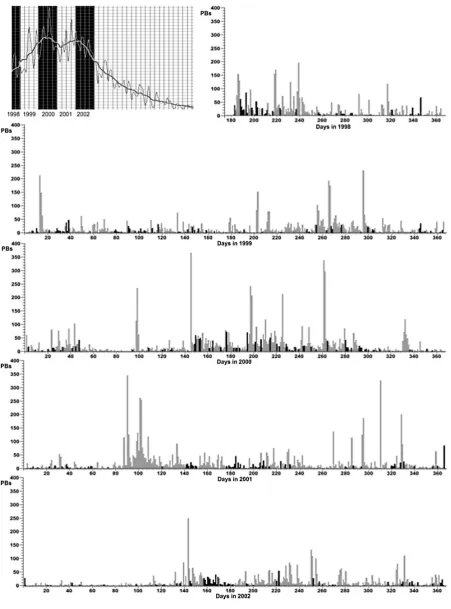
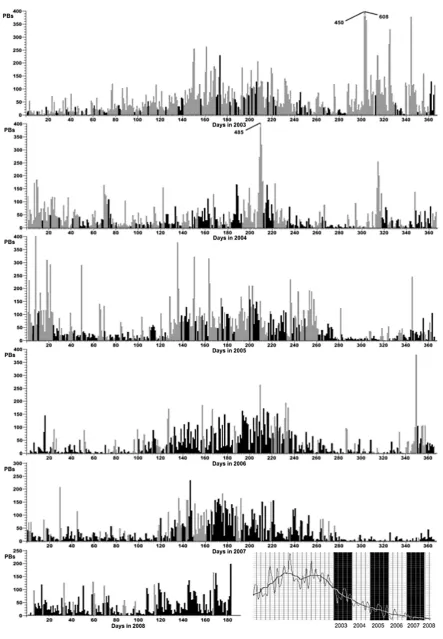
which labels PB events and calculated the temporal length of contiguous PB events together with their average times and amplitudes. Because Van Allen belts are densely populated and strongly influenced by solar activity we are interested in anomalous particle fluxes outside of them. The NOAA satellites go through the Van Allen Belts inside the SAA and polar regions, thus these regions can be excluded by select-ing respectively B>22µT and L<2.2. A summary of the remaining burst activities from the entire 10 year NOAA-15 database of electron at 0◦ with energy from 30 KeV to 100 KeV is reported in Fig. 4.
5 NOAA particle bursts and earthquakes
In Fig. 4 burst activity is shown in black to identify quiet solar periods (Ap<16 and SID=1) and in gray for the other periods. An inverse correlation appears between the inten-sity burst and the 11 years solar cycle; an additional corre-lation between the PBs and the the boreal summer is also seen. Concerning the sun activity flags those conditions will be carefully analysed in future work. For instance a feature to analyse is the connection between sudden phase anoma-lies in VLF transmitters and solar x-ray which was observed to be more influential at the time of minimum solar activity (Raulin et al., 2006). On the other hand, strong solar storms influence the ionosphere up to several days after the solar event that generated them (Baker and Kanekal, 2008). Fur-thermore geomagnetic storms can begin or finish at the end of the previous day or during the early hours of the subsequent day respectively. The Ap averages over these days could then be lower than 16 while at the same time solar activity can still influence the ionosphere.
To better define the particles that are affected by external perturbations we need to verify if they are precipitating par-ticles (Sgrigna et al., 2005). Particle precipitation from the lower boundary of the radiation belts can be described as a result of pitch-angle diffusion and drifting around the Earth along L-shell (Abel and Thorne, 1998a,b). In this process the altitude of the bouncing points falls and when the parti-cles go below 100 km they interact with the atmosphere and are lost. Through the UNILIB subroutines we calculated the minimum L-shell bouncing altitudeHmirrand recorded them in the Ntuples so we can now select particle precipitation events by the conditionHmirr<100 km.
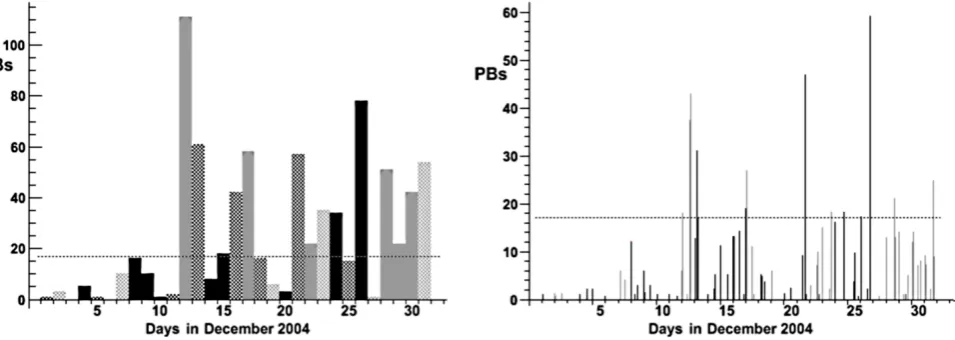
Fig. 5. The PB selection in the December 2004 NOAA-15 database. Black and gray PBs were selected in the same way as in Fig. 4. Black
dashed PBs were selected on days with daily averages of Ap<16 and with at least one of the 8 three hour periods where Ap>25. Gray dashed PBs were selected on days with SID activity. The horizontal dashed line is the monthly quiet solar period PB average. In the left graph we chose a 24 h intervals to show the daily PB sums while for the right graph we chose half-hour intervals to show the detailed PBs importance and their temporal distribution.
2004 (horizontal dashed line) we can see that the SID activ-ity produced unimportant PB numbers on days 2, 7, 19, 23, 27 and 31.
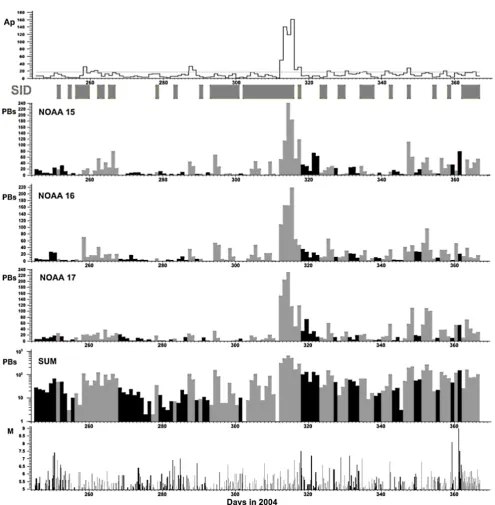
We tested the algorithm over a longer period and applied the PBs selection from 1 September 2004, to 31 December 2004. The PB activity measured by the three satellites to-gether with the global seismic activity are shown in Fig. 6. During this long period strong and moderate geomagnetic perturbations were recorded. Ap index went above 100 at the beginning of November 2004 and many days of perturbed particle fluxes were reported (Lekshmi, 2008). The period 2– 11 November was characterised by activity which generated two X-class X-ray flares (Yermolaev et al., 2005) and weak geomagnetic activity was recorded in 5 December (Tver-skaya et al., 2006). On 27 December 2004, at 21:30:26.5 UT, a giant hard X-ray/g ray flare, near the solar zenith, ionized the exposed part of Earths dayside ionosphere (Inan et al., 2007c). We stopped at the end of December 2004, since the month of January 2005 was perturbed by several ionospheric phenomena (Longden et al., 2007) which were associated with at least seven moderate or weak storms (Tverskaya et al., 2006). Days with high solar activity were excluded when we searched for any possible connection with seismic events and were labeled in grey in all the figures here. The top plot in Fig. 6 shows the geomagnetic activity during period by means of Ap and SID indexes. The dotted line in the Ap plot is the threshold and is equal to 16 while the grey bands represent days with SID=1.
Differently from Figs. 4 and 5, to search for a correlation with strong seismic activity, in Fig. 6 we defined black PBs only during quiet days (QDs) when the daily averages of Ap<16, Ap<25 in each of the three hour intervals during the same day and SID=0. We labeled all the other PBs in
gray. We focus on EQs having a magnitude larger than 6.5. Exceptional number of PBs measured by at least one satel-lite were observed during QDs on 6, 8 and 29 September, 10 October, 16 and 26 November, 26 December; for each of this days significant seismic activity was also observed. NOAA-16 seems to be more sensitive to September and Oc-tober EQs while NOAA-15 and 17 are more sensitive during the months of November and December. Due to the limited coverage of each satellite, PB activity appears different from the three considered databases; a sum of three PBs database could be more appropriate and is plotted in logarithmic scale plot in Fig. 6. We extend this analysis to long periods.
Fig. 6. The NOAA-15, 16 and 17 PB daily activities and their total sum compared with Ap and SID indexes (on the top) and global seismic
Table 1. Strong earthquakes with magnitude M≥7.0 in the 10◦N to 10◦S and 90◦E to 140◦E region from 1 July 1998 to 30 June 2008. (–) means the satellite was not active yet, (*) means non QD and only one (*) means three non QDs: the day before, the day of and the day after the EQ.
M Date Latitude Longitude Depth Daily #PB NOAA-15 NOAA-16 NOAA-17 NOAA-18
(UT) (Km) Average #PB #PB #PB #PB
7.1 28/10/1998 16:25 0.84◦N 125.97◦E 33 5 *,*,3 – – –
7.0 09/11/1998 05:38 6.92◦S 128.95◦E 33 1 * – – –
8.3 29/11/1998 14:10 2.07◦S 124.89◦E 33 1 * – – –
7.1 04/03/1999 08:52 5.40◦N 121.94◦E 33 2 * – – –
7.6 04/05/2000 04:21 1.11◦S 123.57◦E 26 19 * – – –
8.3 04/06/2000 16:28 4.72◦S 102.09◦E 33 14 * – – –
7.1 28/08/2000 19:29 4.12◦S 127.03◦E 33 12 * – – –
7.5 01/01/2001 06:57 6.90◦N 126.58◦E 33 4 0,0,* – – –
7.4 13/02/2001 19:28 4.68◦S 102.56◦E 36 3 0,*,* 0,*,* – –
7.1 24/02/2001 07:23 1.27◦N 126.25◦E 35 3 0,0,3 2,0,1 – –
7.5 19/10/2001 03:28 4.10◦S 123.91◦E 33 4 *,*,0 *,*,0 – –
7.5 05/03/2002 21:16 6.03◦N 124.24◦E 31 3 0,*,* 1,*,* – –
7.7 10/10/2002 10:50 1.76◦S 134.30◦E 10 1 * * * –
7.6 02/11/2002 01:26 2.82◦N 96.08◦E 30 1 * * * –
7.1 26/05/2003 19:23 2.35◦N 128.85◦E 31 41 * * * –
7.1 05/02/2004 21:05 3.62◦S 135.54◦E 16 17 * * * –
7.5 07/02/2004 02:42 4.00◦S 135.02◦E 10 17 *,0,* *,0,* *,0,* –
7.3 25/07/2004 14:35 2.43◦S 103.98◦E 582 32 * * * –
7.5 11/11/2004 21:26 8.15◦S 124.87◦E 10 25 * * * –
7.1 26/11/2004 02:25 3.57◦S 135.35◦E 10 25 *, 26, 27 *, 23, 21 *, 14,5 – 9.1 26/12/2004 00:58 3.30◦N 95.98◦E 30 17 *, 78, * *, 20, * *, 53, * – 7.5 26/12/2004 04:21 6.91◦N 92.96◦E 39 17 *, 78, * *, 20, * *, 53, * – 7.1 05/02/2005 12:23 5.29◦N 123.34◦E 525 19 *, 22, * *, 22, * *, 8, * – 7.1 02/03/2005 10:42 6.53◦S 129.93◦E 201 12 22, 18, 10 18, 9, 4 33, 26, 24 – 8.6 28/03/2005 16:09 2.09◦N 97.11◦E 30 12 27, 8, 12 9, 1, 1 4, 11, 12 –
7.5 24/07/2005 15:42 7.92◦N 92.19◦E 16 84 57, 98, 128 25, 50, 76 73, 56, 69 35, 40, 140 7.6 27/01/2006 16:58 5.47◦S 128.13◦E 397 10 *, 2, 4 *, 3, 4 *, 17, 14 *, 2, 8 7.7 17/07/2006 08:19 9.28◦S 107.42◦E 20 72 102, 107, 13 79, 36, 15 61, 29, 30 98, 23, 23 7.5 21/01/2007 11:27 1.07◦N 126.28◦E 22 15 21, *, 12 34, *, 13 14, *, 3 43, *, 15 7.5 08/08/2007 17:05 5.86◦S 107.42◦E 280 46 *, 69, 141 *, 27, 126 *, 36, 15 *, 21, 7 8.5 12/09/2007 11:10 4.44◦S 101.37◦E 34 24 16, 21, 36 13, 23, 25 0, 14, 0 8, 22, 1 8.1 12/09/2007 23:49 2.62◦S 100.84◦E 35 24 16, 21, 36 13, 23, 25 0, 14, 0 8, 22, 1 7.2 13/09/2007 03:35 2.13◦S 99.63◦E 22 24 21, 36, 4 23, 25, 7 14, 0, 0 22, 1, 0 7.5 20/02/2008 08:08 2.77◦S 95.96◦E 26 25 108, 17, 2 69, 16, 3 23, 10, 10 23, 7, 3 7.3 25/02/2008 08:36 2.49◦S 99.97◦E 25 25 0, 0, 1 0, 0, 0 15, 1, 0 1, 0, 0
monthly PBs average during quiet solar periods. The 8 re-maining EQs were associated with an exceptional number of PBs for the period where they were recorded.
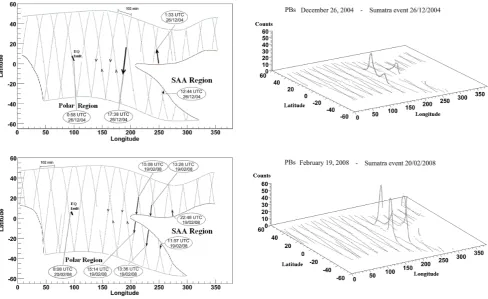
We also studied more in details the properties of of PBs associated with EQs: intensity, geographic and temporal dis-tributions, L-shell and pitch angle. For instance in Fig. 7 we show the PBs detected in connection with two strong EQs in the Sumatra region on 26 December 2004 and on 20 Febru-ary 2008. In the first case cluster of PBs were recorded about 35 min, 12 and 17 h after the big quake; while their geo-graphic position is consistent with eastward drifting precip-itating electrons. This is due to the fact that SAA functions like a drain pipe for precipitating particles in the atmosphere,
Fig. 7. The NOAA-15 orbits, PBs geographical distribution, PB times with respect to the Sumatra EQ times and fault positions (on the left),
and the NOAA-15 PB count dynamic (on the right) are shown in two cases. In the first case we can only observe post-seismic PBs while in the second we can observe pre-seismic PBs. Bold lines define the selection of particle precipitation outside the SAA while the dotted lines indicate the polar regions with L>2.2 and arrows define the direction of the satellite motion.
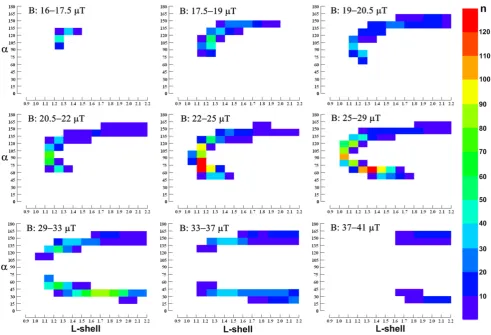
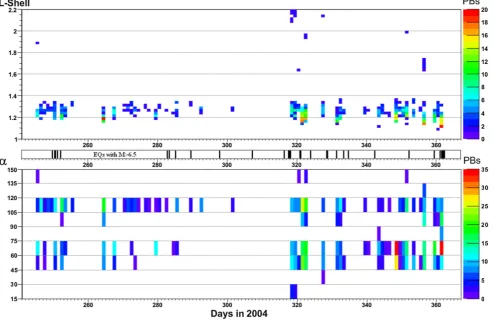
L-shell and pitch angle distributions in Fig. 8 are of the same period as those distributions in Fig. 6 but here we plot-ted only solar quiet periods for a better visualization. They are not normalized by the time spent at the various L-shells. We have observed that the PBs induced by solar activity have a higher L-shell value than those observed in PBs near the times of EQs. In fact, particle precipitation due to external in-fluence propagates inside the Van Allen Belts leading to PBs that fall from the top to the bottom of L-shell. PB L-shells are concentrated in the 1.1–1.2 interval on 26 December, this could be considered an index of internal influence on particle precipitation. The pitch angle is in the 60–75◦region, thus
confirming the particle precipitation hypothesis. PB L-shells and pitch angles on 19 February 2008 are identical to those on 26 December 2004.
Also PBs of NOAA-16 and 17, detected after the big quake, were observed on geographical locations near the SAA border. PBs studied above regard 0◦electrons with en-ergies between 30 KeV and 100 KeV, no exceptional number of PBs were detected by the other channels of electrons, pro-tons and omni-directional detectors.
6 Conclusions
We have studied for the first time the NOAA particle database in connection with global seismic activity. Addi-tionally, we have for the first time detected PBs using multi-ple satellites with identical detectors.
We developed a selection algorithm for PBs suited for NOAA data but different from that used in earlier studies (Sgrigna et al., 2005). The statistical analysis used to iden-tify PBs is made by an accurate method to calculate and in-terpolate average CRs at every point of invariant space. This method seems to work also in the SAA, polar and transitions belts regions. This analysis could be used to study the pro-cess that connects the different ionosphere zones with sun activity, thunderstorms, cosmic rays and other phenomena, by means of PB activity.
Fig. 8. L-shells and pitch anglesαof PBs from 1 September to 31 December 2004, on days with average Ap<16 and SID=0. Colors indicate the number of PBs for every interval of considered variables. EQs with M≥6.5 are also indicated by vertical bands between L-shell andα
plots.
geomagnetic restrictions described in Sect. 5. PB activity increases during the boreal summer at the minimum of the solar cycle.
The analysis of the 0◦ electron channel with energy be-tween 30 KeV and 100 KeV shows exceptional numbers of PBs with respect to the monthly PB average during quiet so-lar periods. This is in connection with the Sumatra EQ and some of the largest (M>7) quakes that struck the Indonesian region over the last ten years. The corresponding PBs are ob-served near the SAA west boundary in the transition region between the inner and outer radiation belts. PB intensities were of the order of 10–100 particle counts every 8 s for L-shell between 1.1 and 1.2 having a pitch angle of about 60 to 75◦, consistent with the precipitation hypothesis. The total time length of continuous PB sequences was from about a few seconds to a few minutes.
From this analysis it appears that there is a strong influ-ence of the solar activity on the PB activity. A significant improvement in this analysis should include a more accurate usage of the detail time structure of both Ap and SID indexes.
Given the limited number of EQs examined here, further research is needed to determine whether PBs are correlated with EQs, in particular to verify if the definition of PB we used is suitable to search for correlation with EQs.
Acknowledgements. We would like to thank S. Pulinets and M. Casolino for their precious observations and corrections. Additionally, we would also like to thank L. Conti for his valuable input regarding particle precipitation. Finally, our thanks go to G. Esposito, R. Gallaccio and P. Zuccon for their help pertaining to hbook and UNILIB programming solutions. We also gratefully recognise the grant from Consulta delle Fondazioni delle Casse di Risparmio Umbre, which has been instrumental for the study presented in this paper.
Edited by: P. F. Biagi
References
Abel, B. and Thorne, R. M.: Electron scattering loss in Earths in-ner magnetosphere 1, Dominant physical processes, J. Geophys. Res., 103(A2), 2385–2396, 1998a.
Abel, B. and Thorne, R. M.: Electron scattering loss in Earths inner magnetosphere 2, Sensitivity to model parameters, J. Geophys. Res., 103(A2), 2397–2407, 1998b.
Aleksandrin, S., Yu, Galper, A. M., Grishantzeva, L. A., et al.: High-energy charged particle bursts in the near-Earth space as earthquake precursors, Ann. Geophys., 21, 597–602, 2003, http://www.ann-geophys.net/21/597/2003/.
Asikainen, T. and Mursula, K.: Energetic electron flux be-havior at low L-shells and its relation to the South At-lantic Anomaly, J. Atmos. Sol.-Terr. Phys., 70, 532–538, doi:10.1016/j.jastp.2007.08.061, 2008.
Bakaldin, A. V., Batishchev, A. G., Voronov, S. A., et al.: Satellite Experiment ARINA for Studying Seismic Effects in the High-Energy Particle Fluxes in the Earths Magnetosphere, Cosmic Res., 45, 5, 445–448, 2007.
Baker, D. N.: Effects of the Sun on the Earth’s environment, J. At-mos. Sol.-Terr. Phys., 62, PII: S1364-6826(00)00119-X, 1669– 1681, 2000.
Baker, D. N. and Kanekal, S. G.: Solar cycle changes, geo-magnetic variations, and energetic particle properties in the in-ner magnetosphere, J. Atmos. Sol.-Terr. Phys., 70, 195–206, doi:10.1016/j.jastp.2007.08.031, 2008.
Balasis, G. and Mandea, M.: Can electromagnetic distur-bances related to the recent great earthquakes be detected by satellite magnetometers?, Tectonophysics, 431, 173–195, doi:10.1016/j.tecto.2006.05.038, 2007.
Bortnik, J., Inan, U. S., and Bell, T. F.: Temporal signatures of radi-ation belt electron precipitradi-ation induced by lightning-generated MR whistler waves: 2. Global signatures, J. Geophys. Res., 111, A02205, doi:10.1029/2005JA011398, 2006.
Brun, R., Rademakers, F., Canal, P., et al.: ROOT An Object Ori-entable Data Analysis Framework User Guide 5.17, 469 pp., July 2007.
Casolino, M., De Simone, N., Di Felice, V., and Picozza, P.: De-tection of the high energy component of Jovian electrons in Low Earth Orbit with the PAMELA experiment, Adv. Space Res., 41, 168–173, doi:10.1016/j.asr.2007.07.024, 2008.
Couet, O. and Goossens, M.: HBOOK Statistical Analysis and His-togramming Reference Manual, Information Technology Divi-sion, CERN Geneva, Switzerland, 193 pp., 1998.
Cowan, G.: Statistical Data Analysis, Clarendon Press, Oxford, 128 pp., 1998.
Davis, G.: History of the NOAA satellite program, J. Appl. Remote Sens., 1, 012504, doi:10.1117/1.2642347, 2007.
Esposito, G.: Studio della stabilit`a temporale delle fasce di Van Allen e ricerca di correlazioni di natura geofisica per lo sviluppo di un payload spaziale, Phd thesis, Univ. di Peru-gia, which can be downloaded at http://ams.pg.infn.it/∼esposito/
phd2/thesis2-esposito.pdf, Feb. 2008,
Evans, D. S. and Greer, M. S.: Polar Orbiting Environmental Satel-lite Space Environment Monitor – 2: Instrument Descriptions and Archive Data Documentation, NOAA Technical Memoran-dum January, version 1.4, 155 pp., 2004.
Evans, D., Garrett, H., Jun, I., et al.: Long-term observations of the trapped high-energy proton population (L<4) by the NOAA
Po-lar Orbiting Environmental Satellites (POES), Adv. Space Res., 41, 126–1268, doi:10.1016/j.asr.2007.11.028, 2008.
Grigoryan, O. R., Panasyuk, M. I., Petrov, V. L., et al.: Spectral characteristics of electron fluxes at L<2 under the Radiation Belts, Adv. Space Res., 42, 1523–1526, doi:10.1016/j.asr.2007.12.009, 2008.
Horne, R. B., Thorne, R. M., Glauert, S. A., et al.: Elec-tron acceleration in the Van Allen radiation belts by fast magnetosonic waves, Geophys. Res. Lett., 34, L17107, doi:10.1029/2007GL030267, 2007.
Huang, J., Yan, Y., and Liu, Y.: An analysis of solar radio burst events on December 1, 2004, Adv. Space Res., 39, 1439–1444, doi:10.1016/j.asr.2007.03.061,2007.
Inan, U. S., Golkowski, M., Casey, M. K., et al.: Subionospheric VLF observations of transmitter-induced precipitation of in-ner radiation belt electrons. Geophys. Res. Lett., 34, L02106, doi:10.1029/2006GL028494, 2007a.
Inan, U. S., Piddyachiy, D., Peter, W. B., et al.: DEMETER satellite observations of lightning-induced electron precipitation, Geophys. Res. Lett., 34, L07103, doi:10.1029/2006GL029238, 2007b.
Inan, U. S., Lehtinen, N. G., Moore, R. C., et al.: Massive distur-bance of the daytime lower ionosphere by the giant g-ray flare from magnetar SGR 180620, Geophys. Res. Lett., 34, L08103, doi:10.1029/2006GL029145, 2007c.
Krunglanski, M.: UNILIB Reference Manual, Belgisch Instituut Voor Ruimte – Aeronomie, which can be downloaded thogether to the library from http://www.oma.be/NEEDLE/unilib.php/, 2002.
Larkina, V. I., Nalivayko, A. V., Gershenzon, N. I., et al., Ob-servations of VLF emission, related with seismic activity on the Interkosmos-19 satellite, Geomagn. Aeronomy, 23, 684–687, UDC 550.34:550.388.2, 1983.
Lauben, D. S., Inan U. S., and Bell, T. F.: Precipitation of radia-tion belt electrons induced by obliquely propagating lightning-generated whistlers, J. Geophys. Res., 106, A12, 29 745–29 770, 2001.
Lekshmi, D. V., Balan, N., Vaidyan, V. K., et al.: Re-sponse of the ionosphere to super geomagnetic storms: Ob-servations and modeling, Adv. Space Res., 41, 548–555, doi:10.1016/j.asr.2007.08.029, 2008.
Longden, N., Honary, F., Kavanagh, A. J., and Manninen, J.: The driving mechanisms of particle precipitation during the moderate geomagnetic storm of 7 January 2005, Ann. Geophys., 25, 2053– 2068, 2007, http://www.ann-geophys.net/25/2053/2007/. Lorentzen, K. R., Blake, J. B., Inan U. S., and Bortnik, J.:
Observa-tions of relativistic electron microbursts in association with VLF chorus, J. Geophys. Res., 106, A4, 6017–6027, 2001.
Mandea, M. and Balasis, G.: The SGR 1806-20 magnetar signa-ture on the Earths magnetic field, Geophys. J. Int., 167, 586–591, doi:10.1111/j.1365-246X.2006.03125.x, 2006.
Meredith, N. P., Horne, R. B., Thorne, R. M., et al.: Substorm de-pendence of plasmaspheric hiss, J. Geophys. Res., 109, A06209, doi:10.1029/2004JA010387, 2004.
Millan, R. M. and Thorne, R. M.: Review of radiation belt rela-tivistic electron losses, J. Atmos. Sol.-Terr. Phys., 69, 362–377, doi:10.1016/j.jastp.2006.06.019, 2007.
Its Relation to Equatorial Plasma Wave Turbulence Phenomena, Geophys. Res. Lett., 28, 5, 931–934, 2001.
NASA Goddard Space Flight Center, Greenbelt, Maryland, http:// www.cpc.ncep.noaa.gov/products/stratosphere/strat a f/ NOAA-K.pdf, NOAA-L.pdf, NOAA-M.pdf and NOAA-N.pdf, respec-tively in 1997, 2000, 2002 and 2004.
Obara, T., Miyoshi, Y., and Morioka, A.: Large enhancement of the outer belt electrons during magnetic storms, Phys. Chem. Earth (C), 24, 1–3, 281–292, 1999.
Press, W. H., Teukolsky, S. A., Vetterling, W. T., and Flannery, B. P.: Numerical Recipes in Fortran 77 The Art of Scientific Com-puting Second Edition (Volume 1 of Fortran Numerical Recipes), p. 107–110, 2001.
Pulinets, S. A.: Space technologies for short-term earthquake warning, Adv. Space Res., 37, 643–652, doi:10.1016/j.asr.2004.12.074, 2006.
Raulin, J.-P., Pacinia, A. A., Kaufmann, P., et al.: On the de-tectability of solar X-ray flares using very low frequency sud-den phase anomalies, J. Atmos. Sol.-Terr. Phys., 68, 1029–1035, doi:10.1016/j.jastp.2005.11.004, 2006.
Rothkaehl, H., Bucik, R., and Kudela, K.: Ionospheric plasma re-sponse to the seismic activity, Phys. Chem. Earth, 31, 473–481, doi:10.1016/j.pce.2006.02.039, 2006.
Rozhnoi, A., Molchanov, O., Solovieva, M., et al.: Possible seismo-ionosphere perturbations revealed by VLF signals collected on ground and on a satellite, Nat. Hazards Earth Syst. Sci., 7, 617– 624, 2007,
http://www.nat-hazards-earth-syst-sci.net/7/617/2007/.
Schmitz, H., Orr A., and Lemaire, J.: Validation of the UNILIB Fortran library, Bulgarian-Belgian Cooperation Project, 362 pp., 2000.
Sgrigna, V., Carota, L., Conti, L., et al.: Correlations between earthquakes and anomalous particle bursts from SAMPEX/PET satellite observations, J. Atmos. Sol.-Terr. Phys. 67, 1448–1462, doi:10.1016/j.jastp.2005.07.008, 2005.
Sgrigna, V., Buzzi, A., Conti, L., et al.: Seismo-induced effects in the near-earth space: Combined ground and space investigations as a contribution to earthquake prediction, Tectonophysics, 431, 153–171, 2007.
Soraas, F., Aarsnes, K., Lundblad, J. A., and Evans, D. S.: En-hanced Pitch Angle Scattering of Protons at Mid-Latitudes Dur-ing Geomagnetic Storms, Phys. Chem. Earth (C), 24, 1–3, 281– 292, 1999.
Soraas, F., Aarsnes, K., Oksavik, K., and Evans, D. S.: Ring cur-rent intensity estimated from low-altitude proton observations, J. Geophys. Res., 107, A7, doi:10.1029/2001JA000123, 2002. Summers, D. and Thorne, R. M.: Relativistic electron
pitch-angle scattering by electromagnetic ion cyclotron waves during geomagnetic storms, J. Geophys. Res., 108, A4, doi:10.1029/2002JA009489, 2003.
Tverskaya, L. V., Vedenkin, N. N., Ginzburg, E. A., et al.: Dynam-ics of Radiation Belt Relativistic Electrons in November 2004– January 2005, Geomagn. Aeronomy, 46, 2, 146–150, 2006. Voronov, S. A., Galper, A. M., Koldashov, S. V., et al.: Registration
of Sporadic Increase of High Energy Particle Flux near Brazilian Anomaly Region, Proc. of 20th ICRC, 4, 451–452, 1987. Voronov, S. A., Galper, A. M., Koldashov, S. V., et al.: Observation
of high-energy charged particle flux increases in SAA region in 10 September 1985, Cosmic Res., 27, 4, 629–631, 1989. Walt, M.: Introduction to Geomagnetically Trapped Radiation,
Camridge University, Cambridge, 168 pp., 1994.
Walt, M., Voss, H. D., and Pickett, J.: Electron precipitation coin-cident with ELF/VLF wave bursts, J. Geophys. Res., 107, A8, doi:10.1029/2001JA009100, 2002.
Xuhui, S., Shaoxie, Xu, Yun, Wu, et al.: General proposal for China Seismo-Electromagnetic Satellite Project, Early Warming and Monitoring Earthquake by Using Electromagnetism Detect-ing Satellite, Int. Workshop Proc., 14, Jakarta, Indonesia, 25–27 July 2007.
Yermolaev, Yu. I., Zelenyi, L. M., Zastenker, G. N., et al.: A Year Later: Solar, Heliospheric, and Magnetospheric Disturbances in November 2004, Geomagn. Aeronomy, 45, 6, 68–719, 2005. Young, H. D.: Statistical treatment of experimental data, Am. J.
Phys., 32, doi.org/10.1119/1.1970295, 1964.