www.nat-hazards-earth-syst-sci.net/9/767/2009/ © Author(s) 2009. This work is distributed under the Creative Commons Attribution 3.0 License.
and Earth
System Sciences
Spatial vulnerability units – expert-based spatial modelling of
socio-economic vulnerability in the Salzach catchment, Austria
S. Kienberger, S. Lang, and P. Zeil
Centre for Geoinformatics (Z GIS), Salzburg University, Schillerstrasse 30, 5020 Salzburg, Austria Received: 11 February 2009 – Revised: 8 May 2009 – Accepted: 13 May 2009 – Published: 19 May 2009
Abstract. The assessment of vulnerability has moved to centre-stage of the debate between different scientific disci-plines related to climate change and disaster risk manage-ment. Composed by a combination of social, economical, physical and environmental factors the assessment implies combining different domains as well as quantitative with qualitative data and makes it therefore a challenge to iden-tify an integrated metric for vulnerability. In this paper we define vulnerability in the context of climate change, target-ing the hazard “flood”. The developed methodology is be-ing tested in the Salzach river catchment in Austria, which is largely prone to floods. The proposed methodology al-lows the spatial quantification of vulnerability and the iden-tification of vulnerability units. These units build upon the geon concept which acts as a framework for the regionaliza-tion of continuous spatial informaregionaliza-tion according to defined parameters of homogeneity. Using geons, we are capable of transforming singular domains of information on specific systemic components to policy-relevant, conditioned infor-mation. Considering the fact that vulnerability is not directly measurable and due to its complex dimension and social con-struction an expert-based approach has been chosen. Estab-lished methodologies such as Multicriteria Decision Analy-sis, Delphi exercises and regionalization approaches are be-ing integrated. The method not only enables the assessment of vulnerability independent from administrative boundaries, but also applies an aggregation mode which reflects homoge-nous vulnerability units. This supports decision makers to reflect on complex issues such as vulnerability. Next to that, the advantage is to decompose the units to their underlying domains. Feedback from disaster management experts indi-cates that the approach helps to improve the design of mea-sures aimed at strengthening preparedness and mitigation.
Correspondence to: S. Kienberger
(stefan.kienberger@sbg.ac.at)
From this point of view, we reach a step closer towards validation of the proposed method, comprising critical user-oriented aspects like adequateness, practicability and usabil-ity of the provided results in general.
1 Motivation and background
G e r m a n y
A u s t r i a
I t a l y S w i t z e r l a n d
U p p e r D a n u b e R i v e r B a s i n
Salzach river test site
0 2550 100 Kilometers N
Fig. 1. Location of the Austrian Salzach River case study area within the Upper Danube River Basin and Central Europe.
unit delineation, while the latter metaphorically illustrates the problem of a collective treatment of all elements belong-ing to that given unit. In order to minimize the unit-related biases, we will present a method for identifying and automat-ically delineating concept-related fiat boundaries (Smith and Mark, 1998) for vulnerability units. This paper discusses a spatial explicit model for assessing socio-economic vulnera-bility to flood hazards at the sub-national level and indepen-dent from administrative boundaries.
Within hydrological modeling approaches, Fl¨ugel (1996) proposed the delineation of hydrological response units (HRU’s) which comprise a specific assembly of components characterizing the catchment’s natural environment. In the context of the DPSIR-Framework (Driving forces, Pressures, States, Impacts and Responses; Smeets and Weterings, 1999; EC, 2002a, b, c), Integrated Water Resources Management (IWRM) and the integration of environmental, physical and socio-economic domains, the derivation of systemic Water Resource Response Units (WRRUs) has been proposed. The spatial modeling of vulnerability units (VulnUs, Kienberger et al., 2008) follows a conceptualization developed within this research context and has been tested by analyzing the flood hazard in the Salzach river catchment (Austria). 1.1 Case study: Salzach river catchment (Austria) The research has been carried out in the Austrian part of the Salzach river catchment (see Fig. 1). As one of the main tributaries of the Inn River (sub-catchment of the Danube Basin), the Salzach drains a large part of the Eastern Alps in Austria. Along its total length of 225 km the Salzach col-lects waters from a catchment area of 6649 km2 within an altitude range of almost 3000 m (highest point Großvenedi-ger: 3666 m, river mouth: 389 m). The catchment is
charac-terised by an alpine regime at the headwaters and the middle reaches, and pre-alpine dominated areas at its lower course. The alpine areas comprise the Hohe Tauern mountain range dominated by crystalline rocks which are in parts protected by the National Park Hohe Tauern (IUCN category II). How-ever, outside of the protection zones the area is characterised by long established cultural landscapes (alpine pastoral sys-tems), structural transformations by a demanding tourism sector (especially winter tourism/skiing) and the infrastruc-ture for hydropower generation. The highest areas are domi-nated by glaciers and permafrost, depending on aspect, start-ing at altitudes of 2600 m (Lieb, 1998; Ebohon and Schrott, 2008). North of the Hohe Tauern the greywacke zone, a band of palaeozoic sedimentary rocks, forms ridges with a smooth morphology. This zone comprises the major skiing resorts of the Eastern Alps and is extensively used for timber produc-tion. The source of the Salzach River lies within this zone, which is not glaciated and shows no evidence of permafrost. Further to the North, the Northern Limestone Alps follow a west-east trend characterised by a more rugged landscape. Sedimentary rocks can be found in the lower course and val-ley floors, a terrain which is predominately used for dairy farming. This highly dynamic area, with the City of Salzburg as its major centre, lies at the crossroad of important trading routes and transportation networks. In general the whole test site area is less dominated by industrial production and is more oriented towards tourism and services provision.
The test site has a total population of approximately 454 000 inhabitants, whereas most of the people live in the city of Salzburg (approx. 150 000 inhabitants) and its sur-roundings. The population distribution concentrates on the valley floors with a strong dominance in the major Salzach river valley. The climate zones comprise high mountain regimes in the upstream areas and moderate continental con-ditions in the lowlands. The northern areas receive a large amount of precipitation (around 1120 mm, City of Salzburg) due to the blocking effect of the Alps, which reaches up to 1400 mm in the inner-alpine Salzach valley and up to 1600 mm at the Sonnblick observatory.
1.2 Defining vulnerability in the context of water and climate change issues
The concept of vulnerability as a descriptor of the status of a society or community with respect to an imposed hazard or threat is deeply rooted in a multidisciplinary research effort. This research work has been discussed and outlined in Clark et al. (2007) and Kienberger et al. (2009), and focuses on the socio-economic domain of vulnerability by considering climate change induced effects.
The concept of vulnerability has been widely discussed in literature, and recent reviews by Villagr´an (2006) and Birk-mann (2006) draw together some highlights of a range of opinions. In regard to the assessment and reduction of socio-economic vulnerability to climate induced hazards, different research and policy communities representing disaster risk reduction, climate change adaptation, environmental man-agement and poverty reduction have taken up the discussion (Thomalla et al., 2006). In the economic domain, monetary loss estimations focussing on single hazards can be found (e.g., Oberndorfer at al., 2007). However, a consensus on a more integrative approach has not yet been achieved and even within the climate change community divergent notions of vulnerability do exist. For example, the “end point” def-inition (Bogardi et al., 2005) sees vulnerability as the resid-ual of climate change impacts reduced by adaptation (the re-maining segments of the possible impacts of climate change that are not targeted through adaptation). In contrast, the “starting point” views vulnerability as a general characteris-tic of societies generated by different social and economic factors and processes (ibid.). Furthermore, it should also be mentioned that yet another approach, originating from UN/ISDR (2004), classifies vulnerability in different dimen-sions or components (social, economic, physical and envi-ronmental).
The “starting point” considers the core concept embodied in the IPCC’s implicit definition of vulnerability as the de-gree to which a system is susceptible to, or unable to cope with, the adverse effects of climate change (IPCC, 2001a and b). The IPCC definition is a function of the character, magnitude and rate of climate change to which a system is exposed, its sensitivity (degree to which a system is affected, adversely or beneficially, by climate-related stimuli) and its adaptive capacity (the ability of a system to adjust to climate change, moderate potential damages, take advantage of op-portunities or cope with the consequences). The relation can be expressed as:
V =f (H, S, AC) (1)
whereH defines hazard, S sensitivity and AC adaptive ca-pacity.
The definition suggests that vulnerability reflects the sum of the hazards (defined as a potentially damaging physical event) to which a society or community is exposed, mitigated
by its adaptive or coping capacity (its ability to respond effec-tively to risk) and compensated by the available alternative economic opportunities. Despite the huge range of possible expressions, applicability suggests that Eq. (1), as derived from the IPCC, provides a viable initial working definition – but in practice it is difficult to implement locally. Partic-ularly in data-poor regions, due to the fact that it includes the full range of both bio-physical and socio-economic fac-tors (hazard and adaptive capacity), the approach is hard to realize. However, it can be suggested that the hazard term in Eq. (1) in effect serves mainly to scale the variability of the vulnerability, providing the very important spatial and tem-poral dimension. Thus, for any one particular place, time and hazard, it may be possible to simplify the relationship to
VH =fH(S, AC) (2)
where hazard (H )refers to the hazard concerned (flood, bank erosion, glacier lake outburst, drought etc.). The hazard here refers to the magnitude and frequency relationship (e.g. HQ50, HQ100), whereas vulnerability is not related to this process.
The IPCC definition of sensitivity as the degree to which a system is affected, adversely or beneficially, by climate-related stimuli suggests that at heart the degree of impact is driven by risk and mitigated by adaptive capacity. However, this is a very data demanding approach which also leads to a circular argument with Eq. (1). In terms of practical appli-cation, it is therefore proposed that the definition should be built from a series of components (which relate to the sectors proposed by Villagr´an, 2006):
S=f (s1, s2, ..., sn) (3)
wheres1 reflects livelihood susceptibility, s2 infrastructure
susceptibility andsnother susceptibility sectors.
For the purposes of this study, adaptive capacity is the preferred term as it relates most effectively to the concept of adaptive management and is more easily generalised to reflect society’s ability to grasp opportunities as well as re-spond to threats. In practical terms, it is necessary to define adaptive capacity in a way which is amenable to implemen-tation with available data sets:
AC=f (SC, R) (4)
where SC defines social capacity andRresilience.
Vulnerability
to a
specific hazard
Sensitivity
Susceptibility Indicator 1 Susceptibility Indicator 2 Susceptibility Indicator 3
Susceptibility Indicator n ...
Adaptive Capacity
Social Capacity
Skills Indicator Technologies Indicator
Information Indicator Governance Indicator
Resilience
Eco. surplus/eco. alternatives Indicator
cultural/social/political constraints
Indicator
F u n c t i o n o f
F u n c t i o n o f
Fig. 2. Conceptualisation of vulnerability, describing its
sub-domains and indicator levels (Kienberger et al., 2009).
functional components of vulnerability also show a temporal dynamic (discussed in Hufschmidt et al., 2005), which is not reflected in the context of this paper.
The overall concept of vulnerability, its relation to hazard and risk (R)is defined by the widely applied relationship
R=H×V (5)
The vulnerability model applied in this research context is summarised in Fig. 2. A major objective of applying this hi-erarchical concept is to allow the identification of indicators for each domain.
2 Integrated spatial indicators
2.1 Place-based modelling of vulnerability
Apart from the conceptualisation of vulnerability and the composition of indices/metrics the spatial modelling of vul-nerability is not always regarded as a central element. How-ever, vulnerability is – next to its multidisciplinary character – a phenomenon which is strongly related to the specifics of a place, i.e. place-based (e.g. Cutter et al., 2008, November 2008). Different researchers have focussed on this issues at the global or national scale (e.g. Turner et al., 2003; Dilley et al., 2005; Schneiderbauer, 2007). A recent comparison of various social vulnerability indicators, targeting the global or national scale, has been investigated by Gall (2007) and a validation of social vulnerability in the context to river-floods in Germany been presented by Fekete (2009).
One of the earliest works which stresses a significant place based concept of vulnerability has been published by He-witt and Burton (1971) and further developed by Cutter et al. (2000). This work describes an index which is linked to the hazard-and-place model of vulnerability, whereas indi-cators reflecting the bio-physical and social vulnerability are combined to describe the place-vulnerability (Cutter, 1996). The authors combine different indicator datasets through in-tersecting the different data layers. Data is combined with-out a specific weight. The issue of assigning equal weights is being discussed within a note. It is being justified because reliable damage estimates do not exist and a way for simpli-fication has been intended. Cutter et al. (2000) point out that further research is required to develop weighting schemes for the combination of social and bio-physical indicators and to test their relative importance in statistically predict-ing vulnerability. Additionally, the hazard-of-place model has been currently extended by Cutter et al. (2008) to inte-grate also antecedent factors and links to mitigation and pre-paredness. Reflecting on the hazard-of-place model Collins et al. (2008) modeled vulnerability for cities in Mexico and the USA. According to the authors, required data is avail-able to allow a comparison of transnational vulnerabilities and highlighted the real-world relevance for planners, man-agers and decision-makers. Challenges arise around specific issues within the social vulnerability index (e.g. racial/ethnic minority components). They further point out that such a dis-aggregated vulnerability metric provides decision makers at the local level with appropriate information to identify spe-cific shortcomings.
2.2 The geon concept
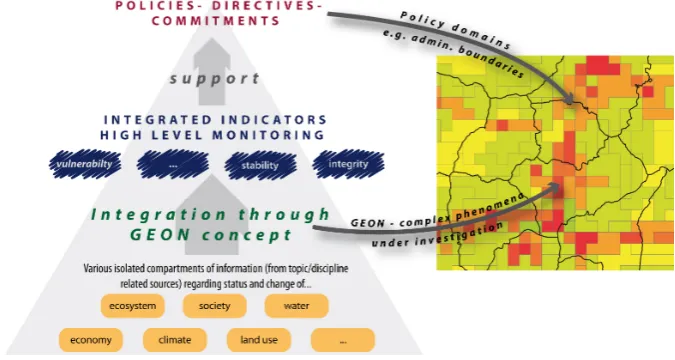
Fig. 3. The geon concept – integration of various compartments of information to model complex phenomena and provide policy relevant information (Lang et al., 2008).
an aggregated spatial indicator. Take for example hazard zon-ing, entrenched since several decades in spatial planning reg-ulations in mountainous regions in Austria. This zoning exer-cise, performed by experts based upon a set of criteria, aims at delineating homogenous regions with uniform exposure to terrain-induced risks. In our diction such a zone can be con-sidered a geon, because it has a limited, policy-related extent, and is constructed conceptually by integrating a range of sin-gle indicators (distance to slopes and/or rivers and/or reten-tion areas, terrain, land cover, soil condireten-tions, distance to ex-isting settlements etc.). The geon concept is flexible in terms of a certain conceptualisation of a problem (specific policy realm, specific hazard domain, etc.). Using geons, we are capable of transforming singular domains of information on specific systemic components to policy-relevant, conditioned information (Tiede and Lang, 2009). Conditioned informa-tion means informainforma-tion which is integrated and adapted to a policy-defined realm. The step from data to information has been accomplished in most application domains: basically loads of various datasets were turned into information – in-formation which is readily available, but – more often than not – restricted to its own domain.
Geons are generated by transforming continuous spatial information into discrete objects by algorithms for interpola-tion, segmentainterpola-tion, regionalizainterpola-tion, generalization; they are analyzed in terms of their arrangement, which leads to emer-gent spatial qualities; they are dynamic and can be monitored in terms of changes. Within the spatial extent in which a cer-tain policy applies or a cercer-tain hazard may occur, a group of geons constitutes a spatially exhaustive set (geon set). In this study, vulnerability units have been derived as a specific case of a geon set within an area exposed to flood hazard (Lang et al., 2008).
The spatial limit of the geon set, since being derived func-tionally, may not fully coincide with administrative bound-aries. The average size of a geon depends on the scale rele-vant for policy implementation. Geons can always be spa-tially aggregated or disaggregated to administrative units, which in most cases form the spatial constraint of authori-ties’ mandates.
3 Methodology
3.1 Workflow and expert knowledge
A specific aim of the developed methodology is to derive spa-tial homogenous units of vulnerability as a specific case of a geon set (Kienberger et al., 2008). Considering the fact that vulnerability is not directly measurable and due to its complex dimension and social construction an expert-based approach has been chosen. Established methodologies such as Multicriteria Decision Analysis, Delphi exercises and new approaches are being integrated to model the spatial distribu-tion of a complex phenomenon (Fig. 4).
Fig. 4. Overall workflow from conceptualisation, indicator devel-opment and stakeholder process to methodological issues and com-munication of results.
100 m grid cell size; Wonka, 2006). This is a very unique approach and allows the visualization of data in their spatial distribution independent from “artificial polygons”. Another advantage is that in subsequent analysis steps MAUP is min-imized. The relevance of factors such as the level of edu-cation and the origin of the population was debated in the context of the study. However, reflecting on issues raised during the Hurricane Katrina event, where merely marginal-ized groups have been most vulnerable (Cutter, 2005), these datasets were retained for evaluation.
Data on critical infrastructure, such as length of highways per grid cell, land use/land cover areas and indicators tar-geting ecosystem integrity within the resilience sub-domain (such as the protection status and availability of flood reten-tion areas), are aggregated on the standardized grid cell. The domain “silent” land cover consists of indicators on specific land use/land cover classes to which no vulnerable elements have been directly attached (Kienberger et al., 2009). The chosen sub-domains for the vulnerability concept are identi-fied in Table 1.
3.2 Integration of indicators
For integrating the different indicator data and to aggregate them on a sub-domain level, Multi Criteria Analysis (MCA), Multi Criteria Evaluation or Analytical Hierarchy Process
Fig. 5. Workflow to generate vulnerability units at the different levels (indicator level [1], domain level [2] and final vulnerability units [3]).
(AHP) were applied. Multi Criteria Evaluation combines in-formation from several criteria to create a single index. A profound discussion on that topic and current best practices approaches are available in Carver, 1991; Malczewski, 1999; Malczewski, 2000; Jiang and Eastman, 2000; and Robinson, 2003. It is proposed to use common methodologies for group decision making such as scoring, ranking, pair-wise compar-ison or Delphi exercises to identify possible functions for the normalization of the values and weights for the different data layers. Beinat (1997) discusses the identification of the value function in depth, which allows the non-linear normalization of data. As discussed in the papers by Cutter et al. (2000) and Collins et al. (2008) the allocation of weights is a criti-cal issue as data on verification of disasters is not available for this multidisciplinary approach. Linked to the method of MCA, scoring exercises are generally applied. Further-more Greiving et al. (2006) argue that the Delphi method al-lows the integration of expert knowledge which may reflect the specific situation and circumstances for the investigated area. The Delphi method (Helmer, 1966) is based on a pro-cess of collection and integration of knowledge from experts and stakeholders through iterative and anonymous investiga-tion of opinions by means of quesinvestiga-tionnaires and scoring.
To allow the integration and comparison of different data sets and data sources normalization has to be applied. The following linear function (Eq. 6) describes the normalization
v0= v−min
max−min(maxnorm−minnorm)+minnorm (6) where max and min values derive from the old value range, maxnormand minnormdefine the new value range. In general,
a value range between 0 and 1 is utilized. For this case study, an 8 bit value range (0–255) has been applied to make use of the full radiometric spectrum of raster datasets. To allow further comparisons the layers are normalized again (Eq. 6) to allow integration of the domain level data.
Table 1. Indicators and expert-derived weights (in brackets) of the different vulnerability domains.
Vulnerability
Domain Single indicators (level 1) and aggregated domains (level 2)
Sensitivity Susceptibility – Housing/Buildings [0.158]
Number of buildings per grid cell with 1–2 households [0.3],>3 households per building [0.175], communal buildings [0.083], tourism relevant buildings [0.5], offices [0.042], commerce [0.025], communication infrastructure buildings [0.117], industry [0.108], critical infrastructure (health, education, ...) [0.083], other buildings [0.017]
Susceptibility – Infrastructure [0.105]
Length per grid cell: highways [0.1], primary roads [0.208], secondary roads [0.317], railway [0.133]; number per grid cell of large power plants [0.167], small power plants [0.075]
Susceptibility – Assets [0.125]
Area per grid cell: crop [0.192], pasture [0.167], forests [0.292], reservoirs [0.158]; number per grid cell: water springs [0.192]
Susceptibility – “Silent” Land Cover [0.053]
Area per grid cell: lakes [0.444], alpine meadows [0.2], rocks/mountain peaks [0.133], glaciers [0.222]
Susceptibility – Population: age distribution [0.073]
Number per grid cell: population aged<20 years [0.292], 20–80 years [0.333] and>80 years [0.375]
Susceptibility – Population: means of subsistence [0.043]
Number per grid cell: full time employment male [0.211]/female [0.211], half time male [0.178]/female [0.178], precarious employment male
[0.111]/female [0.111]
Adaptive Capacity Resilience – Workforce in economy sectors [0.065]
Number of employees per grid cell: agriculture [0.342], mining [0.175], production [0.225], services [0.258]
Resilience – Size of companies/workplaces [0.040]
Number of companies per grid cell with:<49 [0.5], 50–249 [0.25],>250 employees [0.25]
Resilience – Ecosystem integrity [0.105]
Area per grid cell: protected areas [0.417], retention areas [0.583]
Resilience – Access [0.050]
Distance per grid cell to: health facilities [0.458], roads [0.542]
Social Capacity – Early Warning [0.125]
Early warning system available [0.556], number of first responders per grid cell [0.444]
Social Capacity – Origin of population [0.015]
Number per grid cell from Austria [0.333], EU [0.333], other countries [0.333]
Social Capacity – Education [0.045]
combination (see Fig. 5). Therefore the raster datasets are multiplied by a weight and finally summed up (Eq. 7). V (xi)=
X
j
wjvj(xi)=
X
j
wjrij (7)
The weights have been derived from a scoring exercise with four stakeholders and experts, who have significant ex-pertise in the field of disaster risk reduction and regional planning in the Salzach catchment. The experts, ranging from practitioners (government and NGOs) to academics, have been asked to distribute a predefined amount of scores to each of the factors according to their relative importance and contribution to the vulnerability of people in the Salzach for floods. The identified weights are listed in Table 1. Two hierarchical levels have been applied to allow for appropriate investigation and flexibility within the modeling (indicators – level 1, domains – level 2). On the first level 100 points had to be distributed, to derive the weights for the combination of indicators on level 2 (domain level), whereas 30 points have been distributed to allow the integration to the final vulnera-bility index. The exercise was facilitated through an online form, which also automatically calculated the constant sums. From the weighted sums and its domain data sets the vul-nerability units are being derived. To this end we used re-gionalization techniques applied to multidimensional data, as offered by object-based image analysis (OBIA, Lang and Blaschke, 2006). Borrowed from the domain of remote sens-ing image segmentation, we employed a region-based, lo-cal mutual best fitting approach that merges image segments according to the gradient of degree of fitting (Baatz and Sch¨ape, 2000). It allows for controlling two complementary criteria of similarity of neighbouring segments: likeness in “colour” or “form”. Spatial objects can be generated that are rather compact or have rather smooth outlines. A scale-factor enables user-driven control of appropriate scale rep-resentations. Providing multi-resolution segmentation in a reproducible manner with a controllable average size of ob-jects organized in a strict spatial hierarchy (scale-adaptive segmentation, Lang, 2008) is the primary objective of the object generation approach (Baatz and Sch¨ape, 2000).
The difference between adjacent objects (ibid.) is ex-pressed by the spectral distance (SD) of two pixels or objects p1,p2in a feature space:
SD= v u u t n X
d=1
(p1−p2)2 (8)
or noted as vector difference for a three-dimensional feature space as: SD= −→ v1 − −→ v2
;where−→ v1
=
d11
d12
d13 and−→
v2 =
d21
d22
d23 (9) specify the feature space location of pixel 1 and pixel 2 or the average value of object 1 and object 2.
To optimize the degree of homogeneity between two neighboring pixels or objects, the specific heterogeneityhmin
is minimized at every merge. The current degree of fitting (hdiff)is characterized by the change in heterogeneity in a
“virtual merge” (ibid.): hdiff=hmin−
SD1+SD2
2 (10)
By additional weighting the heterogeneity criterion with ob-ject size the requirement of producing obob-jects of similar area can be accomplished. Form homogeneity is realized by re-lating object boundary length (perimeter) to the perimeter of the most compact form of the same size (i.e. a circle), the deviation of which can be expressed by the shape index:
SH P = p
2√π∗s (11)
wherepequals the perimeter andsequals the size of an ob-ject.
As this regionalization algorithm is usually applied to spectral reflectance values, a comprehensive approach was chosen to normalize the values within the 8 bit range. The regionalization algorithm allows weighting of the different layers, which reflect the results from the stakeholder process (Table 1). In this case a scale parameter of 4 was applied with shape index of 0.5 and compactness factor of 0.1. Finally for each unit a vulnerability value (V) is calculated considering the different layers (v1,v2,...vn) in aj-th dimensional space
through the vector product
− → V = q
v12+v22+v32 (12)
The results of both methods can be standardized within the range 0 and 1, whereas 1 reflects a high and 0 a low vulnera-bility.
4 Results and discussion
Fig. 6. Visualisation of vulnerability units (height reflects the vulnerability index) in Google Earth and as a planar map for the city of Salzburg. The degree of vulnerability is classified in 10 classes ranging from low (0) to high (1) vulnerability. The histogram indicates number of vulnerability units (VulnUs) per vulnerability class.
Fig. 7. Showing the sensitivity and adaptive capacity domain of vulnerability (decomposability of the geon approach).
different domains play a critical role. This issue may help to verify conceptual approaches of vulnerability for cases, where either the domains are of central interest or social constructions such as sensitivity and adaptive capacity can be directly related. The calculation of the adaptive capacity and sensitivity index (Fig. 7) has been performed separately from the vulnerability index considering only the respective domains.
The 10 most vulnerable areas are equally distributed over the test area site and are located at important local population centers reflecting shortfalls within different vulnerability do-mains. In total 1462 patches have been derived. The size also depends on the chosen scale factor, however allows for mod-ifications based on the intended policy scale. An aggregation and disaggregation modality is reflected through the choice
of the scale parameter. The size of the VulnUs varies from 1 km2to 36 km2, whereas the highest number of patches falls in the class of 1 km2sized units. This can be attributed to the heterogeneity in specific areas. Less vulnerable areas, also less populated areas, show a higher level of aggregation and reflect a higher degree of homogeneity.
The number of units per vulnerability class describes a bimodal distribution (Fig. 6), whereby the vulnerability classes 4, 5 and 7 have the highest portion. Looking from a generalized viewpoint one could also observe a normal dis-tribution with low numbers on the extremes (vulnerability class 1 and 10).
units. This supports decision makers to reflect on complex issues such as vulnerability on a sub-administrative level, but derives units which represent a common characteristic of vulnerability. Next to that, the advantage is to decompose the units into its underlying domains. In Fig. 7 decomposi-tion into the defined vulnerability domains of sensitivity and adaptive capacity is illustrated. From an expert’s point of view decomposition can be extended down to the indicator level, which allows a specific investigation of problem areas and shortcomings. We see this as a central element of our de-veloped approach: on the one hand the integrated modeling of vulnerability for the identification of “hot spots” through homogenous vulnerability units, on the other hand the de-composability down to the specific indicator level for an ex-pert’s view.
However, it has to be considered – and this is a general challenge for the assessment of (socio-economic) vulnera-bility – that the relevant data have to be available. In Aus-tria census data is provided on aggregated grid cells. Due to data privacy issues, information gaps may exist on grid cells smaller than 1 km2. This is a challenge for other countries where those datasets are not available at all, and need to be derived by e.g. statistical area disaggregation of census units using land use information (e.g. Mennis, 2003; Tiede and Lang, 2009).
As mentioned above, methodological challenges also arise from the expert based approach and the identification of weights. In general, the methodology to derive vulnerabil-ity units can be transferred to other conceptualizations as well. In this context this approach has been chosen. We are aware about the shortcomings of the expert-based approach and discussion on objectivity (such as outlined in Collins et al., 2008) relate. Still, we see this as an approach to assign relationships between the different data sets whereas other approaches lack data or cannot be implemented due to the characteristics of indicators and data (quantitative vs. quali-tative; multi- and transdisciplinary approaches).
To visualize the results, the production of standard maps is possible. Within our workflow we added scientific visual-ization as an important element to communicate the results to decision makers. Virtual globes such as Google Earth al-low the integration of these results, provide a sound basis of baseline data and allow the exploration of results through 3-D effects (Tiede and Lang, 2009).
5 Conclusions
In this paper we present a methodology to model the complex phenomena of vulnerability through the identification of vul-nerability units. Further investigations involve the alterna-tive way to identify weights, the integration of environmen-tal/ecological (Leidel, 2008) domains to assess an overall vulnerability. A general issue is the verification and valida-tion of results, which could not yet be quantitatively carried
out. Verification, i.e. comparison of the result with any kind of objective “true” information, is still immature for evaluat-ing integrated indicators mapped (such as vulnerability units) and modelled in the way described above. In the introductory part of the paper we claimed to derive vulnerability bound-aries as a specific instance of concept-driven fiat boundbound-aries. In order to verify their delineation, and especially to base decisions on their spatial distribution, it may be considered a conceptual goal to turn vulnerability units into bona fide objects as reflecting more genuine discontinuities in space (Smith, 1995). But this would require a more rigorous con-cept of vulnerability categories or classes with a unified, in-terdisciplinary notion on vulnerability – a major challenge in vulnerability science.
Considering disaster risk reduction as the ultimate objec-tive, actors from national governments, provincial adminis-trations and local authorities need to plan interventions based on location. By nature regional development is a highly mul-tidisciplinary task: enacting land use change (e.g. to create retention areas along rivers or to resettle vulnerable people) involves experts from different disciplines or ministries. To implement interventions, consensus has to be reached among all stakeholders, including the vulnerable population. With-out a spatial representation of the situation, visualising the extent of hazard or the distribution of vulnerability and the communication of possible risk is hard to achieve. The spa-tial vulnerability approach offers the opportunity to visualise susceptibility for all and facilitates the exploration of inter-vention options with all. First feedback from disaster man-agement experts indicate that the approach helps to improve the design of measures aimed at strengthening preparedness and mitigation. From this point of view, we reach a step closer towards validation of the proposed method, compris-ing critical user-oriented aspects like adequateness, practica-bility and usapractica-bility of the provided results in general.
Acknowledgements. The authors would like to thank M. Leidel for data processing and fruitful and critical discussions. The research leading to these results has received funding from European Community’s Sixth Framework Programme (FP6, 2002–2006) under Grant Agreement Number FP 6-036952 (BRAHMATWINN – Twinning European and South Asian River Basins to enhance
capacity and implement adaptive management approaches;
http://www.brahmatwinn.uni-jena.de/).
Edited by: T. Glade
Reviewed by: S. Fuchs and G. Hufschmidt
References
Beinat, E.: Value Functions for Environmental Management, Kluwer Academic Pub., 1997.
Birkmann, J. (ed.): Measuring Vulnerability to Natural Hazards, Towards Disaster Resilient Societies, United Nations University Press, 2006.
Bogardi, J., Villagr´an, J. C., Birkmann, J., Renaud, F., Sakulski, D., Chen, X., Affeltranger, B., Mensa, A., and Kaplan, M.: Vulnera-bility in the context of climate change, Human Security and Cli-mate Change, An International Workshop, Asker, Sweden, 2005. Carver, S. J.: Integrating multi-criteria evaluation with geographi-cal information systems. Int. J. Geogr. Inf. Sci., 5(3), 321–339, doi:10.1080/02693799108927858, 1991.
Clark, M. J., Hutton, C. W., Amoaka Johnson, F., Steyl, I., Kien-berger, S., Zeil, P., and Lang, S.: Defining vulnerability Towards a conceptual model for climate change impact, Deliverable Re-port Nr 4.5, 2007.
Collins, T. W., Grineski, S. E., and Romo Aguilar, M. L.: Vulnerability to environmental hazards in the Ciudad Jua’rez
(Mexico) – El Paso (USA) metropolis: A model for
spa-tial risk assessment in transnational context, Appl. Geogr., doi:10.1016/j.apgeog.2008.10.005, in press, 2008.
Cutter, S. L.: Vulnerability to Environmental Hazards, Prog. Hum. Geog., 20, 52–539, doi:10.1177/030913259602000407, 1996. Cutter, S. L., Mitchell, J. T., and Scott, M. S.: Revealing the
Vul-nerability of People and Places: A Case Study of Georgetown County, South Carolina, Ann. Assoc. Am. Geogr., 90(4), 713– 737, doi:10.1111/0004-5608.00219, 2000.
Cutter, S. L.: The Geography of Social Vulnerability: Race, Class, Catastrophe, Perspectives from the Social Sciences, online avail-able at: http://understandingkatrina.ssrc.org/Cutter/, 2005. Cutter, S. L., Barnes, L., Berry, M., Burton, C., Evans, E., Tate,
J., and Webb, J.: A place-based model for understanding com-munity resilience to natural disasters, Glob. Environ. Chang., 18, 598–606, doi:10.1016/j.gloenvcha.2008.07.013, 2008.
Dilley, M., Chen, R. S., Deichmann, U., Lerner-Lam, A. L., and Arnold, M.: Natural Disaster Hotspots, A Global Risk Analysis, World Bank, 2005.
Ebohon, B. and Schrott, L.: Modeling Mountain Permafrost Distri-bution. A New Permafrost Map of Austria, in: Proceedings of the Ninth International Conference on Permafrost, edited by: Kane, D. and Hinkel, K.: Fairbanks, Alaska, 397–402, 2008.
European Commission: Guidance for the analysis of Pressures and Impacts in accordance with the Water Framework Directive, Board of Water Directors, 2002a.
European Commission: Analysis of pressures and impacts the key implementation requirements of the water framework directive policy summary to the guidance document, Board of Water Di-rectors, 2002b.
European Commission: Pressure and Impacts Analysis, Board of Water Directors, 2002c.
Fekete, A.: Validation of a social vulnerability index in context to river-floods in Germany, Nat. Hazards Earth Syst. Sci., 9, 393– 403, 2009,
http://www.nat-hazards-earth-syst-sci.net/9/393/2009/.
Fl¨ugel, W.: Hydrological Response Units (HRU’s) as modelling en-tities for hydrological river basin simulation and their method-ological potential for modelling complex environmental process systems – Results from the Sieg catchment, Die Erde, 127, 43– 62, 1996.
Gall, M.: Indices of Social Vulnerability to Natural Hazards: A Comparative Evaluation, PhD, University of South Carolina, Columbia, SC, USA, 2007.
Greiving, S., Fleischhauer, M., and L¨uckenk¨otter, J.: A method-ology for an integrated risk assessment of spatially relevant hazards, Journal of Environmental Planning and Management, 49(1), 1–19, doi:10.1080/09640560500372800, 2006.
Helmer, O.: The Use of the Delphi Technique in Problems of Edu-cational Innovations, Rand Documents No. P-3499 (Santa Mon-ica: The Rand Corporation), 1966.
Hewitt, K. and Burton, I.: The Hazardousness of a Place: A Re-gional Ecology of Damaging Events, Department of Geography Research publication 6, University of Toronto, Toronto, Canada, 1971.
Hufschmidt, G., Crozier, M., and Glade, T.: Evolution of natural risk: research framework and perspectives, Nat. Hazards Earth Syst. Sci., 5, 375–387, 2005,
http://www.nat-hazards-earth-syst-sci.net/5/375/2005/.
IPCC (Intergovernmental Panel on Climate Change): Climate
Change 2001: Synthesis report, World Meteorological Organi-zation, UN Environment Programme, Geneva, 2001a.
IPCC (Intergovernmental Panel on Climate Change): Climate
Change 2001: Impacts, Adaptation and Vulnerability. Contribu-tion to the Working Group I to the third assessment report of the Intergovernmental Panel on Climate Change (IPCC), Cambridge University Press, Cambridge, 2001b.
Jiang, H. and Eastman, J. R.: Application of fuzzy measures in multi-criteria evaluation in GIS, Int. J. Geogr. Inf. Sci., 14(2), 173–184, doi:10.1080/136588100240903, 2000.
Kienberger, S., Lang, S., and Tiede, D.: Socio-economic vulnera-bility units – modelling meaningful spatial units, Proceedings of the GIS Research UK 16th Annual conference GISRUK 2008, Manchester, UK, 2008.
Kienberger, S., Amoaka Johnson, F., Zeil, P., Hutton, C. W., Lang, S., and Clark, M.: The integration of Land Use/Land Cover data within the modelling of socio-economic vulnerabilities. Proceed-ings of the 10th High Mountain Remote Sensing and Cartogra-phy Symposium, Kathmandu, Nepal, 2009.
Lang, S. and Blaschke, T.: Bridging remote sensing and GIS – what are the most supportive pillars?, in: International Archives of Photogrammetry, edited by: Lang, S. and Blaschke, T., Remote Sensing and Spatial Information Sciences vol. XXXVI-4/C42, CD-ROM, 2006.
Lang, S.: Object-based image analysis for remote sensing applica-tions: modeling reality – dealing with complexity, in: Object-Based Image Analysis – Spatial concepts for knowledge-driven remote sensing applications, edited by: Blaschke, T., Lang, S., Hay, G. J., et al., New York, Springer, USA, 3–28, 2008. Lang, S., Zeil, P., Kienberger, S., and Tiede, D.: Geons –
policy-relevant geo-objects for monitoring high-level indicators, in: Geospatial Crossroads @ GI Forum ’08, edited by: Car, A., Griesebner, G. and Strobl, J., Proceedings of the Geoinformat-ics Forum Salzburg, 180–185, 2008.
Leidel, M.: Enhancement of the concept of vulnerability units and its integration into water resources management, MSc., TU Mu-nich, Germany, 2008.
Malczewski, J.: GIS and Multicriteria Decision Analysis, John Wi-ley & Sons, 1999.
Malczewski, J.: On the Use of Weighted Linear Combination Method in GIS: Common and Best Practice Approaches, Trans-actions in GIS, 4(1), 5–22, doi:10.1111/1467-9671.00035, 2000.
Mennis, J.: Generating Surface Models of Population
Us-ing Dasymetric MappUs-ing, The Prof. Geogr., 55(1), 31–42, doi:10.1111/0033-0124.10042, 2003.
November, V.: Spatiality of risk, Environ. Plann. A, 40, 1523–1527, doi:10.1068/a4194, 2008.
Oberndorfer, S., Fuchs, S., Rickenmann, D., and Andrecs, P.: Vulnerabilit¨atsanalyse und monet¨are Schandensbewer-tung von Wildbachereignissen in ¨Osterreich, Schriftenreihe des Bundesforschungs- und Ausbildungszentrums f¨ur Wald, Naturgefahren und Landschaft, 139, 2007.
Openshaw, S.: The modifiable areal unit problem, Concepts and techniques in modern geography, 38, 1984
Robinson, V. B.: A perspective on the fundamentals of Fuzzy Sets and their Use in Geographic Information Systems, Transactions in GIS, 7(1), 3–30, doi:10.1111/1467-9671.00127, 2003. Schneiderbauer, S.: Risk and Vulnerability to Natural Disasters
– from Broad View to Focused Perspective: Theoretical back-ground and applied methods for the identification of the most en-dangered populations in two case studies at different scales, Dis-sertation at the Fachbereich Geowissenschaften der Freien Uni-versit¨at Berlin, Germany, 2007.
Smeets, E. and Weterings, R.: Environmental Indicators: Typology and Overview, Technical report no. 25, Copenhagen: European Environment Agency, 1999.
Smith, B.: On drawing lines on a map, in: Proceedings of COSIT 1995, Spatial Information Theory, edited by: Frank, A., Kuhn, W., and Mark, D. M., Springer, Berlin, 475–484, 1995. Smith, B. and Mark, D. M.: Ontology and Geographic Kinds,
Pro-ceedings, International Symposium on Spatial Data Handling (SDH’98), Vancouver, Canada, 12–15 July, 308–320, 1998.
Stalzer, W.: Bestandsaufnahme und Beurteilung der gesamten Hochwasserfolgen, ¨OWAV Symposium, M¨arz 2003, Wien, 2003. Tiede, D. and Lang, S.: Analytical 3-D views and virtual globes – scientific results in familiar spatial context, ISPRS Journal of Photogrammetry and Remote Sensing, Theme issue: Visualiza-tion and ExploraVisualiza-tion of Geospatial Data, pages pending, in press, 2009.
Thomalla, F., Downing, T., Spanger-Siegfried, E., Han, G., and Rockstr¨om, J.: Reducing hazard vulnerability: towards a common approach between disaster risk reduction and cli-mate adaptation, Disasters, 30(1), 39–48, doi:10.1111/j.1467-9523.2006.00305.x, 2006.
Thywissen, K.: Components of Risk. A Comparative Glossary, UNU Institute for Environment and Human Security, Source Nr. 2, 2006.
Turner II, B. L., Matson, P. A., McCarthy, J. J., Corell, R. W., Chris-tensen, L., Eckley, N., Hovelsrud-Broda, G. K., Kasperson, J. X., Kasperson, R. E., Luers, A., Martello, M. L., Mathiesen, S., Naylor, R., Polsky, C., Pulsipher, A., Schiller, A., Selin, H., and Tyler, N.: Illustrating the coupled human–environment system for vulnerability analysis: Three case studies, P. Natl. Acad. Sci. USA., 100, 8080–8085, doi:10.1073/pnas.1231334100, 2003. UN/ISDR (International Strategy for Disaster Reduction): Living
with Risk: A Global Review of Disaster Reduction Initatives, Geneva: UN Publications, 2004.
Villagr´an, J. C. V.: Vulnerability: a conceptual and methodologi-cal review, UNU Institute for Environment and Human Security, Source Nr. 4, 2006.


![Fig. 5. Workflow to generate vulnerability units at the differentlevels (indicator level [1], domain level [2] and final vulnerabilityunits [3]).](https://thumb-us.123doks.com/thumbv2/123dok_us/8430283.1387821/6.595.57.279.67.336/workow-generate-vulnerability-differentlevels-indicator-domain-nal-vulnerabilityunits.webp)


