University of Pennsylvania
ScholarlyCommons
Publicly Accessible Penn Dissertations
1-1-2012
Development of a High Throughput Assay to
Optimize Hematopoietic Differentiation of
Human Pluripotent Stem Cells
Joel Thomas Outten
University of Pennsylvania, [email protected]
Follow this and additional works at:http://repository.upenn.edu/edissertations Part of theBiomedical Commons, and theCell Biology Commons
Recommended Citation
Outten, Joel Thomas, "Development of a High Throughput Assay to Optimize Hematopoietic Differentiation of Human Pluripotent Stem Cells" (2012).Publicly Accessible Penn Dissertations. 559.
Development of a High Throughput Assay to Optimize Hematopoietic
Differentiation of Human Pluripotent Stem Cells
Abstract
Human embryonic stem cells (hESCs) offer the potential to develop in vitro protocols for the generation of any human somatic cell. In order for protocols to allow for both comprehension of underlying developmental mechanics and future clinical application, they will need to rely upon efficient differentiation of cells without the reliance upon animal-derived components. This thesis presents the development of a 96-well plate culture system that allows 4-color, flow cytometry based high throughput screening of defined, serum-free hESC differentiation conditions. In the first portion, broad applicability is proven by demonstrating highly efficient differentiation toward the three primary germ layers. Using four separate biomarkers, we were able to
distinguish between ectoderm, endoderm, mesoderm and pluripotent hESCs. We demonstrated the ability to perform both cytokine screens and siRNA-mediated knockdown in this assay. In the second portion, we establish conditions to apply this assay to study hematopoietic differentiation. We performed numerous cytokine and inhibitor screens to develop a stepwise protocol that generates high yields of primitive megakaryocyte-erythromyeloid progenitors and megakaryocytes after 8 and 11 days of embryoid body differentiation, respectively. This work provides a novel tool to streamline the development of hESC differentiation protocols and advances the hematopoietic field towards future hESC-derived therapies.
Degree Type
Dissertation
Degree Name
Doctor of Philosophy (PhD)
Graduate Group
Bioengineering
First Advisor
Scott L. Diamond
Keywords
Differentiation, Embryonic stem cells, Hematopoiesis, High Throughput Screening, Megakaryocytes, Pluripotent stem cells
Subject Categories
DEVELOPMENT OF A HIGH THROUGHPUT ASSAY TO
OPTIMIZE HEMATOPOIETIC DIFFERENTIATION OF
HUMAN PLURIPOTENT STEM CELLS
Joel Thomas Outten
A DISSERTATION in
Bioengineering
Presented to the Faculties of the University of Pennsylvania in Partial Fulfillment of the Requirements for the Degree of Doctor of Philosophy
2012
Supervisor of Dissertation:
Signature_______________________________
Dr. Scott L. Diamond, Arthur E. Humphrey Professor of Chemical and Biomolecular Engineering
Graduate Group Chairperson:
Signature_______________________________ Dr. Beth Winkelstein, Professor of Bioengineering
Dissertation Committee:
DEVELOPMENT OF A HIGH THROUGHPUT ASSAY TO OPTIMIZE
HEMATOPOIETIC DIFFERENTIATION OF HUMAN PLURIPOTENT STEM CELLS
COPYRIGHT 2012
Acknowledgements
As with most undertakings in science, this work represents much more of a team effort than the single authorship implies. Firstly, I would like to thank my advisor, Scott Diamond. After spending my first year on a project that was failing miserably, I told Scott that I’d like to start something new. He was extremely supportive throughout this transition and helped create the vision that eventually became this work. Scott has always been enthusiastic, encouraging, patient, and trusting for whatever direction I wanted to take my research. I greatly appreciate his support for bringing an entirely new area (stem cell biology) into his lab.
Hana Oh, Andrew Dolan, Matt Flamm, Tom Colace, Ryan Muthard, Melissa Myint, and Manash Chatterjee for being such delightful lab mates.
Peter Davies, Marvin Jackson, and Janell Petzko ran the IME during this project and each significantly. Peter directed the training grant that funded much of this research and has always been highly interested in this research. I am very thankful for Janell’s assistance with admin duties and for discussing pottery and ceramics techniques. Marvin has been extremely helpful in numerous ways…I greatly appreciate everything he has done from encouraging me to give a chalk talk to throwing happy hours to being up for grabbing Indian buffet lunches.
I cannot express enough gratitude and appreciation for the entire staff of the CHOP hESC/iPS Core. This project began after Scott mentioned that CHOP had just hired a stem cell group interested in doing blood research. I met with both Debbie French and Paul Gadue, who were both extremely enthusiastic about the endeavor. Deb and Paul have both been amazing mentors over the past 4 years. Thank you for providing the expertise and resources necessary for this project to even exist. I can’t express enough how much I’ve enjoyed this collaboration. Thank you to Core Manager Aline Disimone for all the time and effort that you provided…you are amazing. Thanks to Prasuna Palaru, Xin Cheng, and Jay Mills for their constant protocol assistance and for helping me to get new techniques up and running. I am lastly very thankful to everyone in the Core that either fed my cells at some point or simply being a fantastic personality, including Amita Tiyaboonchai, Helen Mac, Spencer Sullivan, Lei Ying, and Lin Lu.
life. This research may have crashed and burned long ago had I not been able to balance my life with Ultimate and such fantastic group of people. More specifically, thank you to Ruth Strickland, Peter Cline, and Ryan Doherty for being such supportive, understanding, imperfect, and amazing friends throughout the time of this research.
ABSTRACT
DEVELOPMENT OF A HIGH THROUGHPUT ASSAY TO OPTIMIZE
HEMATOPOIETIC DIFFERENTIATION OF HUMAN PLURIPOTENT STEM CELLS Joel Thomas Outten
Advisor: Scott L. Diamond
Human embryonic stem cells (hESCs) offer the potential to develop in vitro
Contents
ACKNOWLEDGEMENTS ...III
ABSTRACT... VI
CONTENTS...VIII
LIST OF TABLES ... XI
LIST OF FIGURES ...XII
1. INTRODUCTION...1
1.1 HUMAN EMBRYONIC STEM CELLS...1
1.2 MAMMALIAN DEVELOPMENT...1
1.3 DIFFERENTIATION SYSTEMS...3
1.3.1 Embryoid body culture...3
1.3.2 Adherent and stromal cell co-culture ...5
1.4 SERUM-FREE DIFFERENTIATION MEDIA...6
1.5 SMALL SCALE PLATFORMS...6
2. MATERIALS AND METHODS ...8
2.1 HESC MAINTENANCE...8
2.2 HESC DIFFERENTIATION...8
2.2.1 Germ layer differentiation ...8
2.2.2 Hematopoietic differentiation ...10
2.3.1 Germ layer differentiation ...11
2.3.2 Hematopoietic differentiation ...13
2.4 REAL-TIME QUANTITATIVE PCR...13
2.5 SIRNA KNOCKDOWN...14
2.6 COLONY FORMING ASSAYS...15
2.7 HEMATOLOGIC STAINS...15
3. DEVELOPMENT OF A 96-WELL HESC DIFFERENTIATION ASSAY...17
3.1 ABSTRACT...17
3.2 INTRODUCTION...18
3.3 RESULTS...20
3.3.1 EB differentiation in 96-well format ...20
3.3.2 Gene expression verification of induced germ layers...29
3.3.3 96-well growth factor screening assay ...31
3.3.4 Tracking germ layer differentiation through gene expression kinetics ...33
3.3.5 siRNA knockdown during endoderm differentiation...35
3.4 DISCUSSION...38
4. OPTIMIZING HEMATOPOIETIC DIFFERENTIATION ...43
4.1 ABSTRACT...43
4.2 INTRODUCTION...44
4.2.1 Primitive hematopoiesis...44
4.2.2 In vitro hematopoietic hESC systems...45
4.3.1 VEGF hematopoietic differentiation screen ...47
4.3.2 Hematopoietic differentiation in 96-well format ...49
4.3.3 Optimizing KDR+CD31+ and CD31+CD43+ differentiation...59
4.3.4 Cytokine screen to enhance CD43+ progenitor differentiation and megakaryopoiesis...73
4.4 DISCUSSION...79
5. CONCLUSIONS, LIMITATIONS, AND FUTURE WORK ...84
5.1 CONCLUSIONS...84
5.2 LIMITATIONS & PITFALLS...86
5.2.1 Flow cytometry...86
5.2.2 EB dissociation ...87
5.3 FUTURE WORK...88
5.3.1 Hematopoietic differentiation ...88
5.3.2 Differentiation assay...90
6. REFERENCES...91
List of Tables
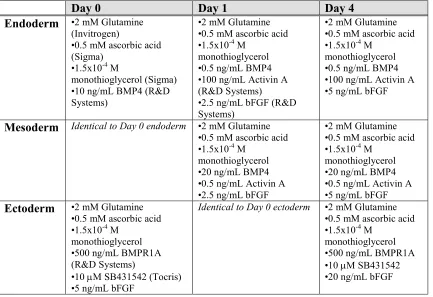
Table 2.1. Differentiation media for germ layer induction ... 10
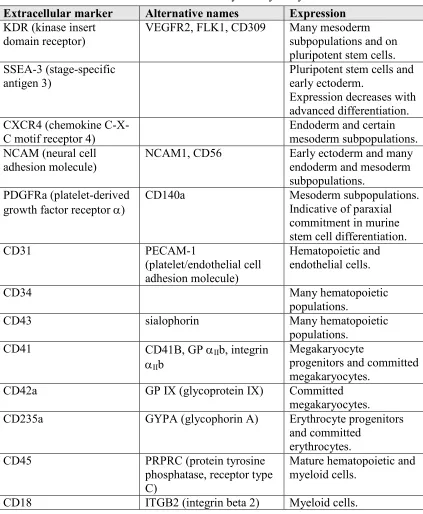
Table 2.2. Extracellular markers used for flow cytometry analyses ... 12
List of Figures
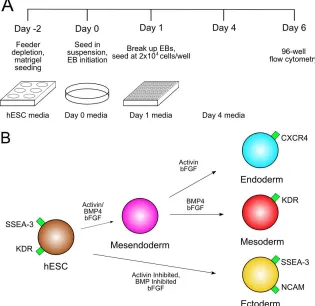
Figure 3.1. Experiment schematic and differentiation model...22
Figure 3.2. Biomarker time-course analysis ...23
Figure 3.3. Mesoderm and ectoderm differentiation time course biomarker expression .24 Figure 3.4. Day 6 phenotypes after differentiation to the three germ layers ...26
Figure 3.5. Differentiation culture cell yield analysis...27
Figure 3.6. hESC seeding density analysis ...28
Figure 3.7. Germ layer gene expression analysis...30
Figure 3.8. 96-well plate growth factor screening analysis ...32
Figure 3.9. Gene expression kinetic analysis...34
Figure 3.10. siRNA-mediated RFP knockdown during endoderm differentiation...37
Figure 4.1. VEGF and BMP4 hematopoiesis screen. ...48
Figure 4.2. 96-well hematopoietic differentiation setup and day 4 ...51
Figure 4.3. Day 8 hematopoietic cells...52
Figure 4.4. Day 8 separated EBs and single cells ...53
Figure 4.5. Schematic of 6-well scaled up procedure and single cell progenitor assays ..55
Figure 4.6. Phenotype of day 7 cells...56
Figure 4.7. Hematopoietic colony potential of isolated day 7 single cells ...57
Figure 4.8. Hematopoietic differentiation phenotypes of day 7 + 4 cells...58
Figure 4.9. Hematopoietic differentiation phenotypes of day 7 + 10 cells...59
Figure 4.10. Simplified schematic of Chir-induced b-Catenin nuclear translocation ...60
Figure 4.11. KDR-CD31 profiles for Chir, BMP4, VEGF Screen ...62
Figure 4.12. Day 3 results of the hematopoietic screen with Chir...64
Figure 4.13. Day 5 results of the hematopoietic screen with Chir...66
Figure 4.14. Day 5 viability ...67
Figure 4.15. Day 8 results of the hematopoietic screen with Chir...68
Figure 4.16. Day 11 results of the hematopoietic screen with Chir...70
Figure 4.17. Differentiation yields throughout 11 days of differentiation...72
Figure 4.18. Experiment schematic and day 8 hematopoietic cells ...74
Figure 4.19. Day 11 CD43+ hematopoietic populations ...75
Figure 4.20. Day 11 CD41+ hematopoietic populations ...77
Figure 4.21. Day 11 CD42+ megakaryocyte populations...78
1. Introduction
1.1 Human embryonic stem cells
The isolation of human embryonic stem cells (hESCs) in 1998 [1] has revolutionized the field of regenerative medicine. hESCs, isolated from human blastocysts, exhibit pluripotency and can thus be theoretically induced to generate any somatic human cell. These cells offer new approaches to study human development and organogenesis, screen candidate drug molecules for toxicities, treat previously incurable pathologies, generate lines of desired cell types, and study disease mechanisms. Studies are increasingly being undertaken in all of these areas. While these cells have vast scientific and medical potential, progress relies on scientists to identify repeatable techniques to control differentiation outcome. Initial studies identified basic conditions to differentiate cells to the three primary germ layers [2, 3]. Somatic adult cells, in contrast, require lengthy differentiation pathways that must be tightly controlled and are infrequently understood. Increasingly more studies focus on defining protocols by which to differentiate hESCs to target cell lineages.
1.2 Mammalian development
through the primitive streak and differentiate into either mesoderm or definitive endoderm. Epiblast cells that do not migrate through the streak will form the ectoderm. These three germ layers eventually differentiate into all the cells and tissues of the body [4].
Gastrulation, as well as the entire process of development, is a highly coordinated, delicate interplay of growth factors and cytokines secreted and received at just the right moments. The primitive streak itself is initiated by coordinated expression of the transforming growth factor-beta (TGF-b) family members Nodal and bone morphogenic protein 4 (BMP4) and members of the Wnt family. The local concentration of these growth factors induces streak cells to migrate and begin differentiating toward the mesoderm and endoderm lineages. The extraembryonic endoderm secretes BMP4 during gastrulation. A BMP4 diffusion gradient is thus formed in which posterior primitive streak cells receive the highest exposure and anterior cells receive the lowest. BMP4 promotes mesoderm, inducing posterior streak cells to differentiate down this lineage. Conversely, high concentrations of Nodal, secreted by the node by late-streak stage, promote anterior streak cells to become definitive endoderm. Members of the fibroblast growth factor (FGF) family, including FGF4 and FGF8, are also required for primitive streak formation and gastrulation. The signaling pathways utilized during development are thoroughly reviewed in Gadue et al. [5] and Murry and Keller [6].
studies can help elucidate pathways and developmental mechanisms to give a greater understanding of in vivo embryogenesis.
1.3 Differentiation systems
Although scientists frequently know what target cell they aim to generate, the most appropriate path of differentiation is generally more elusive. Three primary methods have been utilized to support differentiation systems: 1) embryoid body (EB) suspension culture, 2) adherent culture, and 3) co-culture with another cell line. Although the technique of choice depends upon the goal, the vast majority of studies have relied upon EB culture, and many protocols incorporate multiple methods.
1.3.1 Embryoid body culture
Hanging Drops
Although becoming less common, hanging drops have traditionally been widely used as a reliable method of generating consistent EBs of known size[8]. Individual drops of medium containing cells at a known density are attached to the underside of a plastic petri dish lid. Cells aggregate in the rounded bottom of each drop and form an EB of defined cell number. This method is becoming less common due to the time required to seed and harvest EBs.
Liquid suspension culture
Many studies have relied on seeding single cells or clumps of ESCs into 6 to 24-well culture plates. EBs are formed either from spontaneous aggregation or from non-dissociated clusters of cells [2, 9]. Due to the uncontrolled environment, EBs tend to be heterogenous in these systems[7]. EBs also have the potential to aggregate together during differentiation [10]. Rotary culture of EBs during differentiation has been demonstrated to induce homogenous EBs and increase yield and differentiation efficiency, albeit through an unknown mechanism [11]. More recently, groups have utilized micro-scale conical-patterned well inserts to generate hundreds of thousands of EBs from centrifugation of cells prior to seeding EBs in liquid suspension differentiation culture [12]. Similar technologies are now commercially available.
Methylcellulose culture
been used mostly for hematopoietic differentiation, but has become less frequent due to the difficulty of harvesting cells from methylcellulose.
Large scale bioreactors
Many commercial and therapeutic applications of ESC protocols will require extremely large amounts of cells, negating the reliance on standard cell culture systems. Bioreactor systems can be scaled to meet such demands. As with liquid culture systems, multiple EBs can aggregate in such systems, reducing the homogeneity of EB populations. In order to minimize this phenomenon, EB formation is completed ahead of time, for instance in hanging drops[14], and then transferred to bulk stirred suspension cultures.
1.3.2 Adherent and stromal cell co-culture
the fetal liver, and the bone marrow have all been utilized to efficiently differentiate ESCs towards the hematopoietic lineage [15].
1.4 Serum-free differentiation media
Early ESC protocols relied on the use of serum containing media due to the enhanced viability and efficient differentiation [1, 16-18]. However, serum contains a plethora of unknown factors, is significantly variable between lots, and is not clinically applicable. To overcome these limitations, more recent feeder-free studies have focused on identifying serum-free media formulations [19-21]. Numerous combinations of cytokines, growth factors, and siRNA molecules are being evaluated in order to understand signaling pathways utilized during differentiation and to optimize differentiation protocols to target cell types. By precisely activating or inhibiting the TGFb family, FGF, Wnt, and other pathways at specific times, the developing embryo directs differentiation to all somatic cells of the body [5]. In vitro hESC differentiation systems attempt to recapitulate these developmental pathways by utilizing controlled concentrations of cytokines and inhibitors. As differentiation proceeds down specific lineages, the possible number of cytokine combinations dramatically increases.
1.5 Small scale platforms
2. Materials and Methods
2.1 hESC maintenance
HES2 (passage 26-34) and H9 cells (passage 35-65) were maintained on irradiated mouse embryonic fibroblasts (MEFs) in hESC maintenance medium consisting of DMEM/F12 50:50 (Mediatech) supplemented with 20% Knockout Serum (Invitrogen, Carlsbad, CA), 1x non-essential amino acids (Invitrogen), 0.55 mM b-mercaptoethanol, 1% penicillin/streptomycin, 2 mM glutamine (Invitrogen), and 20 ng/mL bFGF (R&D Systems, Minneapolis, MN). Cells were passaged at 1:3-1:6 ratios using 0.25% trypsin/EDTA (Mediatech, Manassas, VA) or TrypLE Express (Invitrogen). For siRNA experiments, a previously established HES2 line was utilized that expresses a red fluorescent protein (RFP) from the hROSA26 locus (HES2-R26) [30].
2.2 hESC differentiation
2.2.1 Germ layer differentiation
cell scraper, spun down, and resuspended in SFD medium supplemented with penicillin/streptomycin, 2 mM glutamine, 0.5 mM ascorbic acid (Sigma), 1.5x10⁻⁴ M monothioglycerol (Sigma), and the specified concentrations of cytokines as indicated (summarized in Table 2.1). Day 0 media was supplemented with: 10 ng/mL BMP4 (R&D Systems) for endoderm/mesoderm or 10 mM SB431542 (Tocris, Ellisville, MO), 500 ng/mL BMPR1A (R&D Systems), and 5 ng/mL bFGF (R&D Systems, Minneapolis, MN) for ectoderm. 2x10⁶ cells were seeded into 10-cm petri dishes and cultured at 5% CO2/5% O2/90% N2. After 24 hours, EBs were harvested, manually disrupted, and
seeded into 100 mL Day 1 medium into low-cluster 96-well plates (Corning, Corning, NY) at 2x10⁵ cells/mL (2x10⁴ cells/well). Endoderm Day 1 medium was supplemented with 100 ng/mL activin A (R&D Systems), 2.5 ng/mL bFGF, 0.5 ng/mL BMP4.
Mesoderm Day 1 medium was supplemented with 0.5 ng/mL activin A, 2.5 ng/mL bFGF, and 20 ng/mL BMP4. Ectoderm Day 1 medium was supplemented with 5 ng/mL bFGF, 10 mM SB431542, and 500 ng/mL BMPR1A. For growth factor screening experiments, Day 1 media contained 2.5 ng/mL bFGF, and activin A and BMP4 were utilized at concentrations of 0 to 100 ng/mL, as indicated. At Day 4, 200 mL of Day 4 media were added to each well. Day 4 mesoderm and endoderm media were identical to Day 1 media, but with 5 ng/mL bFGF. Day 4 ectoderm medium was identical to Day 1 medium with 20 ng/mL bFGF. For growth factor screening experiments, media were supplemented with 5 ng/mL bFGF, the indicated concentrations of activin A and BMP4, and ± 10 ng/mL VEGF165 (R&D Systems). During incubation, 96-well plates were
Table 2.1. Differentiation media for germ layer induction
2.2.2 Hematopoietic differentiation
Cells were harvested from matrigel upon reaching 70-80% confluency by enzymatic cleavage with TrypLE Express for 4 min at RT. Cells were removed with a cell scraper, spun down at 1200 rpm for 3 min, and resuspended in differentiation buffer. Differentiation medium consisted of StemPro-34 serum-free medium (SP34 SFM; Invitrogen) supplemented with penicillin/streptomycin, 2 mM glutamine, 0.5 mM ascorbic acid, 1.5x10⁻⁴ M monothioglycerol, and growth factors and inhibitors as specified in Results. Resuspended cell clusters were partially disrupted by pipetting up and down 3-4 times with a serological pipet. Depending upon experiment, the following cytokines and inhibitors were added at specified concentrations at designated stages of
Day 0 Day 1 Day 4
Endoderm •2 mM Glutamine (Invitrogen)
•0.5 mM ascorbic acid (Sigma)
•1.5x10⁻⁴ M
monothioglycerol (Sigma) •10 ng/mL BMP4 (R&D Systems)
•2 mM Glutamine •0.5 mM ascorbic acid •1.5x10⁻⁴ M
monothioglycerol •0.5 ng/mL BMP4 •100 ng/mL Activin A (R&D Systems)
•2.5 ng/mL bFGF (R&D Systems)
•2 mM Glutamine •0.5 mM ascorbic acid •1.5x10⁻⁴ M
monothioglycerol •0.5 ng/mL BMP4 •100 ng/mL Activin A •5 ng/mL bFGF
Mesoderm Identical to Day 0 endoderm •2 mM Glutamine •0.5 mM ascorbic acid •1.5x10⁻⁴ M
monothioglycerol •20 ng/mL BMP4 •0.5 ng/mL Activin A •2.5 ng/mL bFGF
•2 mM Glutamine •0.5 mM ascorbic acid •1.5x10⁻⁴ M
monothioglycerol •20 ng/mL BMP4 •0.5 ng/mL Activin A •5 ng/mL bFGF
Ectoderm •2 mM Glutamine •0.5 mM ascorbic acid •1.5x10⁻⁴ M
monothioglycerol •500 ng/mL BMPR1A (R&D Systems)
•10 mM SB431542 (Tocris) •5 ng/mL bFGF
Identical to Day 0 ectoderm •2 mM Glutamine •0.5 mM ascorbic acid •1.5x10⁻⁴ M
differentiation as described in Results: 0-40 ng/mL BMP4, 0-100 ng/mL VEGF, 5-10 ng/mL bFGF, TPO, Flt3-L, IL-3, IL-6 (all R&D Systems), Chir-99021 (Stemgent), and Y-27632 (Tocris). Cells were seeded at 20,000 cells/well into 96-well ultra-low attachment plates. To isolate day 7 single cells for further differentiation and methylcellulose cultures, wells were pooled and EBs allowed to settle for several minutes. Supernatant was then withdrawn to extract single cells. For further hematopoietic differentiation, single cells were transferred to 6-well ultra-low adherence plates and cultured in SP34 based medium supplemented with penicillin/streptomycin, 2 mM glutamine, 0.5 mM ascorbic acid, 1.5x10⁻⁴ M monothioglycerol, 50 ng/mL SCF, 100 ng/mL TPO, 2 U/mL EPO, 25 ng/mL Flt3-L, 10 ng/mL IL-6, and 10 ng/mL IL-3.
2.3 96-well flow cytometry
2.3.1 Germ layer differentiation
Arbor, MI) and analyzed using CFlow Plus software (Accuri) or FlowJo (Treestar, Ashland, OR). Markers utilized for flow cytometry are given in Table 2.2.
Table 2.2. Extracellular markers used for flow cytometry analyses
Extracellular marker Alternative names Expression
KDR (kinase insert domain receptor)
VEGFR2, FLK1, CD309 Many mesoderm subpopulations and on pluripotent stem cells. SSEA-3 (stage-specific
antigen 3)
Pluripotent stem cells and early ectoderm.
Expression decreases with advanced differentiation. CXCR4 (chemokine
C-X-C motif receptor 4) Endoderm and certain mesoderm subpopulations. NCAM (neural cell
adhesion molecule)
NCAM1, CD56 Early ectoderm and many endoderm and mesoderm subpopulations.
PDGFRa (platelet-derived growth factor receptor a)
CD140a Mesoderm subpopulations. Indicative of paraxial commitment in murine stem cell differentiation. CD31 PECAM-1
(platelet/endothelial cell adhesion molecule)
Hematopoietic and endothelial cells.
CD34 Many hematopoietic
populations.
CD43 sialophorin Many hematopoietic populations.
CD41 CD41B, GP aIIb, integrin aIIb
Megakaryocyte
progenitors and committed megakaryocytes.
CD42a GP IX (glycoprotein IX) Committed megakaryocytes. CD235a GYPA (glycophorin A) Erythrocyte progenitors
and committed erythrocytes. CD45 PRPRC (protein tyrosine
phosphatase, receptor type C)
Mature hematopoietic and myeloid cells.
2.3.2 Hematopoietic differentiation
EBs were dissociated with either 0.25% trypsin/EDTA or with Collagenase B (Roche) followed by Accutase (Invitrogen). Antibodies utilized were: rat anti-SSEA-3-Alexa 488, mouse anti-KDR-anti-SSEA-3-Alexa 647 (Biolegend), mouse anti-CD31 PE/Cy7 (Biolegend), mouse anti-CD34 Alexa 488 (Biolegend), mouse anti-CD43 FITC (Biolegend), mouse anti-CD43 PE (Biolegend), mouse anti-CD41 APC (Biolegend), mouse CD41 PE (Biolegend), mouse CD42a PE (BD Pharmingen), mouse anti-CD45 PE/Cy7 (Biolegend), and mouse anti-CD235a APC (BD Pharmingen). Cells were analyzed with 96-well flow cytometry as discussed previously.
2.4 Real-time quantitative PCR
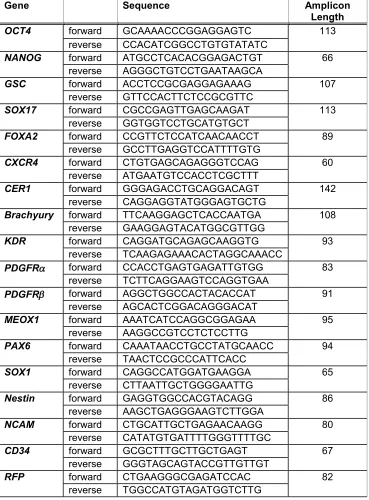
Table 2.3. Primers utilized for real-time quantitative PCR analysis
2.5 siRNA knockdown
HES2 cells stably expressing RFP (HES2-R26 cells) [30] were reverse transfected at the time of 96-well plate seeding at Day 1. 2x10⁴ cells in 100 uL of day 1 endoderm
Gene Sequence Amplicon
Length
OCT4 forward GCAAAACCCGGAGGAGTC 113
reverse CCACATCGGCCTGTGTATATC
NANOG forward ATGCCTCACACGGAGACTGT 66
reverse AGGGCTGTCCTGAATAAGCA
GSC forward ACCTCCGCGAGGAGAAAG 107
reverse GTTCCACTTCTCCGCGTTC
SOX17 forward CGCCGAGTTGAGCAAGAT 113
reverse GGTGGTCCTGCATGTGCT
FOXA2 forward CCGTTCTCCATCAACAACCT 89
reverse GCCTTGAGGTCCATTTTGTG
CXCR4 forward CTGTGAGCAGAGGGTCCAG 60
reverse ATGAATGTCCACCTCGCTTT
CER1 forward GGGAGACCTGCAGGACAGT 142
reverse CAGGAGGTATGGGAGTGCTG
Brachyury forward TTCAAGGAGCTCACCAATGA 108
reverse GAAGGAGTACATGGCGTTGG
KDR forward CAGGATGCAGAGCAAGGTG 93
reverse TCAAGAGAAACACTAGGCAAACC
PDGFRa forward CCACCTGAGTGAGATTGTGG 83
reverse TCTTCAGGAAGTCCAGGTGAA
PDGFRb forward AGGCTGGCCACTACACCAT 91
reverse AGCACTCGGACAGGGACAT
MEOX1 forward AAATCATCCAGGCGGAGAA 95
reverse AAGGCCGTCCTCTCCTTG
PAX6 forward CAAATAACCTGCCTATGCAACC 94
reverse TAACTCCGCCCATTCACC
SOX1 forward CAGGCCATGGATGAAGGA 65
reverse CTTAATTGCTGGGGAATTG
Nestin forward GAGGTGGCCACGTACAGG 86
reverse AAGCTGAGGGAAGTCTTGGA
NCAM forward CTGCATTGCTGAGAACAAGG 80
reverse CATATGTGATTTTGGGTTTTGC
CD34 forward GCGCTTTGCTTGCTGAGT 67
reverse GGGTAGCAGTACCGTTGTTGT
RFP forward CTGAAGGGCGAGATCCAC 82
media were seeded onto a 20 mL transfection volume of Optimem I Reduced Serum Media (Invitrogen) containing 0.2 mL RNAiMax per well (Invitrogen) and 10 nM of either a non-specific scramble siRNA (Applied Biosystems, Foster City, CA) or a siRNA designed to target the RFP mRNA (IDT, Coralville, IA). Day 1 total well volume was thus 120 uL. Control samples were seeded into Optimem Media. RNAiMax was utilized due to its high efficiency of delivering siRNA into hESCs [32]. Differentiation was performed as previously described, in which 200 uL medium at Day 4 was subsequently added to each well.
2.6 Colony forming assays
EBs were dissociated as described in flow cytometry. 20,000 cells were diluted 600 uL IMDM supplemented with the following cytokines: 10 U/mL EPO (Amgen), 5 ng/mL GM-SCF (R&D Systems), 10 ng/mL IL-3, and 5 ng/mL GM-CSF (R&D Systems). The cell/cytokine cocktail was transferred to 4 mL thawed methylcellulose medium (MethoCult; StemCell Technologies) and vortexed. 1 mL was transferred to each of 3 35-mm Petri dishes and incubated at 37ºC and 5% CO2 for 12 days.
2.7 Hematologic stains
May-Grunwald fixation buffer, washed twice in dH2O, and stained with Wright-Giemsa stain
3. Development of a 96-well hESC Differentiation
Assay
3.1 Abstract
development of serum-free protocols for hESC differentiation to any target lineage and creates a platform for screening small molecules or RNAi during ESC differentiation.
3.2 Introduction
Human embryonic stem cells (hESCs) offer the potential to regenerate any cell in the human body. Initially, many studies utilized serum-containing media to develop differentiation protocols for target cell types [3, 16-18]. Serum, however, contains unknown and variable concentrations of growth factors and proteins. More recently, serum-free differentiation (SFD) protocols have emerged in order to maximize reproducibility and to gain a more thorough understanding of biological pathways activated during differentiation to specified lineages [19-21, 33]. Numerous combinations of cytokines, growth factors, and siRNA molecules are being evaluated in order to understand signaling pathways utilized during differentiation and to optimize differentiation protocols to target cell types. By precisely activating or inhibiting the TGFb family, FGF, Wnt, and other pathways at specific times, the developing embryo directs differentiation to all somatic cells of the body [5]. In vitro hESC differentiation systems attempt to recapitulate these developmental pathways by utilizing controlled concentrations of cytokines and inhibitors. As differentiation proceeds down specific lineages, the possible number of cytokine combinations dramatically increases. A high throughput screening method that streamlines the analysis of various growth factor combinations and their effect upon differentiation would be extremely beneficial.
al. [22, 23] have developed a 96-well spin embryoid body (EB) technique in which hESCs are spun down to form a single EB of a defined size within each well. This technique has been utilized to optimize differentiation to various stages in the hematopoietic lineage [24, 25]. Koike et al. have developed a 96-well murine ESC (mESC) differentiation system and explored effects of EB seeding density upon differentiation to cardiomyocytes [26, 27]. Due to the small seeding density utilized by both methods to generate single EBs and the tendency for cell counts to drop over the first five days of differentiation [24], it is unclear if enough cells would be available for 96-well flow cytometry analyses without pooling wells. Several studies have utilized an adherent 384-well plate format to screen for small molecule inhibitors or enhancers of ESC differentiation [28, 29]. Although these confocal microscopy-based assays have been utilized to screen several thousand small molecules, they are not conducive to multi-color flow-cytometry or live cell sorting.
We have developed a small scale, flow cytometry-based, high throughput hESC EB differentiation assay. In this study, we differentiate hESCs to the three primary germ layers and demonstrate biomarker profiles unique to each cell type. We obtained high cell yields for each layer with remarkably low well-to-well variability. We also demonstrate the ability to perform small interfering RNA (siRNA)-mediated gene knockdown at this scale without disrupting induced differentiation. These results demonstrate the utility and efficacy of this system for efficiently optimizing SFD conditions and performing siRNA knockdown upon numerous targets.
3.3 Results
3.3.1 EB differentiation in 96-well format
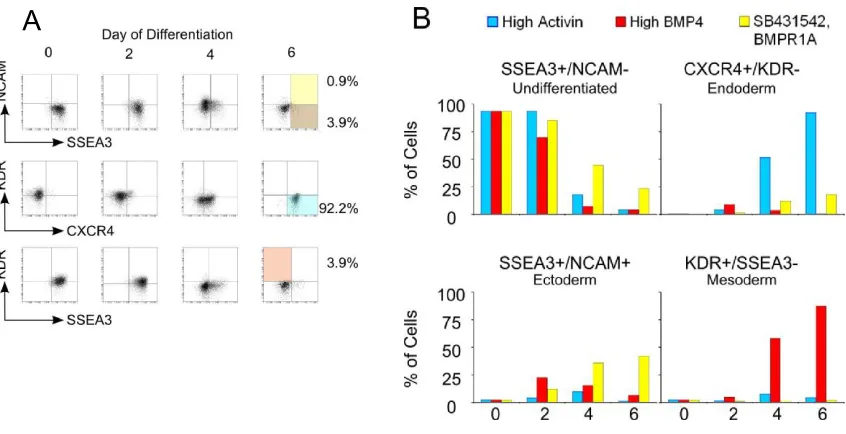
In order to examine inter-well variability and percent differentiation, one 96-well plate was partitioned into 3 induction media zones: endoderm, mesoderm, and ectoderm. We utilized high activin A with bFGF to induce endoderm [16], high BMP4 with bFGF to induce mesoderm [39], and simultaneous activin inhibition (SB431542) and BMP4 inhibition (BMP receptor 1A; BMPR1A) with bFGF to induce ectoderm [50, 51] (Fig. 3.1B). The EBs appeared robust and morphologically similar to those grown in bacterial grade dishes and 6-well plates. 96-well flow cytometry was performed and the different populations of cells were defined from expression of the four biomarkers (Fig. 3.2A-B, Fig. 3.3). HES2 endoderm (CXCR4+KDR-), mesoderm (KDR+SSEA-3-), and ectoderm
Figure 3.2. Biomarker time-course analysis. Germ layer differentiation was initiated at day 0. SSEA-3, NCAM, CXCR4, and KDR surface marker expression was assessed with flow cytometry at days 0, 2, 4, and 6. (A) Endoderm differentiation flow cytometry profiles. Colored quadrants represent undifferentiated cells (brown) and differentiation to endoderm (blue), ectoderm (yellow), and mesoderm (red). Similar mesoderm and ectoderm plots are given in Figure S1. (B) Marker expression profiles for all differentiation conditions over 6 days of differentiation
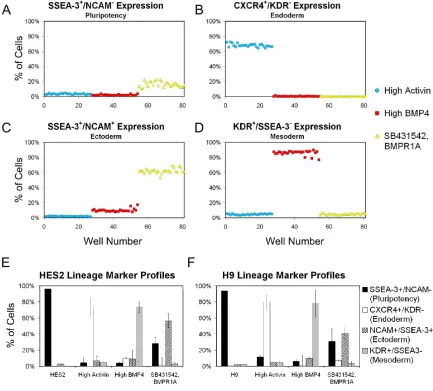
respectively (Fig. 3.4E). H9 cells demonstrated similar yields of 80 ± 11%, 78 ± 7%, and 41 ± 9% for endoderm, mesoderm, and ectoderm, respectively (Fig. 3.4F). Inter-well variability was remarkably low between identical induction conditions (Fig. 3.4A-D), with standard deviations consistently less than 4%. Activin-/BMP-inhibited media
Figure 3.4. Day 6 phenotypes after differentiation to the three germ layers. (A-D)
Inter-well variability for 96-well flow cytometry expression profiles. hESCs were seeded into a 96-well plate and differentiated to endoderm, mesoderm, or ectoderm. Cells were stained for SSEA-3, CXCR4, NCAM, and KDR after 6 days to assess inter-well variability and the ability to distinguish the separate germ layers. Plots show percentages of cells expressing the designated surface marker. (E-F)
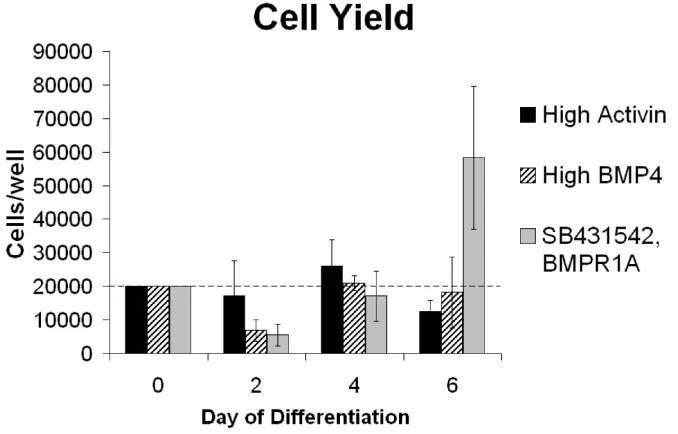
Cells displayed some toxicity after being seeded at day 0 and then demonstrated proliferation after 2 days of differentiation (Fig. 3.5). Both endoderm and mesoderm conditions yielded 4 to 6 day cell counts similar to the initial seeding density of 2x10⁴ cells/well, indicating a potential population plateau for these media. Ectoderm cell yields (day 6 cell counts compared to day 0 seeding densities) were greater than 300% at day 6, possibly attributable to the addition of 20 ng/mL bFGF at day 4. In order to evaluate the
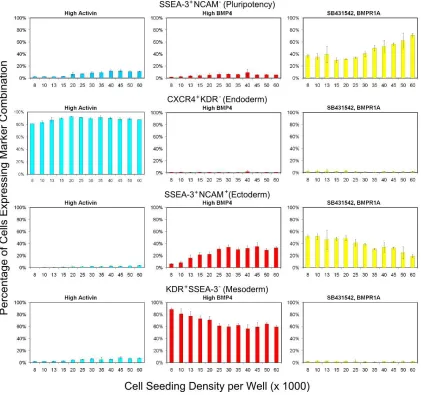
effect of seeding density upon differentiation efficiency, we evaluated day 6 marker expression levels for seeding densities of 8x10³ to 6x10⁴ cells/well (Fig. 3.6). The assay proved to be highly robust for differences in cell densities. Undifferentiated populations increased with increasing densities, as to be expected due to nutrient and cytokine
decreasing trend with increasing seeding density, whereas endoderm efficiency was essentially constant.
The differentiated populations of cells representative of each primary germ layer, as well as undifferentiated hESCs, display a unique biomarker profile (Fig. 3.4E-F). Each cell type was distinguished by increased expression of a combination of biomarkers.
These findings suggest that this 4-biomarker assay can be utilized to distinguish four unique cell types after 6 days of differentiation. Furthermore, the three differentiated cell types have a biomarker profile characteristic of either endodermal, mesodermal, or early ectodermal cells.
3.3.2 Gene expression verification of induced germ layers
In order to verify that the surface marker profiles obtained using flow cytometry corresponded to the anticipated lineages, real-time quantitative PCR (qPCR) was performed on RNA harvested from day 0 hESCs and from cells after 6 days of differentiation in the various differentiation conditions. The pluripotency genes NANOG
and OCT4 were expressed in undifferentiated cells and as expected were downregulated in the three conditions inducing cellular differentiation (Fig. 3.7A). The anterior primitive streak gene FOXA2 was drastically upregulated in the high activin endoderm induction conditions, as were the anterior definitive endoderm genes SOX17 and CER1
defined induction conditions differentiate the cells into lineages representative of endodermal, mesodermal, and early ectodermal germ layers.
Figure 3.7. Germ layer gene expression analysis. Germ layer differentiation was initiated at day 0. (A-D) RNA was prepared from cells harvested at day 0 (hESCs) or day 6 and analyzed for genes characteristic of pluripotency (A), endoderm (B), mesoderm (C), or ectoderm (D) by qPCR. Expression was normalized to the housekeeping gene GAPDH and all values are relative to hESC expression at day 0. Error bars represent mean ± SD of 3 pooled wells from a single plate assay.
A
B
C
3.3.3 96-well growth factor screening assay
had no notable effect upon the expression of this set of cell surface markers (Fig. 3.8A-D).
These data suggest this 96-well flow cytometry assay can be utilized to screen for the effect of a spectrum of growth factor concentrations upon hESC differentiation in
Figure 3.8. 96-well plate growth factor screening analysis. Activin A, BMP4, and VEGF concentrations were varied over a 96-well plate and SSEA-3+ (A), CXCR4+KDR- (B), PDGFRa+ (C), and KDR+SSEA-3- (D) expression were analyzed using flow cytometry after 6 days of differentiation. All samples contained bFGF (days 1-4: 2.5 ng/mL; days 4-6: 5 ng/mL). VEGF concentration was ± 10 ng/mL. (A) Pluripotency decreased with increasing activin A and BMP4.
(B) Endoderm populations increased with increasing activin A and decreased with increasing BMP4. (C-D) Mesoderm character was highest in the absence of activin A. PDGFRa+ mesoderm was only detectable with no activin. KDR+SSEA-3
serum-free conditions. Furthermore, increased concentrations of both activin A and BMP4 reduce pluripotency. Increasing activin A concentration increases CXCR4+KDR -endoderm populations and reduces both KDR+SSEA-3- and PDGFRa+ mesoderm
populations. Conversely, increasing BMP4 concentration increases KDR+SSEA-3 -mesoderm populations but decreases CXCR4+KDR- endoderm populations.
3.3.4 Tracking germ layer differentiation through gene expression kinetics
Kinetic analyses can also be performed during the differentiation assays. By keeping BMP-4 constant at 10 ng/ml, 4 of the previously screened induction conditions were chosen in which 2 were optimal for endoderm (activin A at 20 ng/ml ± 10 ng/mL VEGF) and 2 were optimal for mesoderm (activin A at 0 ng/ml ± 10 ng/mL VEGF). All conditions were carried out on a single 96-well plate. Gene expression profiles were determined from cells obtained during the six days of differentiation. Genes expressed during mesoderm and endoderm induction were analyzed, with the inclusion of OCT4 as a marker of pluripotency in undifferentiated cells.
Mesoderm genes (KDR, PDGFRa, MEOX1, CD34) were consistently expressed at higher levels in the absence of activin A while endoderm genes (FOXA2, CXCR4,
SOX17) were consistently expressed in the presence of activin A (Fig. 3.9). OCT4
expression steadily decreased in all conditions over the 6 day period. Brachyury
Brachyury+KDR+ stage, indicative of pre-mesoderm to mesoderm/hemangioblast differentiation [42, 53]. PDGFRa is a marker of mesendoderm [55] and was expressed in all samples at day 4 followed by increased expression in mesoderm inducing conditions. CXCR4, while expressed 100 fold higher in the activin A conditions, was still upregulated 10-fold in the absence of activin A when compared to undifferentiated cells. This is to be expected since CXCR4 is not entirely endoderm specific but is also
Figure 3.9. Gene expression kinetic analysis. 4 conditions (10 ng/mL BMP4, ± 20 ng/mL activin A, ± 10 ng/mL VEGF) were chosen from the results of the growth factor screening experiment (Fig. 4) and analyzed for transcript expression levels during the 6-day differentiation procedure. Pluripotency (OCT4) decreased over differentiation and Brachyury expression peaked between 2-4 days. Endoderm genes (FOXA2, CXCR4, SOX17) were expressed much higher for conditions supplemented with activin A, whereas mesoderm gene expression (KDR, PDGFRa,
MEOX1, CD34) was highest for non-activin A conditions. VEGF increased CD34
expressed by migrating mesoderm [41]. This result is consistent with CXCR4 protein expression detected by flow cytometry (Fig. 3.3A). Generally, the addition of VEGF had no notable effect upon gene expression, with the exception of lateral (CD34) and paraxial (PDGFRa) specific genes. The expression of CD34, a lateral mesoderm and hematopoietic cell marker, was induced in the absence of activin A but only in the presence of VEGF. Conversely, the expression of the paraxial gene, PDGFRa, was highest in the abscence of activin and VEGF, indicating that VEGF drives lateral or hematopoietic differentiation [43].
3.3.5 siRNA knockdown during endoderm differentiation
transfected with siRNA targeted to RFP. In all conditions, 75-80% of the cells in all conditions were CXCR4+, with no notable decrease caused by siRFP knockdown. To further verify that siRNA knockdown had not altered endoderm differentiation, qPCR analysis was performed after 6 days of differentiation (Fig. 3.10C) to analyze RFP
expression and the anterior primitive streak/definitive endoderm markers FOXA2 and
3.4 Discussion
Serum-free and feeder-free hESCs differentiation protocols are essential in order to 1) maximize experimental control and reproducibility and 2) develop clinically applicable regenerative therapies [56]. Many studies have focused on titrating growth factors and inhibitors within SFD cocktails to optimize target cell differentiation. As lineages are further explored, the possible combinations of factors will inevitably rise. Screening assays are extremely effective in this pursuit. We have developed a high throughput, multicolor flow cytometry assay of hESC differentiation that can be utilized to assess a range of SFD conditions. This small scale format requires approximately 92% less reagents and growth factors than 6-well culture conditions and occupies 6% of the incubator space. Additionally, this assay utilizes surface markers to allow for live-cell analysis and sorting.
utilized to characterize hESC differentiation to general mesoderm as well as vascular and cardiac progenitors [42, 43, 60]. Although our results corresponded with previous studies that have found KDR expression in a portion of hESCs [39], mesodermal cells generated by high BMP4 conditions were uniquely identifiable by KDR+SSEA-3- expression. Currently, no well-characterized extracellular early ectoderm surface markers have been validated. Ectoderm has typically been characterized by the intracellular markers Nestin,
b-III Tubulin, or Sox1 [51, 61-65]. We exploited the delayed expression of SSEA-3 into the early neural stem cell stage [46] to overcome the confounding NCAM expression in endoderm and mesoderm. Transcript expression indicated that this stage is similar to the primitive anterior neuroectoderm/neuroepithelia stage defined by Pankratz et al. [66], namely that PAX6 expression is upregulated with SOX1 expression beginning to increase. This strategy carries the caveat that SSEA-3+NCAM+ phenotyping would not be applicable at a later stage in the ectoderm lineage due to the loss of SSEA-3 expression.
neuroectoderm marker MUSASHI from hESCs [70]. Chambers et al. generated greater than 80% HES5+ neuroectoderm after 11 days of hESC differentiation [50]. Our 6 day protocol generated yields of 41-57%, comparable to these studies given the shorter time duration.
Many cytokine conditions, small molecules, and transfection conditions may induce cellular toxicity. Additionally, seeding densities may be highly variable due to the inability to seed hESCs as single cell suspensions in many lines. It is vital to obtain consistent and reliable results from a screening assay despite these caveats. This small-scale culture system demonstrated remarkable inter-well repeatability and density-robustness, particularly since static EB differentiation systems have been reported to generate highly heterogeneous cell populations [11]. Since 96- and 384-plate assays can display variations due to edges, evaporation, thermal variations, and pipetting error [71-73], we utilized gas permeable membranes and stainless steel lids to minimize evaporation and ensure a uniform heat distribution[74]. All standard deviations were less than 4% for biomarker signals, which allowed for highly significant differences between conditions.
endoderm differentiation. Cells were transfected with the siRNA molecules at Day 1 of differentiation and exhibited significant RFP knockdown at Day 6. This assay provides a siRNA screening platform that can potentially be utilized for differentiation pathway analysis.
eliminated PDGFRa expression at day 6, although all samples demonstrated transcript expression through the day 2-4 primitive streak stage. This PDGFRa reducing effect of activin A has been previously observed [51]. Similarly, activin A reduced KDR+SSEA-3 -expression, with highest expression levels seen in high BMP4 SFD conditions with no activin A. These results also corroborate previous studies that have induced mesoderm and vascular progenitors through BMP4 activation [33, 78] and noted reduced KDR expression with increasing activin A supplementation [39, 42, 51].
The addition of VEGF to SFD had no notable effect upon surface marker expression at day 6. However, CD34 transcript expression increased and PDGFRa
expression decreased, indicating a role in inducing early mesoderm cells towards a hematopoietic lineage. Indeed, several studies have utilized VEGF to induce mesendoderm or mesoderm progenitors towards a hematopoietic or cardiovascular state [24, 39, 79], and VEGF inclusion has been shown to improve subsequent hematopoietic blast colony formation [42].
4. Optimizing Hematopoietic Differentiation
4.1 Abstract
4.2 Introduction
4.2.1 Primitive hematopoiesis
Embryogenesis is characterized by two waves of erythrocyte production. The initial wave, primitive hematopoiesis, occurs in the extraembryonic yolk sac between embryonic days 7.25 and 9 (E7.25-9) in the murine embryo [80]. This stage is primarily characterized by the production of transient, large, nucleated “primitive” erythrocytes that express embryonic globin (e-globin) but not adult globin (b-globin). The second wave, definitive hematopoiesis, begins around E9.5 within the embryo proper, continues throughout post-natal life, and is characterized by the production of enucleated, adult globin-expressing erythrocytes, as well as all adult hematopoietic cells [81].
Due to ethical and practical difficulties, far less is understood regarding hematopoiesis in the human embryo. Much of the knowledge of the hemangioblast and primitive hematopoiesis has now come from ESC studies. Kennedy et al. found that a progenitor cell with erythrocytic, macrophage, and endothelial differentiation potential arose within a KDR+ population after 7 days of differentiation [19]. Klimchenko et al. proved the emergence of a primitive megakaryocyte-erythroid progenitor arising after 9 days of differentiation that could generate primitive erythrocytes and a primitive form of megakaryocyte whose ploidy remained typically less than 8N [86].
Inducing definitive hematopoiesis in ESC studies has proven much more elusive. An unknown mechanism must occur to “mature” hematopoietic progenitor cells from primitive to definitive. This mechanism has so far been provided either by feeder cells or by serum supplementation. Co-culture of mESCs upon an OP9 murine stromal layer, characterized by its inability to produce macrophage colony-stimulating factor (M-CSF), induces differentiation of all hematopoietic lineages [87]. Co-culture upon OP9 cells along with forced expression of definitive gene HoxB4 induces a definitive HSC capable of long-term engraftment in adult mice [17, 20]. Undirected EB differentiation in serum-containing medium induces two sequential waves of primitive followed by definitive hematopoiesis [18]. Exact pathways involved in these systems have yet to be determined.
4.2.2 In vitro hematopoietic hESC systems
humans. In vitro systems also offer the ability to study developmental mechanisms in a controllable environment. Vodyanik et al. developed an OP9 bone marrow stromal line coculture system and studied the progression of hESC hematopoietic differentiation [88]. They generated CD34+ primitive hematopoietic cells after 8-9 days of differentiation capable of generating primitive erythroid, megakaryocytic, and myeloid colonies. Additionally, after further coculture on MS-5 stromal cells, these cells produced myeloid and select lymphoid cells. After further study, it was determined that the CD43+ subpopulation of CD34+ cells generated with this system differentiated committed hematopoietic progenitors from endothelial and mesenchymal cells [89]. While these systems shed light on hematopoietic differentiation of hESCs, coculture with animal cells prohibits translating protocols to the clinic. Furthermore, due to the unknown factors produced by feeder layers, a thorough understanding of requisite signaling cues was not possible.
The feeder-free methylcellulose EB differentiation system developed by Zambidis et al. demonstrated a wave or primitive hematopoietic progenitors characterized by CD34+CD31+ expression and a second definitive wave from CD45+ cells [18]. While shedding light on hematopoiesis of hESCs, the use of serum in this system still presented a need for serum-free systems to be created.
forming ability. Up to 20% of total day 8 cells expressed CD34, although no reference to initial seeding density was made [90]. Niwa et al. utilized a stepwise procedure to induce KDR+CD34+ progenitors, representing less than 10% of total cell population after 6 days of differentiation [91].
For clinical translation, protocols will need to generate large quantities of target hematopoietic cells. This represents a need for high yielding differentiation protocols. The lack of an efficient serum-free EB protocol to generate hematopoietic progenitors motivated us to apply the EB differentiation screen to optimize hematopoietic differentiation of hESCs. Furthermore, we sought to establish a stepwise protocol to generate megakaryocytes in suspension culture.
4.3 Results
4.3.1 VEGF hematopoietic differentiation screen
prior experiments, BMP4 was removed at day 3 to avoid the differentiation towards trophoblast and extraembryonic endoderm caused by long term exposure [69]. The pan-hematopoietic marker CD34 and the hemato-endothelial marker CD31 are the first hematopoietic markers expressed during OP co-culture of hESCs [88] and were thus assessed by flow cytometry after 6 days of differentiation.
Figure 4.1. VEGF and BMP4 hematopoiesis screen. (A) Schematic of the 6-day differentiation screen with growth factor concentrations. Medium was replaced after 3 days of differentiation. (B) Representative flow cytometry plot of conditions inducing CD34+CD31+ cells. (C) Percentage of CD34+CD31+ cells for the assayed BMP4 and VEGF conditions. Results are given as percentages of total cells within each condition. (D) Cell viability for the assayed conditions. Bars represent the mean ± SD of two wells.
Day 0 Day 3 Day 6
0-40 ng/mL BMP4 0-100 ng/mL VEGF
5 ng/mL bFGF 0-40 ng/mL BMP4 0-100 ng/mL VEGF
B
D
C
A
Viability 0 2000 4000 6000 8000 100000 10 20 30 40 50 75 100
VEGF Concentration (ng/mL)
C el ls /w ell CD31+CD34+ Expression 0% 10% 20% 30% 40% 50% 60%
0 10 20 30 40 50 75 100
VEGF Concentration (ng/mL)
Both markers were expressed at approximately the same rates in cells, as demonstrated by the double positive population in Figure 4.1B. Hematopoietic character was proportional to the concentration of VEGF in the differentiation medium (Fig. 4.1C). Conditions lacking VEGF induced roughly 10% of cells toward the hematopoietic lineage. Increasing concentrations steadily induced higher percentages of total day 6 CD34+CD31+ cells, with approximately 40% of cells in 100 ng/mL VEGF medium expressing both markers. There was no clear relationship between BMP concentration and early hematopoietic character.
In contrast to general mesoderm conditions from previous experiments, hematopoietic differentiation conditions were characterized by low and highly variable viability (Fig. 4.1C). Viability generally increased with increasing concentrations of VEGF. BMP4, conversely, induced lower cell counts, although trends were not consistent. These data suggest that the 96-well assay could be utilized to screen hematopoietic differentiation conditions. Additionally, VEGF supplementation concentration is proportional to the percentage of cells characteristic of early hematopoietic cells and induces higher viability after 6 days of differentiation. Increasing BMP4 concentrations tends to result in lower viability.
4.3.2 Hematopoietic differentiation in 96-well format
at days 2 and 6 (Fig. 4.2A-B). In an effort to increase viability following differentiation, the Rho-associated protein kinase (ROCK) inhibitor Y-27632 was added to differentation medium for the first 48 hours [93]. EBs were dissociated and various hematopoietic markers were assayed by flow cytometry at days 4 and 8.
Figure 4.2. 96-well hematopoietic differentiation setup and day 4. (A) Schematic of 8 day hematopoietic differentiation. (B) Cells at Day 0 after seeding in suspension into 96-well format. Scalebar, 1000 mM. (C) Day 4 flow cytometry profiles demonstrating the KDR+CD31+CD34+ population. (D) Day 4 EBs. (E)
Day 4 hematopoietic marker profiles. Bars represent mean ± SD of 3 wells.
Day 4 Marker Expression
0% 20% 40% 60% 80% 100% SSEA 3+
CD43+ CD31+ KD R+
CD41+
CD235a+ CD 34+ CD42a+ P e rc e n ta g e o f C el ls
A
B
C
D
E
Day 0 Day 2 Day 4
25 ng/mL BMP4 50 ng/mL VEGF 10 mM Y-27632
5 ng/mL bFGF 50 ng/mL VEGF
Flow
Day 8
Flow
After 8 days of differentiation, EBs had adopted a much larger cystic, vacuolated morphology with some EBs measuring 400 mM in diameter (Fig.4.3A). EBs also appeared to be emitting single cells in suspension. While the KDR+CD31+CD34+ population was still present, a small CD43+CD31+KDRlow/- population had emerged (Fig.
A
B
C
Day 8 Marker Expression
0% 20% 40% 60% 80% 100% SSEA 3+
CD43+ CD31+ KDR+ CD41+ CD23
5a+
CD34+CD42a+
Percen tage of C e lls
4.3C). These cells also expressed CD235a and the megakaryocytic marker CD41 and were CD34+/-. This population only represented approximately 3% of total cells.
A
C
Figure 4.4. Day 8 separated EBs and single cells. (A) Day 8 flow cytometry profiles. (B) CD31, CD43 expression for EB cells. (C) Flow cytometry plots for single cells demonstrating CD43, CD41, and CD235a expression. (D) Cell viability over 8 days of differentiation.
Day 8 Marker Expression
0% 20% 40% 60% 80% 100% SSEA 3+
CD43+ CD31+ KD R+
CD41+ CD23
5a+
CD34+CD42 a+ Pe rcen tage o f Ce lls EBs SCs
B
Cell Viability 0 4000 8000 12000 16000 20000Day 4 Day 8
It was hypothesized that this CD43+ population consisted of single cells released from EBs. In order to evaluate this possibility, wells were pooled and EBs were allowed to settle for several minutes. The supernatant was then withdrawn, EBs were dissociated, and flow cytometry was performed on both sets of cells. EBs exhibited almost no expression of the hematopoietic markers CD43, CD41, and CD235a, whereas more than 90% of single cells expressed CD43 (Fig. 4.4A-C). Approximately 20% of single cells had also begun expressing the committed megakaryocytic marker CD42a.
Cell viability immediately decreased following seeding at Day 0. Day 4 populations were still less than 40% of the initial number of hESCs seeded (Fig. 4.4D). Yield had grown to higher than 50% at day 8, although the magnitude of single cells was lower than 500 cells/well, representing less than a 2.5% yield.
In order to characterize the hematopoietic potential of the day 7-8 single cells and verify the scalability of this system, hESCs were differentiated in identical conditions in 6-well culture format. Single cells were isolated after 7 days of differentiation and seeded into methycellulose and supplemented with hematopoietic cytokines to test colony forming potential (Fig. 4.5). At day 7, heterogenous EBs and single cells were both visible in cultures (Fig. 4.6A). Over 90% of single cells were CD43+CD31+ (Fig. 4.6B). 41% were CD41+CD235a+, with some cells already expressing single lineage markers. Cells were KDRlow/- and approximately 70% were CD34-. Approximately 10% of cells expressed a CD41-CD34+ phenotype.
After 12 days of methylcellulose culture, cells had given rise to colonies of primitive erythrocytic, macrophage, and mixed morphology (Fig. 4.7A, B). Cytospins and May-Grunwald-Giemsa staining were then performed on selected colonies and demonstrated primarily primitive erythroblast and macrophage cells. These results suggest that differentiation conditions identified by the 9well assay are scalable to 6-well plate or larger formats and that single cells produced after 7 days of differentiation have erythromyeloid potential.
Differentiating day 7 suspension single cells for a further 4 days in hematopoietic medium (containing SCF, TPO, EPO, Flt3-L, IL-6, and IL-3) produced cells morphologically characteristic of blast cells, primitive erythrocytes, and myeloid cells (Fig. 4.8A). At least three distinct populations were evident based off of marker expression profiles (Fig. 4.8B). A CD41highCD42a+CD235a-CD43high population indicated the presence of committed megakaryocytes (approximately 25% of cells). A CD235a+CD41-CD43mid/low population indicated committed erythrocytes. A separate CD41low/-CD235a-CD43high/midCD31high/midKDRmid population also existed, although it was not clear what these represented. Almost all cells were CD34- and slight CD18 and CD45 expression indicated progression towards myeloid lineages. This suggests that day 7 single cells are capable of further differentiating down the erythroid, megakaryocytic,
Figure 4.7. Hematopoietic colony potential of isolated day 7 single cells. (A)
Colonies observed after 12 days of methycellulose culture and corresponding cytospins demonstrating primitive erythroblasts and macrophages. EP: primitive erythrocyte colony; Mac: macrophage colony (B) Colony frequencies after 12 days. Bars represent mean ± SD of three assays.
B
Colony Frequencies 0 10 20 30 40E E-Mac Mac
C
F
C
s/5000 cells
After 10 days of differentiation of isolated single cells, populations began to appear less distinct. Committed CD235a+ erythroid and CD41+CD42a+/- megakaryocytic populations were still evident, although both had declined (Fig. 4.9B). A new CD43lowCD41-CD235a- population was evident. Myeloid populations, characterized by CD18 and CD45 expression, had increased. Cytospins revealed multilineage cells resembling mature erythrocytes, megakaryocytes, and myeloid cells (Fig. 4.9A). These
Figure 4.8. Hematopoietic differentiation phenotypes of day 7 + 4 cells. (A)
data suggest that multipotent day 7 progenitors do not continue to self-renew and produce new committed progeny when cultured in the utilized differentiation medium.
4.3.3 Optimizing KDR+CD31+ and CD31+CD43+ differentiation
These experiments indicated that during EB hematopoietic differentiation of hESCs, cells progress first through a KDR+CD31+ stage before CD43+ primitive megakaryocyte-erythromyeloid progenitors are produced and that BMP4 followed by VEGF supplementation was required to induce CD31+ expression. However, yields of CD43+ single cells remained modest. We next sought to optimize the yield of these
Figure 4.9. Hematopoietic differentiation phenotypes of day 7 + 10 cells. (A)
During mesoderm differentiation, BMP4 activates the Wnt pathway indirectly and Wnt signaling is required for primitive streak and mesoderm differentiation of mESCs
[42, 94]. However, addition of exogenous Wnt to BMP4-supplemented conditions does not significantly improve hematopoietic differentiation [42]. Prior to differentiation, Wnt supplementation induces proliferation in undifferentiated hESCs [95]. The canonical WNT pathway relies on the nuclear translocation of the transcription factor b-catenin to the nucleus [96]. In the absence of exogenous WNT signaling, b-catenin is phosphorylated by the glycogen synthase kinase 3 (GSK3) and subsequently ubiquitinated and degraded. The small molecule Chir-99021 (herein referred to as Chir) is a highly selective inhibitor of GSK3b [97]. Inhibition of GSK3 activates the WNT pathway by preventing the degredation of b-catenin (Fig. 4.10). We hypothesized that GSK3 inhibition during concomitant BMP4 supplementation may enhance yields by inducing proliferation during differentiation. Our first objective was to evaluate the
B
Figure 4.11. KDR-CD31 profiles for Chir, BMP4, VEGF Screen. (A) Day 6 and 8 profiles for all conditions. The double positive population is clear at day 6 and the CD31+KDRlow/- population is evident at day 8. (B) Time-course flow plots over 8 days of differentiation for medium supplemented with 2 mM Chir and 0 ng/mL BMP4.
Figure 4.12. Day 3 results of the hematopoietic screen with Chir. (A) Experiment schematic (B) Images of EBs for the three conditions, all with 2.5 ng/mL BMP4. Scalebar, 1000 mM. (C) KDR, SSEA3 flow cytometry profiles of conditions. (D)
After 5 days of differentiation, Chir EBs continued to remain larger than BMP4 alone EBs (Fig. 4.13A). Postponing BMP4 supplementation by 24 hours resulted in smaller EBs. BMP4-containing conditions displayed similar KDR+CD31+ populations,
Figure 4.13. Day 5 results of the hematopoietic screen with Chir. (A) Images of EBs for the three conditions, all with 2.5 ng/mL BMP4. Scalebar, 1000 mM. (B)