An unsupervised learning algorithm:
application to the discrimination of seismic events
and quarry blasts in the vicinity of Istanbul
H. S. Kuyuk1, E. Yildirim2, E. Dogan1, and G. Horasan2
1Department of Civil Engineering, Sakarya University, Sakarya, Turkey 2Department of Geophysical Engineering, Sakarya University, Sakarya, Turkey
Received: 21 June 2010 – Revised: 3 December 2010 – Accepted: 3 December 2010 – Published: 8 January 2011
Abstract. The results of the application of an unsupervised learning (neural network) approach comprising a Self Organizing Map (SOM), to distinguish micro-earthquakes from quarry blasts in the vicinity of Istanbul, Turkey, are presented and discussed. The SOM is constructed as a neural classifier and complementary reliability estimator to distinguish seismic events, and was employed for varying map sizes. Input parameters consisting of frequency and time domain data (complexity, spectral ratio, S/P wave amplitude peak ratio and origin time of events) extracted from the vertical components of digital seismograms were estimated as discriminants for 179 (1.8< Md<3.0) local events.
The results show that complexity and amplitude peak ratio parameters of the observed velocity seismogram may suffice for a reliable discrimination, while origin time and spectral ratio were found to be fuzzy and misleading classifiers for this problem. The SOM discussed here achieved a discrimination reliability that could be employed routinely in observatory practice; however, about 6% of all events were classified as ambiguous cases. This approach was developed independently for this particular classification, but it could be applied to different earthquake regions.
1 Introduction
Neural networks (NN) are one of the popular recent mathematical/computational alternative techniques that have been applied to seismic event classification problems (Taylor et al., 1989; Falsaperla et al., 1996; Tiira, 1999; Del Pezzo et al., 2003; Scarpetta et al., 2005; Yildirim and
Correspondence to: H. S. Kuyuk ([email protected])
Horasan, 2008; Kuyuk et al., 2009). NN learning algorithms can be categorized into three groups with respect to the type of feedback to which the learner has access. These are: (1) supervised learning, (2) reinforcement learning and (3) unsupervised learning. Unsupervised learning is distinguished from the others in that the learner is given only unlabeled examples. Unsupervised learning models include factor analysis, principal component analysis (PCA), mixtures of Gaussians, independent component analysis (ICA), hidden Markov models, state-space models (Ghahramani, 2004), adaptive resonance theory (ART) and many variants and extensions, but the SOM is the most commonly used algorithm. In particular, for large-scale high-dimensional data sets, a SOM allows a sensitive visualization of the data by vector quantization and dimension reduction. Based on the relatively simple SOM representation, further processing, such as clustering or feature grouping, can be achieved. Numerous methods exist in the literature for the discrimination of different typologies of seismic events (Gitterman et al., 1999; Joswig, 1990). In the seismological context, recent studies have reported that the SOM may offer a promising alternative classification method (Musil and Plesinger, 1996; Allamehzadeh and Mokhtari, 2003; Esposito et al., 2007).
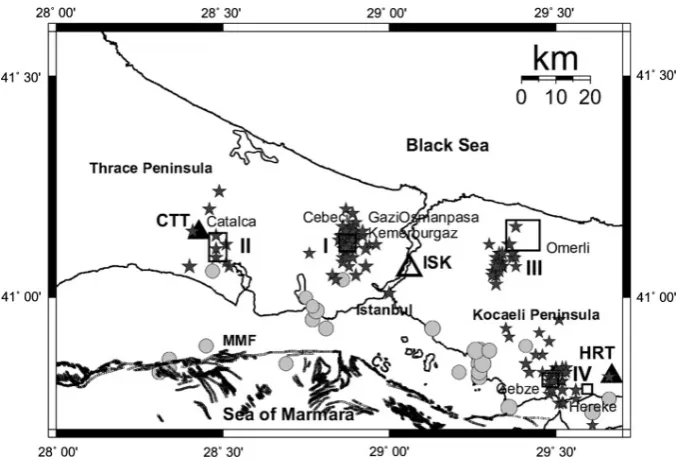
Fig. 1. Location map of earthquakes (filled gray colored circles) and quarry blasts (filled black colored stars) in the vicinity of Istanbul. ISK:
broad-band station (open triangle), CTT and HRT: short-period (filled triangles) stations, and quarries (open boxes). The sites of the main quarries (I: Gaziosmanpasa: Cebeci and Kemerburgaz, II: Catalca, III: Omerli and IV: Gebze-Hereke) were determined from satellite data (Musao˘glu et al., 2004) and field observations. MMF: Main Marmara Fault, CS: Cınarcık Segment of the MMF (Horasan et al., 2009).
The tectonic processes forming the Sea of Marmara and its surrounding area are controlled by the North Anatolian Fault Zone (NAFZ). NAFZ is a dextral strike-slip fault zone, extending from the Karliova region to the Gulf of Izmit along Anatolia, and south of Thrace as the Ganos Fault (S¸eng¨or et al., 1985; Barka and Kadinsky-Cade, 1988). Many micro and macro tectonic earthquakes have occurred due to the NAFZ and its segments in the vicinity of Istanbul. A few areas of quarrying are in operation in Istanbul and its near surroundings: Gaziosmanpasa (Cebeci and Kemerburgaz), C¸ atalca, Omerli, Gebze-Hereke (Musao˘glu et al., 2004). Quarrying areas are illustrated in Fig. 1.
Currently, quarrying regularly contaminates the seis-mograms recorded by the KOERI, National Earthquake Monitoring Center (NEMC) seismic network. Accurate dis-crimination between explosions in quarries and earthquakes is important for analyzing active tectonic and seismic risk of the region. Recorded explosions in the catalogues can mislead scientists interpreting the active tectonics and can lead to erroneous results in the analysis of seismic hazards in the study area (G¨okas¸an et al., 2002). Therefore, it is important to distinguish QBs from EQs in the KOERI NEMC seismicity catalogs.
The aim of this study was to apply one of the unsupervised learning methods (in this case, SOM) for discriminating QBs from tectonic EQs. It was found that the SOM technique could be employed successfully using four discriminants for classifying seismic events such as micro earthquakes and quarry blasts.
2 Data and methods
Investigations performed by Horasan et al. (2006) around Istanbul revealed that the number of events with magnitude Md <3 between 1995 and 2007 was affected by the
following two factors: (1) contamination of the seismicity catalogs with blasts regularly created in quarries at certain time intervals every day, and (2) the existence of imprecisely reported seismic events with duration magnitude less than 3 in the seismicity catalogs (Horasan et al., 2009). From the results of preliminary work, three factors needed to be taken into consideration when deciding which methods are to be used for the discrimination of QBs from EQs in the study area.
magnitude (Md) between 1.8 and 3.0 (KOERI, NEMC) that
occurred between 2001 and 2004 are used. Out of a total of 179 seismic events, 16 were recorded at Catalca, 71 at Gaziosmanpasa, 48 at Hereke and 44 at Omerli (Fig. 1). The data (complexity, spectral ratio, S/P amplitude peak ratio) used in this study were obtained from Horasan et al. (2006) with the support of the Bogazici University Research Fund (Project No: 05T202).
The four parameters investigated in the analysis are defined as follows:
1. Complexity (C) is the ratio of integrated powers of the seismogram in the selected time windows (t1=2 s;
t2=4 s;tois the onset time of the P-wave). C can be
expressed as follows (Arai and Yosida, 2004):
C=
Z t2
t1
a2(t )dt Z t1
t0
a2(t )dt (1)
The limits of the integrals ofC given in Eq. (1) were determined by a trial-and-error approach to find the best representativeCvalues for both blasts and earthquakes. The integrals were computed separately for the ISK, CTT and HRT seismic stations. The complexity has a higher value for earthquakes because the S-wave amplitude of the earthquake waveform is greater than the P-wave amplitude.
2. Spectral ratio (Sr) is the ratio of integrated spectral amplitudes a(w) of the seismogram in the selected frequency bands (high frequency band, f1−f2: 5–
10 Hz; low frequency band,f0−f1: 1–5 Hz). Sr can
be written as (Gitterman and Shapira, 1993):
Sr= Z f2 f1 a(w)dw Z f1 f0 a(w)dw (2)
The limits of integrals (f0,f1,f2) were determined by
comparing the spectra of quarry blasts with those of earthquakes.
3. S/P ratio is the relative ratio of the amplitudes of S-waves to those of P-waves. This parameter was obtained from the P- and S-wave peak to peak amplitude measurements of the seismograms using GURALP visualization program Scream 4.3. The peak ratio of S-to P-waves is smaller for quarry blasts, since the S-wave amplitude of the seismogram is smaller than the P-wave amplitude.
Minimum 0.2040 0.1500 0.0600 1.0000 Mean 2.4413 1.9191 0.9300 12.2849 Standard
3.7338 1.3643 0.8482 3.8457 deviation
4. Time refers to the origin time of an event. The number of seismic events in the quarries increased during the day (7 a.m.–4 p.m. GMT, or 9 a.m.–6 p.m. LT), coinci-dent with regular blasting hours of the quarries (Horasan et al., 2009).
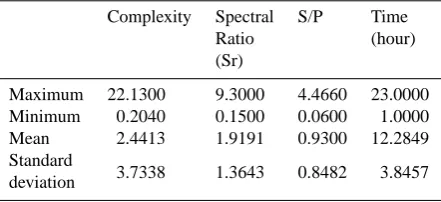
Table 1 shows statistical values of these parameters.
2.1 Self Organizing Map (SOM)
A SOM is in the competitive Artificial Neural Networks (ANNs) category, has no hidden layer, and contains no non-linear activation function. Therefore it is strictly linear in its response (Kohonen, 1990). A SOM carries out unsupervised learning with sets of unknown categorized data and discovers classes by clustering inputs according to various similarity criteria. Namely, competitive ANNs are capable of discerning the common features or topology of different input vectors without any subsidiary information. Thus, methods like clustering or feature grouping can be carried out easily using a SOM representation.
The SOM algorithm uses Euclidian metrics to measure distances between vectors; thus, before training, input data are firstly linearly normalized. Linear initialization and a batch training algorithm are performed. Regression of an ordered set of model vectorsϕi into the space of observation vectorskis executed by the following process:
ϕi(t+1)=ϕi(t )+0c(r),i(k(t )−ϕi(t )) (3) where t is the step index, whereby the regression is performed recursively for each presentation of a sample of k. Index c (“winner”) is defined by the condition
(a) (b) (c)
(d) (e)
Fig. 2. SOM Visualization of predictions and data (7×7 map size). Component planes: (a) complexity, (b) spectral ratio (Sr), (c) S/P ratio,
(d) time and (e) map unit labels. In Fig. 1e QB and EQ represent quarry blasts and earthquakes, respectively. Unlabeled cells could not
clustered by the method. Five figures have connection by position; the hexagon in a certain position corresponds to the same map unit in each figure. The lightness of the colors increases with indicator value. Two components, complexity and S/P ratio have a strong correlation with the label node matrix.
on the map grid. The neighborhood function is taken as Gaussian;
0c(r),i=α(t )exp
−kki−kck2
.
2η2(t ) (5)
whereα(t )is the learning rate, which decreases with each step, and is between 0 and 1.ki,kcare the vectorial locations
in the display grid and η(t ) corresponds to the width of the neighborhood function (Kohonen, 1997; Kohonen et al., 1996). A MATLAB1 based SOM Toolbox developed by the SOM Toolbox team, Laboratory of Computer and Information Science (Helsinki University of Technology, Finland) was utilized for analysis. Further information can be obtained from the technical manual of the toolbox (Technical manual, 2000).
3 Results and discussion
Parameters derived from time- and frequency-domain anal-yses of the seismograms (amplitude peak ratio, power ratio, and spectral amplitude ratio) were used for discrimination. Discriminative parameters are illustrated in Fig. 2, where component planes and corresponding map unit labels are provided. The labels in hexagons of the label matrix show the corresponding neuron. The units are very close to their neighbors in the bottom-left corners of complexity, Sr and
1MATLAB software, ©1994–2010 The MathWorks, Inc.
S/P ratio. A border can also be seen between the top 2 neurons and the remainder for complexity and S/P ratio. The map unit in the top-right corner has high values for the same two parameters. Moreover, high values in the top left corners were observed for time and for spectral ratio. Visually, there is a strong correlation between the classification of events with complexity and with S/P ratio.
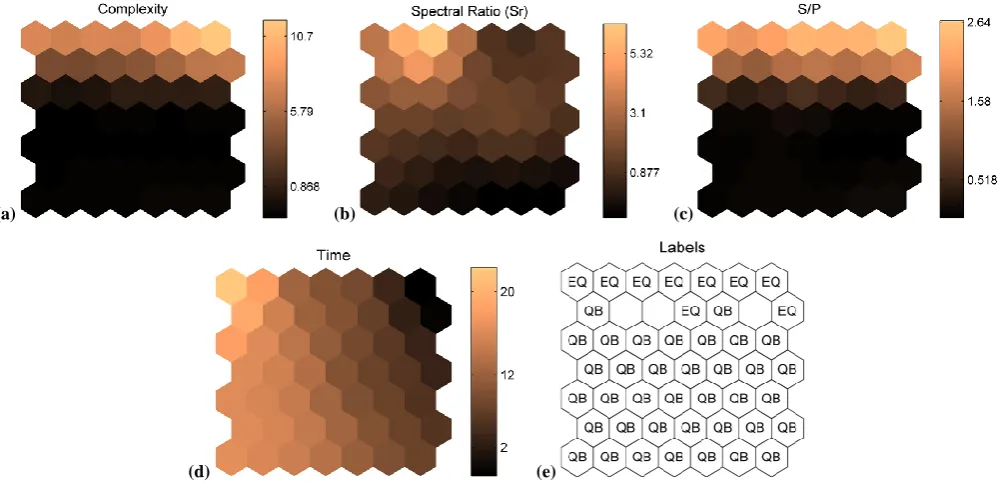
The projection of the parameter set onto the subspace spanned by its two eigenvectors with greatest eigenvalues is shown in Fig. 3 for different map-sizes. The two labels have been plotted such that red stars indicate earthquakes and blue askterisks represent quarry blasts. The SOM grid has been projected onto the same subspace. Neighboring map units are connected with gray lines. Labels associated with map units are also shown on nodes (neurons) as EQs and QBs. The distrubition of the data set is compatible with the SOM. Figure 3a, b, c, d, e and f corresponds to 6×6, 8×8, 10×10, 12×12, 14×14 and 20×20 map sizes, respectively. As the map-size is enlarged, the SOM algorithm adapts to the distribution of the input data while the the number of nodes without labels increases. Node density is boosted around events with increments of map-size.
(a) (b)
(c) (d)
(e) (f)
Fig. 3. SOM and projection of the seismic events onto the subspace spanned by its two eigenvectors with greatest eigenvalues for different
Fig. 4. Clustering results of the 7×7 dimension SOM. Red, green and black hexagons indicate earthquakes, quarry blasts and unlabeled events. The bar charts in each map unit show the normalized values of complexity, spectral ratio, S/P and time, respectively. Bar chart values are correlated with event discrimination. Values of the first and third bars, which indicate complexity and S/P ratios, respectively, in red cells (earthquakes) are higher than corresponding bars in green cells (quarry blast).
(a)
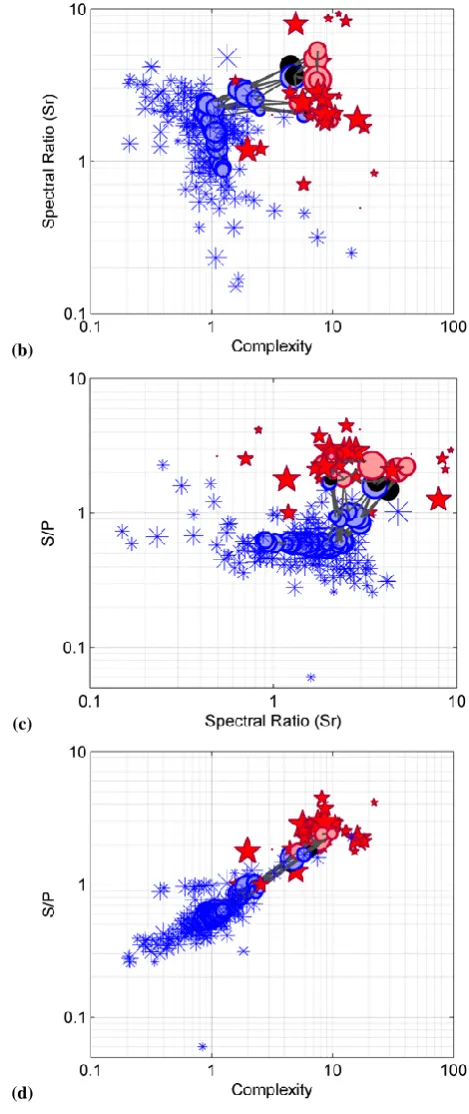
Fig. 5. Red stars indicate earthquakes and blue asterisks represent
the quarry blasts; gray lines show the connections between neighboring map units. Red, blue and black circles located at the nodes indicate earthquakes, quarry blast and unlabeled events, respectively, and are classification results from the SOM. (a) Scatter plot of four discrimanants in four dimensions; marker size represents the forth component, time. Large markers indicate late seismic activity. Parts (b), (c), (d) are the projections onto the corresponding parameters (axes are log scale).
black hexagons indicate EQs, QBs and ambiguous events. There were 49 nodes in the SOM. Three nodes could not be distinguished by the algorithm, so the model yielded a success rate of about 94%. Complexity and S/P ratio (first and third bars) were higher for EQs, and lower for QBs.
Projections of the 3-D plot illustrated in the top left are given in Fig. 5b, c, and d (logarithmic scale). The three
(b)
(c)
(d)
Fig. 5. Continued.
The SOM investigated here achieved a discrimination reliability that could be employed in observatory practice; however, about 6% of all events were classified as ambiguous cases. The accuracy might improve with other preprocessing strategies of data such Linear Prediction Coding, wavelet techniques, etc. (Esposito et al., 2006).
4 Conclusions
The presence of quarries in an active seismic zone can cause errors during the analysis of the distribution of micro seismicity and the editing of seismic catalogs. This study demonstrated that the SOM technique is able to discriminate EQs from QBs using relevant data sets in the study area. The SOM algorithm proposes a model that optimally describes the domain of (discrete or continuously distributed) observations. The model is organized into a consequential two-dimensional order in which related models are closer to each other in the grid than the more different models. Thus the SOM is a kind of relationship graph, or a clustering diagram. Its computation is a nonparametric, recursive regression process. The data sets computed from the vertical component of waveform (including EQs and QBs) were recorded in Istanbul and its vicinity between 2001 and 2004 at three stations. From the results obtained, the proposed SOM model appears to be an efficient tool for distinguishing seismic events.
Acknowledgements. We thank the Bogazici University Research Fund and members of project no. 05T202. We thank Masato Motosaka for allowing us to use MATLAB Software1. We also thank the referees for their valuable comments.
Edited by: M. E. Contadakis
Reviewed by: three anonymous referees
References
Allamehzadeh, M. and Mokhtari, M.: Prediction of Aftershocks Distribution Using Self-Organizing Feature Maps (SOFM) and Its Application on the Birjand-Ghaen and Izmit Earthquakes, Journal of Seismology And Earthquake Engineering (JSEE), 5, 1–15, 2003.
Arai, N. and Yosida, Y.: Discrimination by short-period seismo-grams, International Institute of Seismology and Earthquake Engineering, Bulding Research Institute (IISEE), Lecture Note, Global Course, Tsukuba, 10 pp., 2004.
events, B. Seismol. Soc. Am., 76, 1069–1086, 1986.
Del Pezzo, E., Esposito, A., Giudicepietro, F., Marinaro, M., Martini, M., and Scarpetta, S.: Discrimination of earthquakes and underwater explosions using neural networks, B. Seismol. Soc. Am., 93, 215–223, 2003.
Esposito, A. M., Scarpetta, S., Giudicepietro, F., Masiello, S., Pugliese, L., and Esposito, A.: Nonlinear Exploratory Data Analysis Applied to Seismic Signals, Lect. Notes Comput. Sc., 3931/2006, 70–77, doi:10.1007/11731177 11, 2006.
Esposito, A. M., Giudicepietro, F., D’Auria, L., Scarpetta, S., Martini, M., Marinaro, M., and Coltelli, M.: Automatic Analysis of VLP Seismic Signals by using Unsupervised Neural Network Poster in the Session, in: New Developments in Semi-automatic and Fully-automatic Tools in Seismic Data Analysis, 2007 SSA Annual Meeting, Hawaii, 2007.
Falsaperla, S., Graziani, S., Nunnari, G., and Spampinato, S.: Automatic classification of volcanic earthquakes by using multi-layered neural networks, Nat. Hazards, 13, 205–228, 1996. Ghahramani, Z.: Unsupervised Learning, in: Advanced Lectures
in Machine Learning, edited by: Bousquet, O., von Luxburg, U., and Raetsch, G., Springer-Verlag, Berlin, Lecture Notes in Computer Science, 3176, 72–112, 2004.
Gitterman, Y. and Shapira, A.: Spectral discrimination of underwater explosions, Israel Journal Earth Science, 42, 37–44, 1993.
Gitterman, Y., Pinsky, V., and Shapira, A.: Spectral classification methods in monitoring small local events by the Israel seismic network, J. Seismol., 2, 237–256, 1998.
Gitterman, Y., Pinsky, V., and Shapira, A.: Spectral discrimination analysis of Eurasian nuclear tests and earthquakes recorded by the Israel seismic network and the NORESS array, Phys. Earth. Planet. In., 113, 111–129, 1999.
G¨okas¸an, E., Gazio˘glu, C., Alpar, B., Yucel, Z. Y., Ersoy, S¸., Gundogdu, O., Yaltırak, C., and Tok, B.: Evidence of NW extension of the North Anatolian Fault Zone in the Marmara Sea: a new interpretation of the Marmara Sea (˙Izmit) earthquake on 17 August 1999, Geo-Mar. Lett., 21, 183–199, 2002.
Horasan, G., Boztepe-G¨uney, A., K¨usmezer, A., Bekler, F., and ¨O˘g¨utc¸¨u, Z.: ˙Istanbul ve civarındaki deprem ve patlatma verilerinin birbirinden ayirt edilmesi ve kataloglanması (Dis-criminating and cataloging of quarry blasts and earthquakes in ˙Istanbul and its vicinity), Bo˘gazic¸i University Research Fund, Istanbul, Final Report, Project No: 05T202, 79 pp., 2006 (in Turkish).
Horasan, G., G¨uney, A. B., K¨usmezer, A., Bekler, F., ¨O˘g¨utc¸¨u, Z., and Musao˘glu, N.: Contamination of seismicity catalogs by quarry blasts: An example from ˙Istanbul and its vicinity, northwestern Turkey, J. Asian Earth Sci., 34, 90–99, 2009. Joswig, M.: Pattern recognition for earthquake detection, B.
Kohonen, T.: The Self Organizing Map, Proceeding of the IEEE, 78, 1464–1480, 1990.
Kohonen, T.: Self-Organizing Maps, Springer Series in Information Sciences, Vol. 30, Springer, Heidelberg, 1st edn.: 1995, 2nd edn.: 1997.
Kohonen, T., Hynninen, J., Kangas, J., and Laaksonen, J.: SOM PAK: The self-organizing map program package, Helsinki University of Technology, Laboratory of Computer and Infor-mation Science, Espoo, Finland, Report A31, available at: http: //www.cis.hut.fi/research/som lvq pak.shtml/, 1996.
Kuyuk, H. S., Yildirim, E., Horasan, G., and Dogan, E.: Investigation on discrimination of quarry blast and earthquake data by response surface, multi-regression and learning vector quantization methods, Sakarya International Symposium on Earthquake Engineering, The learning outcomes on Marmara Earthquake in the First decade, Sakarya, Turkey, 1–2 October 2009.
Musao˘glu, N., Coskun, M. Z., G¨oksel, C¸ ., Kaya, S., Bektas¸, F., Saro˘glu, E., ¨Ust¨un, B., ˙Ipb¨uker, C., Erden, T., and Karaman, H.: ˙Istanbul Anadolu yakası hazine arazilerinin uydu verileri ve corafya bilgi sistemleri (CBS) ile incelenmesi (Investigation of state owned lands in Anatolian side of ˙Istanbul by satellite data and Geographic Information System), T ¨UBITAK, Kocaeli, Project No: 102I022 (˙IC¸ TAG-I433), 69 pp., 2004.
Musil, M. and Plesinger, A.: Discrimination between Local Microearthquakes and Quarry Blasts by Multi-Layer Perceptrons and Kohonen Maps, B. Seismol. Soc. Am., 86, 1077–1090, 1996. Pomeroy, P. W., Best, J. W., and McEvilly, Th. V.:. Test ban treaty verification with regional data- a review, B. Seismol. Soc. Am., 72, 89–129, 1982.
Scarpetta, S., Giudicepietro, F., Ezin, E. C., Petrosino, S., Del Pezzo, E., Martini, M., and Marinaro, M.: Automatic Classification of seismic signals at Mt. Vesuvius Volcano, Italy using Neural Networks, B. Seismol. Soc. Am., 95, 185–196, 2005.
S¸eng¨or, A. M. C., G¨or¨ur, N., and S¸aro˘glu, F.: Strike-slip faulting and related basin formation in zones of tectonic escape: Turkey as a case study, Society of Economic Paleontologists and Mineralogists, Special Publication 37, 228-264, 1985.
Taylor, S. R., Denny, M. D., Vergino, E. S., and Glaser, R. E.: Regional discrimination between NTS explosions and earthquakes, B. Seismol. Soc. Am., 79, 1142–1176, 1989. Technical manual of SOM toolbox for MATLAB 5, (2000),
available at http://www.cis.hut.fi/projects/somtoolbox/, 2010. Tiira, T.: Detecting teleseismic events using artificial neural
networks, Comput. Geosci., 25, 929–939, 1999.
Wiemer, S. and Baer, M.: Mapping and removing quarry blast events from seismicity catalogs, short notes, B. Seismol. Soc. Am., 90, 525–530, 2000.
W¨uster, J.: Discrimination of chemical explosions and earthquakes in central Europe – a case study, B. Seismol. Soc. Am., 83, 184– 1212, 1993.