www.nat-hazards-earth-syst-sci.net/11/475/2011/ doi:10.5194/nhess-11-475-2011
© Author(s) 2011. CC Attribution 3.0 License.
and Earth
System Sciences
Probabilistic coastal vulnerability assessment to storms at regional
scale – application to Catalan beaches (NW Mediterranean)
E. Bosom and J. A. Jim´enez
Laboratori d’Enginyeria Mar´ıtima, ETSECCPB, Universitat Polit`ecnica de Catalunya, c/ Jordi Girona 1–3, Campus Nord ed. D1, 08034 Barcelona, Spain
Centre Internacional d’Investigaci´o dels Recursos Costaners, Barcelona, Spain
Received: 20 June 2010 – Revised: 1 November 2010 – Accepted: 16 November 2010 – Published: 15 February 2011
Abstract. A methodology to assess storm-induced coastal vulnerability taking into account the different induced pro-cesses separately (inundation and erosion) is presented. It is based on a probabilistic approach where hazards time series are built from existing storm data and later used to fit an ex-treme probability function. This is done for different sectors along the coast defined in terms of the wave climate and for representative beach types of the area to be analyzed. Once probability distributions are available, coastal managers must decide the probability of occurrence to be accepted as well as the period of concern of the analysis in function of the impor-tance of the hinterland. These two variables will determine the return period to be considered in the assessment. The comparison of hazards and vulnerabilities associated with the selected probability of occurrence permit to identify the most hazardous areas along the coast in a robust manner by in-cluding the spatial variability in forcing (storm climate) and receptor (beaches). The methodology has been applied to a 50 km long coastal stretch of the Catalonia (NW Mediter-ranean) where offshore wave conditions can be assumed to be homogeneous. In spite of this spatially constant wave field, obtained results indicate a large variability in hazards intensity and vulnerability along the coast.
1 Introduction
The coastal zone is subjected to different natural hazards that can produce important economic and environmental dam-ages (e.g., P´erez-Maqueo et al., 2007). Among them, storm-induced inundation and erosion are very frequent along coasts worldwide. Due to this, it should be relevant to assess
Correspondence to: E. Bosom
(eva.bosom@upc.edu)
the vulnerability of coastal systems to storm impacts to pro-vide decision-makers information about their potential con-sequences to apply mitigation and/or adaptation strategies on the coastal zone (see e.g., Godschalk et al., 1989).
The importance of including hazards and vulnerability as-sessments in coastal zone policies has been highlighted dur-ing the last years. One example is the recently signed (Jan-uary 2008) Protocol on Integrated Coastal Zone Management in the Mediterranean (PAP/RAC 2007), which specifically recommends countries to undertake vulnerability and haz-ard assessments to address the effects of natural disasters in coastal zones.
In this work, vulnerability is defined as the potential of a coastal system to be harmed by the impact of a storm (see e.g., Gouldby and Samuels, 2005), and it is quantified by comparing the magnitude of the impact with the adaptation capacity of the system. In simple terms, the impact is char-acterised by the intensity of storm-induced coastal processes, whereas the adaptation ability is defined by the beach physi-cal properties determining the capacity to cope with consid-ered impacts.
A storm can be defined in a simple manner as a violent at-mospheric perturbation that when occurs at the sea, the most immediate effects are the increase in wave height and some-times sea level (storm surge). In this work, a storm is con-sidered as a wave event exceeding a significant wave height,
Hs, value of 2 m, during a minimum period of 6 h. This cri-terion was proposed by Mendoza and Jim´enez (2008) as the minimum conditions required to generate a significant im-pact along the Catalan coast.
Fig. 1. Study area showing coastal sectors and location of wave buoys and HIPOCAS nodes.
storm event. Moreover, their induced damages in the coastal zone are also different and, in consequence, managers should be interested to know which the dominant hazard for a given event is. Therefore, the developed methodology allows the evaluation of the coastal vulnerability to these two processes separately.
Within this framework, the main objectives of this work are: (i) to present a methodology to assess coastal vulner-ability to storm-induced erosion and inundation at regional scale, and (ii) to apply it to the Catalan coast.
2 Study area and data
The Catalan coast (NW Mediterranean, Fig. 1) is about 600 km long and it comprises a large diversity of coastal types such as cliffs, bay beaches, long straight beaches and deltas, with about 270 km being composed by beaches (CADS, 2005). Along the Catalan coast, there are 70 muni-cipalities which represent the 7% of the surface of Catalo-nia but support the 44% of the total population, with a mean density of 1324 pop km−2. The socio-economic structure is based on typical coastal activities such as commerce, agri-culture and residential developments, with tourism being the dominant one (Sard´a et al., 2005).
In this study two types of data have been used: wave data to characterize the storms and beach geomorphologic vari-ables to characterize the receptor. They are briefly described in what follows.
Storm characteristics along the Catalan coast have been defined by using wave conditions at five sectors (Fig. 1). Two types of wave data were available: (i) instrumental data recorded by nearshore wave buoys deployed at depths between 40 m and 90 m that have been operating since the end of the 1980s, and (ii) hindcast data covering the period
storm time series
forcing definition
erosion inundation GIS
beach database
vulnerability calculator
erosion vulnerability mapping fiiting extreme value distribution
storm-induced hazards time series
wave data
erosion inundation
hazards probability distributions
inundation vulnerability mapping risk level time period of concern
return period selection
decision-maker's choice hazard assessment
vulnerability assessment
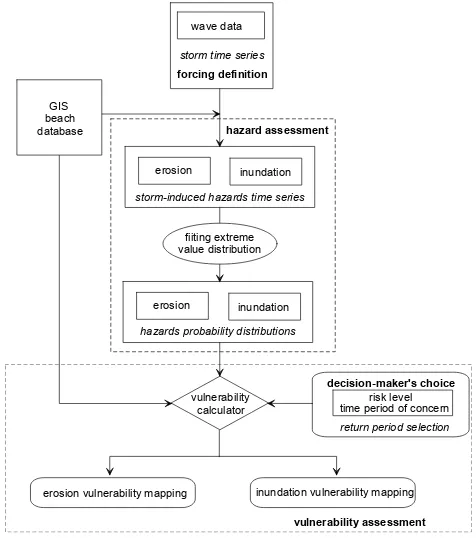
Fig. 2. Methodological framework for coastal vulnerability assess-ment to storms.
1958–2001 obtained in the framework of the Hipocas project (Guedes-Soares et al., 2002).
For each sector, representative time series of annual max-imum storms have been built. They have been defined in terms of significant wave height at the peak of the storm (Hs max), associated peak period (Tp max), direction and storm duration. As mentioned before, in this work a wave storm is defined as an event whereHs exceeds a threshold value of 2 m during a minimum duration of 6 h (Mendoza and Jim´enez, 2008). The two types of wave data have been in-tegrated after calibration of the simulated data to build up 50 years long wave storm time series covering the period 1958–2008.
3 Vulnerability assessment 3.1 General framework
The proposed methodological framework to assess the coastal vulnerability to storm impacts is schematised in Fig. 2. It consists of three main steps: (i) the definition of the forcing – storms, (ii) the evaluation of induced hazards, and (iii) the coastal vulnerability assessment.
The practical goal of the methodology is to provide in-formation to managers to plan on resources’ allocation to manage/mitigate damages induced by storm impacts at re-gional scale. In this work, this scale corresponds to a length of several hundreds of kms where geomorphology and storm characteristics vary along the coast. From the management standpoint, it has been selected because comprises an admin-istrative unit with its own legal competences, which should be equivalent to a state in a federal republic. There are differ-ent approaches to coastal vulnerability assessmdiffer-ent depending on different aspects such as the driving process, the scale of the analysis and the type of considered vulnerability (e.g., S´anchez-Arcilla et al., 1998; Pethick and Crooks, 2002; Fer-reira, 2004; McFadden et al., 2007; Youssef et al., 2009). When referring to storms, they can assess the coastal vulner-ability by defining the driver in different ways such as real wave conditions (Prasad et al., 2009) or storm classes (Men-doza and Jim´enez, 2009).
In this work we have adopted a probabilistic approach where, the probability of occurrence of induced hazards along the coast are estimated and, once a risk level is defined by the manager, the spatial distribution of the expected mag-nitude of the impact is compared to identify the potentially most endangered areas. Thus, instead of assessing the vul-nerability for all beaches induced by a given (single) storm, the objective is to calculate the vulnerability associated with a given probability of occurrence at each site. In this ap-proach, the decision-maker selects the acceptable probability of occurrence that can vary along the coast, depending on the characteristics of the hinterland. In the case of selecting spatially varying risk levels, this should result in comparing vulnerabilities associated with different probabilities. 3.2 Storms characterization
The first step in the methodology consists of defining the haz-ards’ forcing, i.e., to characterize storms in the study area. To do this, a storm data set has to be built using existing wave data. This data set includes main wave variables defin-ing such events (Hs,Tp,θ, duration). In extreme analysis, two main types of approaches can be followed: (i) the POT (peak-over-threshold) method, where all events withHs ex-ceeding a given threshold are considered, and (ii) the annual maxima method, where only the largest storm of each year is taken (see e.g., Coles, 2001). In this work, since the dataset covers a period of 50 years, we have selected the annual
max-0 2 4 6 8
Hs HIPOCAS (m) 2
3 4 5
Hs
buoy
(m)
Hs buoy = 0.24 * Hs HIPOCAS + 2.91 r2 = 0.5127
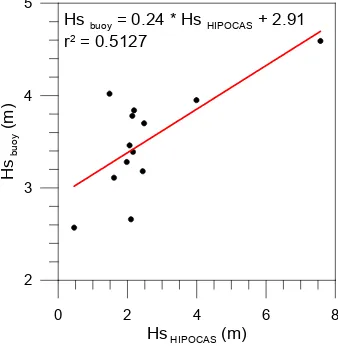
Fig. 3. Comparison of recorded and simulated significant wave height (Hs) at the peak of the annual maximum storm for sector III
of the Catalan Coast (see location in Fig. 1).
ima method because the sample is long enough to perform a reliable analysis. In this sense, a typical rule-of-thumb in ex-treme analysis is that the extent of the data set must be at least one-third of the duration to which wave heights are being ex-trapolated (Borgman and Resio, 1977). This means that, for the used data set, the most reliable wave heights will be those associated up to a return period of 150 years. The annual maximum storm was calculated for climatic years, i.e., the period from September to August.
Since two different types of data are available, i.e., hind-casted (simulated) and measured ones, the first task consisted of obtaining a transfer function to convert simulated data to real ones. This was done by applying a regression analysis to simultaneous data during a certain period. As an example, Fig. 3 shows the comparison between recorded and simulated values ofHsat the storm peak for simultaneous annual max-imum events at sector III. This regression analysis has been done for all storm parameters (Hs,Tpand duration) and for all sectors along the coast. Obtained results reflect one of the potential problems of using hindcast wave data without pre-vious validation, i.e., their reliability. This is especially im-portant in the NW Mediterranean that presents short fetches and where storm events are of limited duration which leads to model errors in comparison to open ocean predictions (Cav-aleri and Bertotti, 2004; Bola˜nos et al., 2007). In spite of the obtained large dispersion of data around the fitted model we have used it to transform hindcast wave data and, thus to have a longer wave time series.
1960 1965 1970 1975 1980 1985 1990 1995 2000 2005 2010
Time (years)
2 3 4 5 6
Hs
(m)
6 8 10 12 14
Tp
(s
)
0 20 40 60 80 100 120
Du
ra
tion (hour
s)
Hs Tp duration
Fig. 4. Reconstructed wave variables defining annual maxima storms for sector III.
pre-storm profile
post-storm profile
tan
tan
V
MWL B
der Ru
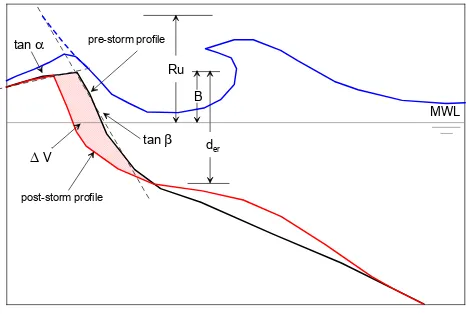
Fig. 5. Storm-induced beach hazards schematization.
3.3 Coastal hazards parameterization
When an extreme storm impacts on a sandy coast, it pro-duces different morphodynamic responses which rapidly and significantly modify the coastal landscape. These processes and changes are controlled by a combination of different fac-tors that essentially are storm characteristics and the coastal geomorphology (e.g., Morton, 2002; Morton and Sallenger, 2003). Having adopted a regional scale approach, we sim-plify the analysis by retaining the two most important storm-induced coastal processes, inundation and erosion (Fig. 5). As these processes are potentially harmful for coastal stabil-ity and they should affect existing uses and resources, they are usually considered as hazards. Their magnitude has been parameterized by selecting a representative indicator includ-ing information on storm properties (forcinclud-ing) and beach char-acteristics (receptor).
Coastal inundation is generally caused by a combination of high water levels (storm surges plus high tides) and wave ac-tion, and in consequence, a joint probability analysis of storm surges and wave run-up should be needed to properly
char-acterize in probabilistic terms the total water level. However, in this work we have only used the wave-induced run-up be-cause although storm-surges are not infrequent during East-ern storms in the Catalan coast (e.g., Jim´enez et al., 1997), their magnitude is much lower than wave-induced run-up (Mendoza and Jim´enez, 2008). Formally, this represents that the vulnerability to inundation here characterised will refer to the storm wave-induced component. Thus, the inundation hazard has been parameterized by using the wave-induced run-up at the storm peak by using the Stockdon et al. (2006) model, which is given by
Ru2%=1.1 0.35 tanβ (HsLo)1/2
+
HsLo 0.563 tanβ2+0.004 1/2
2
!
(1) whereHsis the deepwater significant wave height,Lois the deepwater wave length associated to the wave peak period,
Tp, and tanβ is the beachface slope. This formula was se-lected because it was derived specifically for beaches and it was adjusted by using only field data.
Because beach profiles usually present a change in the slope, with an inner part of the profile (tanα) being milder than the one at the beachface (tanβ) a correction factor for the run-up following van der Meer and Janssen (1995) has been considered. This correction factor,γ, accounts for the expected modification in the run-up as waves propagates over the inner part of the profile and it is given by
γ=tanα/tanβ (2)
which is truncated to values within the interval [0.6, 1]. The final run-up value is obtained by multiplying the value ob-tained for the beachface slope (Eq. 1) and the gamma coeffi-cient (Eq. 2).
Table 1. Beach classes along the Catalan coast in terms of sediment size and beach slope.
Beach type d50range (mm) Beach slope
I 0.1–0.4 0.090
II 0.4–0.7 0.146
III 0.7–1.0 0.156
IV 1.0–1.3 0.179
V 1.3–1.6 0.171
VI ≥1.6 0.164
by Mendoza and Jim´enez (2006). This equation relates the beach storm induced eroded volume to a simple predictor JAτ
1V =2.9(JAτ )+6.73 =h2.9D−Deq
0.5
tanβτi+6.73 (3) whereτ is the storm duration, JA is a parameter characteris-ing beach profile changes proposed by Jim´enez et al. (1993),
D=(H /wf) is the dimensionless fall velocity parameter (Dean, 1973),Deqis its value at equilibrium (2.7 when wave conditions are specified at deep waters), τ is the storm du-ration, tanβ is the beach slope, H is the wave height (here taken as Hs)wf is the sediment fall velocity and T is the wave period (here taken asTp). It has to be considered that this is a simplification of the real beach response to wave action since the pre-storm beach morphology among other factors will modulate the induced beach erosion (e.g., Mor-ton, 2002). However, the objective is not to reproduce the full response of the beach to the impact of a storm (this is usually done by numerical modelling) but to estimate an or-der of magnitude of the expected erosion. In any case, this relationship was obtained from numerical simulations of the impact of typical storm conditions and beach characteristics along the Catalan coast (Mendoza and Jim´enez, 2006). 3.4 Coastal hazards time series
Once the parameterization of storm-induced coastal pro-cesses has been defined, the next step is to obtain represen-tative time series of each hazard. First, the entire coast is divided into different geographical sectors where wave con-ditions during storms can be considered relatively homoge-neous. These sectors will be used to specify the forcing re-lated part in each indicator along the coast.
To account for the contribution of beach geomorphology to vulnerability, existing beaches along the coast have been grouped into different classes. To this end, all beaches of the study area have been classified from a morphodynamic standpoint according to its sediment mean grain size and slope. They range from reflective (coarse sand and steep slope) to dissipative (fine sand and mild slope) beaches and
1955 1960 1965 1970 1975 1980 1985 1990 1995 2000 2005 2010
Time (years)
2 3 4 5
Ru (m)
0 20 40 60 80 100
V (
m
3/m/sto
rm)
beach type II beach type III beach type IV beach type V beach type VI
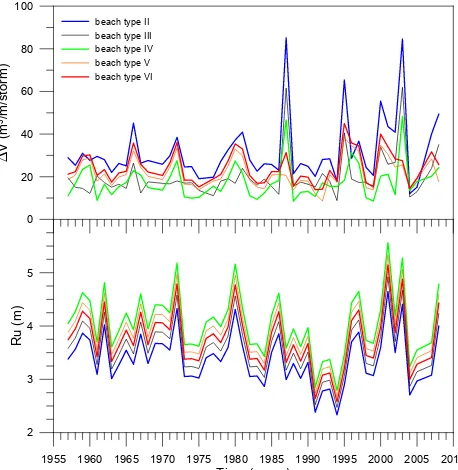
Fig. 6. Hazards time series at the central part (sector III) of the Catalan coast (see location in Fig. 1) for representative beach types. Top: erosion; bottom: inundation).
they will modulate the magnitude of the hazards for given wave conditions. Thus, 6 beach types have been defined with mean grain size values ranging from 0.1 mm to>1.6 mm in 0.3 mm intervals. For each class, the representative slope is calculated by averaging actual slope values of all beaches within the group (Table 1). Since this classification is specific for the study area, the application of the method to other ge-ographical zones would require applying the same procedure to characterize the corresponding representative beaches.
Once we have the storm time series for the different sec-tors along the coast and the existing beach types, inunda-tion and erosion hazards time series are built for each coastal sector and each beach type. This will permit to directly as-sess spatial and temporal variations of storm-induced hazards over a period of 50 years for different coastal regions. As an example, Fig. 6 shows the 50-years hazard’s time series ob-tained for existing representative beaches along sector III in the Catalan coast (see Fig. 1).
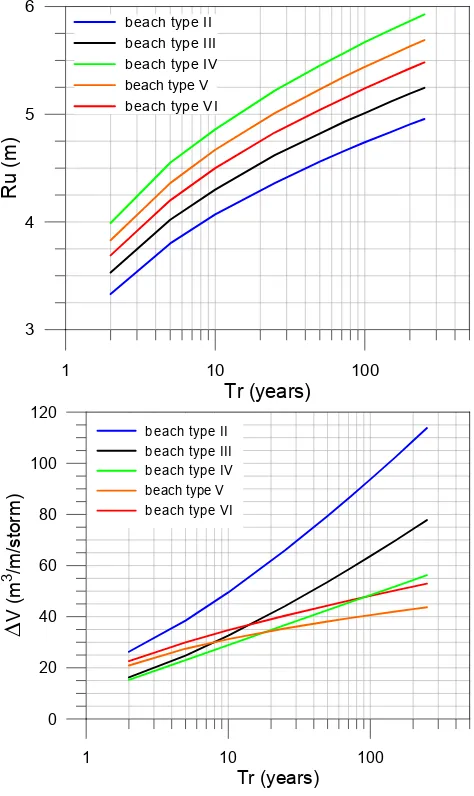
1 10 100 Tr (years)
3 4 5 6
Ru
(m)
beach type II beach type III beach type IV beach type V beach type VI
1 10 100
Tr (years)
0 20 40 60 80 100 120
V (
m
3/m/storm)
beach type II beach type III beach type IV beach type V beach type VI
Fig. 7. Extreme probability distributions obtained for inundation and erosion hazards and for different beach types.
3.5 Hazard extreme probability distribution
Once hazards time series have been obtained, an extreme probability distribution is fitted to the data to characterize them in probabilistic terms. This has been done following the “response approach” (see e.g., Divoky and McDougal, 2006) in which the probabilities are directly assigned to the processes (hazards) and not to the drivers that generate them (storm). This approximation is especially appropriated when processes depend on more than one variable (Hs,Tp, dura-tion) and particularly when this dependence differs between considered processes (e.g., see Fig. 6).
There exist several functions to define extreme probability distributions (see e.g., Hawkes et al., 2008). In this study we have used the Weibull tri-parametric and the Gumbell (Fisher Typett Type I) distributions, being selected the one present-ing the best fit. In all the cases, the best fitted distribution was the Weibull one, with correlation factors larger than 0.96.
As a result of this step, different hazard extreme probabil-ity distributions are obtained for each location and for each beach type. This permits to assess the spatial variations in hazards intensity along different geographical regions and to compare them in a robust manner (see e.g., Jim´enez et al., 2009). Figure 7 shows the extreme probability distribu-tions obtained for each hazard at sector III (wave data from Tordera buoy and valid for the central coast). Results in-dicate that the highest intensity of the potential inundation will verify as expected, for the most reflective beaches (beach type IV) whereas the largest erosion corresponds to the finest sediment beaches (beach type II). It has to be considered that the most dissipative beaches (type I) are not likely to be found in this sector, where the 97% of the existing beaches fall in the range from types II to VI. The different shape of variation of run-up and erosion magnitudes between beaches is due to the fact that the first one is only controlled by one variable (slope) whereas the second depends on two beach properties (slope and grain size).
In summary, the obtained results along the coast reflects the fact that the method is able to quantify the difference in hazards intensity associated to a given probability of occur-rence due to wave contribution (coastal sector) and geomor-phology (beach characteristics). At this point it has to be stressed that the highest values of hazard intensity do not nec-essarily imply the highest vulnerability. To convert them, the capacity of the coastal system to cope with the hazards has to be taken into consideration. Despite this, this hazard assess-ment provides the decision-maker with information about the spatial variation in the intensity of the potential problems and their probability of occurrence.
3.6 Storm-induced coastal vulnerability
The final step of the methodology consists of including the ability of the coastal system to cope with the induced impacts to quantify the vulnerability of the system. In this approach, the beach response capability has been characterised by using a beach variable related to each of considered hazards. Thus, in the case of inundation, the parameter used as a proxy of the resilience of the beach is the dune or, if absent, the berm height, because as higher the beach is the smaller the inun-dation will be. This is formulated in terms of an intermediate variable:
I V=Ru/Bmax (4)
in whichBmaxis the maximum of berm or dune heights. Similarly, the parameter used to indicate the capacity of the beach to cope with erosion was the beach width. Thus, the wider the beach is, the smaller the probability to be fully eroded (and, in consequence, infrastructures in the hinterland to be exposed) will be. This is formulated in terms of an intermediate variable:
where 1x is the storm-induced beach retreat and Wav is the average beach width. In first approximation, this value has been obtained by dividing the eroded volume (3) by the height of the eroded part of the profile, der, (Fig. 5), although a similar relationship to Eq. (3) formulated for storm-induced shoreline retreat can also be applied (see e.g., Mendoza and Jim´enez, 2006).
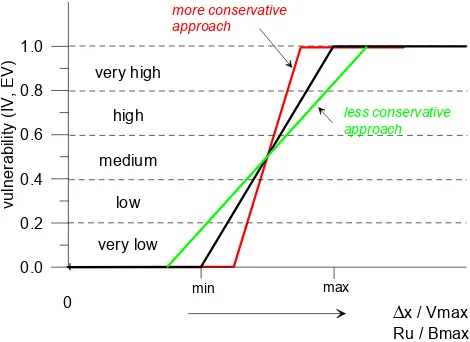
It has to be mentioned that, even in the context of a steady forcing (storm climate), beach vulnerability could change due to a change in beach morphology (width and elevation). To account this potential variation, the coastal database needs to be updated (periodically and/or after the impact of a signif-icant event) to properly reflect the beach actual morphology. The resulting vulnerability to each process is formulated in terms of these two intermediate variables by means of the functional relationship shown in Fig. 8. The vulnerability is scaled in a range from a minimum 0 value (safe beach) to a maximum of 1 (extreme vulnerable beach), which is divided in 5 qualitative classes (very low, low, medium, high, very high).
Here we assume that vulnerability linearly depends on the intermediate variable with the slope of the curve being a function of the level of safety of the analysis. Thus, more conservative analyses (indicating larger vulnerabilities for the same hazard conditions) will have steeper curves and vice versa. The slope of the curve depends on the selected value of the intermediate variables at the end of the range.
In the case of vulnerability to inundation, the minimum value (0) has been fixed to the situation in which the run-up magnitude is the half of the actual berm height,
Bmax=2Ru (6)
whereas the maximum value (1) will occur when the run-up exceeds by two meters the maximum berm height,
Bmax=Ru−2 (7)
These values have been selected arbitrarily as a function of the characteristics of the study area and, for the maximum case, they represent overtopping conditions with significant water volumes flowing to the hinterland. These values need to be adapted to specific conditions of the area to be analysed. In terms of erosion, the maximum vulnerability (1) has been fixed to the situation in which the beach width equals the minimum beach width (Wmin) plus the induced beach re-treat (1x),
Wav=Wmin+1x (8)
The minimum beach width is defined as the required mini-mum value to maintain the beach operative and/or to avoid the direct exposure of the hinterland to the sea water. For instance, this value can be set to the minimum width to let machinery work along the beach to repair damages in infras-tructures in the hinterland (e.g., to repair promenades). In
0.0 0.2 0.4 0.6 0.8 1.0
vulnerability
(IV, EV
)
very low low medium
high very high
less conservative approach
more conservative approach
x / Vmax
Ru / Bmax
0 min max
Fig. 8. Functional relationships to describe the vulnerability indica-tor in the function of the level of awareness. Red line is used in this study.
this work, we have selected a value of 5 m to let trucks and bulldozers operate after storm-induced damages.
On the other hand, the minimum vulnerability (0) will oc-cur when the average beach width equals the minimum beach width plusαtimes the beach retreat (1x),
Wav=Wmin+α1x (9)
Theα-factor can be selected as a function of the number of expected storms of the same intensity per year, and it should be selected as a function of the wave climate and, also, de-pending on the level of safety of the analysis. In this work we have usedα=3.
Finally, in order to obtain the vulnerability values a re-turn period has to be selected to quantify the hazard intensity associated with Tr for all beach types and coastal sectors. The selection of the return period (Tr) used in the vulnera-bility assessment depends on the level of safety required by the decision-maker, which depends on the importance of the hinterland. According to this importance, a probability of occurrence,R, is selected and then the corresponding return period is estimated within a given time period of concern,
L. The relationship between these three variables can be ex-pressed by (Borgman, 1963)
R=1−
1− 1
Tr
L
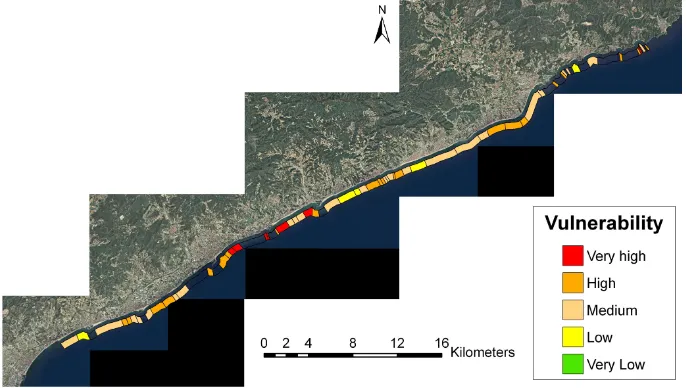
Fig. 9. Beach vulnerability to inundation associated to a return period of 50 years along the central part of the Catalan coast (Tordera sector).
Fig. 10. Beach vulnerability to erosion associated to a return period of 50 years along the central part of the Catalan coast (Tordera sector).
it will have an economic repercussion ranging from low to medium, which correspond to maximum admissible proba-bilities,R, of 0.5 and 0.3, respectively (Puertos del Estado, 1990). By substituting these values in Eq. (10), the return period of the hazards to be considered in the analysis should vary between 37 and 71 years, respectively. In this exam-ple, we have selected a return period of 50 years which is the middle of the estimated range.
The beach vulnerability to storm-induced inundation as-sociated to a 50 years return period along the central coast of Catalonia (sector III) is shown in Fig. 9. The study area is about 46 km long and it is composed by about 59 sandy beaches. Most of the beaches are composed of coarse sands and have steep slopes, i.e., they can be classified as
reflec-tive. As a consequence of this, wave-induced run-up will be high. However, this type of beach is also characterised by having relatively high berms which would tend to counter-act the effect of the hazard. This is reflected in the obtained spatial pattern of vulnerability which essentially reflects vari-ations in beach height. In this case, about 34% of the coast-line within the study area is highly or very highly vulnerable to inundation, whereas about 54% falls into the category of medium vulnerability. This should indicate that the hinter-land in this area is prone to be affected by inundation and, in fact, problems of overtopping are relatively frequent.
low vulnerability, on one hand, because the expected erosion for these beaches is relatively small and, on the other hand, many of them are very wide. This is reflected in the fact that only about 20% of the coastline falls into the category of medium vulnerability or higher. The area with the high-est vulnerability is located at the S, where beaches are com-posed by finer sediments and are relatively narrow. In situ observations of storm impacts in the area indicate that some locations in the N have been affected by erosion during the last years. This apparent disagreement between predictions and reality is probably due to the use of the average beach width as the variable coping with erosion, whereas problems should occur if at least one part of the beach is narrower than the expected erosion. This should indicate that for safety purposes, the vulnerability assessment here presented should be complemented with one using the minimum beach width to obtain the intermediate variable (Eq. 5). In the southern part of the area, where highly vulnerable beaches dominate, the main contribution to such high values is the decrease in beach width due to medium-term erosion downcoast of exist-ing marinas. To reduce the effect of this erosion, the Spanish Ministry of Environment has supplied about 13 millions of m3of sand in this sector since 1987.
Another point to be considered in this kind of analysis is that vulnerability assessment needs to be updated as beaches evolve. As it was previously mentioned, the intensity of the hazard and the capacity of the beach to cope with it depend on the pre-storm morphology. Thus, if coastal managers want to have a reliable estimation of coastal vulnerability to storm impacts, any assessment method as presented here, needs to be complemented with a coastal monitoring plan.
4 Summary and conclusions
With the developed methodology, storm-induced coastal vul-nerability can be evaluated by taking into account the differ-ent induced processes separately (inundation and erosion). This is an important aspect because although they are related, they do not depend in the same way on storm characteris-tics and, also because they induce different damages in the coastal zone.
The adopted probabilistic approach permits a robust com-parison of coastal vulnerability at regional scale to allocate existing resources for mitigating/managing damages. Thus, once an accepted probability is defined by the manager, the comparison of hazards and vulnerabilities associated to the same probability of occurrence will permit the identifying of the most hazardous areas. Hazards associated to the selected probability do not necessarily correspond to the same storm event and, thus, the analysis includes the spatial variability in the storm climate along the coast.
One of the aspects to be considered in applying the pro-posed methodology is the need of long time series of wave data to obtain reliable extreme distributions of considered
hazard parameters. Since this is not likely to occur for most of the coasts worldwide, one of the usual ways to solve this problem is the use of hindcast data as it has been done here. However, it is important to stress the need of validat-ing/calibrating such data for local conditions to assess their reliability. In the case of the Catalan coast, although the hindcast data have been calibrated against recorded ones, a relatively large dispersion of data around the fitted model did exist. Due to this, calculated vulnerability values must be up-dated by using new hazard time series as new wave data are recorded, which will permit the recalculation of the extreme wave climate.
Coastal managers play an important role in the assessment, since they must decide the probability of occurrence to be accepted as well as the period of concern of the analysis. These two variables will determine the return period to be considered in the analysis.
Obtained results have been presented graphically by using a GIS database to facilitate their interpretation/visualisation and their spatial analysis. In this sense, they can easily be combined with a land use map to identify coastal uses and resources at risk. This should support coastal managers to make informed decisions for managing coastal disasters.
The described methodology has been applied to a 50 km long coastal stretch of the Catalonia (NW Mediterranean) where offshore wave conditions can be assumed to be ho-mogeneous. In spite of this spatially constant wave field, ob-tained results indicate a large variability in hazards intensity along the coast. This fact highlights the importance of the contribution of the beach geomorphology to hazards inten-sity. Moreover, this influence is even larger when the vulner-ability is assessed because actual beach dimensions will con-trol the local capacity to cope with hazards for each beach. This also implies that time-varying beach properties such as width and elevation need to be updated to have a reliable es-timation of coastal vulnerability in evolving systems. How-ever, before applying this methodology in real situations, it has to be locally validated by relating estimated vulnera-bilities to real coastal damages (e.g., Jim´enez et al., 2010). In this sense, the storm-induced vulnerability has been un-derpredicted in some points along the coast where beaches present local widths significantly narrower than the average value. To overcome this, we are increasing the spatial resolu-tion to characterise beach properties controlling the capacity to cope with hazards.
Acknowledgements. This work has been done in the framework
Edited by: J. Salat
Reviewed by: J. Guill´en and another anonymous referee
References
Bola˜nos, R., S´anchez-Arcilla, A., and Cateura, J.: Evaluation of two atmospheric models for wind-wave modelling in the NW Mediterranean, J. Mar. Syst., 65, 336–353, 2007.
Borgman, L.: Risk Criteria, J. Waterw. Port C.-ASCE, 89, WW3, 1–35, 1963.
Borgman, L. E. and Resio, D. T.: Extremal Prediction in Wave Cli-matology, Proc. Ports 77, ASCE, New York, N.Y., p. 394–412, 1977.
CADS: Informe sobre l’evoluci`o de l’estat del medi ambient a Catalunya: litoral, biodiversitat i sol i territori 2. Consell Assessor per al Desenvolupament Sostenible, Generalitat de Catalunya, Barcelona, 375 pp., 2005.
Cavaleri, L. and Bertotti, L.: Accuracy of the modelled wind and wave fields in enclosed seas, Tellus, 56a, 167–175, 2004. Coles, S.: An introduction to statistical modeling of extreme values,
Springer-Verlag, 226 pp., 2001.
Dean, R.: Heuristic models of sand transport in the surf zone, First Australian Conference on Coastal Engineering, 208–214, 1973. Directive 2007/60/EC of the European Parliament and of the
Coun-cil of 23 October 2007 on the Assessment and Management of Flood Risks, 2007.
Divoky, D. and McDougal, W. G.: Response-based coastal flood analysis, Proc. 30th Int. Conf. on Coastal Engineering, ASCE, 5291–5301, 2006.
Ferreira, O.: Coastal Zone Vulnerability and Risk Evaluation. A Tool For Decision-Making (An Example In The Caparica Littoral – Portugal), J. Coast. Res., SI 39, 1590–1593, 2004.
Godschalk, D. R., Brower, D. J., and Beatley, T.: Catastrophic Coastal Storms, Hazard Mitigation and Development Manage-ment, Duke University Press, Durham, 1989.
Gouldby, B. and Samuels, P.: Language of Risk, Project defini-tions, FLOODsite Project Report T32-04-01, EU GOCE-CT-2004-505420, 2005.
Guedes-Soares, C., Weisse, R., Carretero, J. C., and Alvarez, E.: A 40 years hindcast of wind, sea level and waves in European waters, Proc. 21st Int. Conf. on Offshore Mechanics and Arctic Engineering, ASME, Paper OMAE2002-28604, 2002.
Hawkes, P. J., Gonzalez-Marco, D., Sanchez-Arcilla, A., and Pri-nos, P.: Best practice for the estimation of extremes: A review, J. Hydraul. Res., 46, 324–332, 2008.
Jim´enez, J. A., S´anchez-Arcilla, A., and Stive, M. J. F.: Discussion on prediction of storm/normal beach profiles, J. Waterw. Port. C-ASCE, 19(4), 466–468, 1993.
Jim´enez, J. A., Ciavola, P., Balouin, Y., Armaroli, C., Bosom, E., and Gervais, M.: Geomorphic coastal vulnerability to storms in microtidal fetch-limited environments: Application to NW Mediterranean & N Adriatic Seas, J. Coast. Res., SI 56, 1641– 1645, 2009.
Jim´enez, J. A., Sancho, A., Bosom, E., Valdemoro, H. I., Guill´en, J., and Galofr´e, J.: Validation of vulnerability assessment to storms at the Catalan coast (NW Mediterranean) during the last 50 years, 32nd Coast. Eng. Conf., ASCE, Shanghai, Book of Abstracts, 23, 2010.
McFadden, L., Nicholls, R. J., and Penning-Rowsell, E.: Managing Coastal vulnerability, Elsevier, 262 pp., 2007.
Mendoza, E. T. and Jim´enez, J. A.: Storm-Induced Beach Erosion Potential on the Catalonian Coast, J. Coast. Res., SI 48, 81–88, 2006.
Mendoza, E. T. and Jimenez, J. A.: Clasificaci´on de tormentas costeras para el litoral Catal´an (Mediterr´aneo NO), Ing. Hidraul. Mex., XXIII, 2, 21–32, 2008.
Mendoza, E. T. and Jim´enez, J. A.: Regional geomorphic vulnera-bility analysis to storms for Catalan beaches, P. I. Civil Eng-Mar. En., 162(3), 127–135, 2009.
Morton, R. A.: Factors controlling storm impacts on coastal barriers and beaches: A preliminary basis for near real-time forecasting, J. Coastal Res., 18(3), 486–501, 2002.
Morton, R. A. and Sallenger, A. H.: Morphological impacts of ex-treme storms on sandy beaches and barriers, J. Coast. Res., 19, 560–573, 2003.
PAP/RAC: ICZM Protocol in the Mediterranean, Split, 2007. P´erez-Maqueo, O., Intralawan, A., and Martinez, M. L.: Coastal
disasters from the perspective of ecological economics, Ecol. Econom., 63, 273–284, 2007.
Pethick, J. S. and Crooks, S.: Development of a coastal vulnera-bility index: a geomorphological perspective, Environ. Conserv., 27(04), 359–367, 2002.
Prasad, K. V. S. R., Arun Kumar, S. V. V., Venkata Ramu, Ch., and Sreenivas, P.: Significance of nearshore wave parameters in identifying vulnerable zones during storm and normal conditions along Visakhapatnam coast, India, Nat. Hazards, 49, 347–360, 2009.
Puertos del Estado: ROM 0.2-90, Actions in the design of maritime and harbor works. Spanish Ministry of Public Works, Madrid, 264 pp., 1990.
S´anchez-Arcilla, A., Jim´enez, J. A., and Valdemoro, H. I.: The Ebro delta: morphodynamics and vulnerability, J. Coast. Res., 14(3), 754–772, 1998.
Sard´a, R., Avila, C., and Mora, J.: A methodological approach to be used in integrated coastal zone management process: the case of the Catalan Coast (Catalonia, Spain), Estuar. Coast. Shelf Sci., 62, 427–439, 2005.
Stockdon, H. F., Holman, R. A., Howd, P. A., and Sallenger, A. H.: Empirical parameterization of setup, swash, and runup, Coast. Eng., 53, 573–588, 2006.
van der Meer, J. W. and Janssen, W.: Wave run-up and wave over-topping at dikes, in: Wave forces on inclined and vertical wall structures, edited by: Kobayashi, N. and Demirbilek, Z., ASCE, 1–27, 1995.