Therapeutics and Clinical Risk Management 2018:14 1347–1359
Therapeutics and Clinical Risk Management
Dove
press
submit your manuscript | www.dovepress.com 1347
O R i g i n a l R e s e a R C h open access to scientific and medical research
Open access Full Text article
serum uric acid on admission cannot predict
long-term outcome of critically ill patients:
a retrospective cohort study
Qinchang Chen1,*
Kai huang2,*
lingling li2
Xixia lin2
Cong Ding2
Junrui Zhang3
Qingui Chen1
1Department of Medical intensive Care Unit, The First affiliated hospital, sun Yat-sen University, guangzhou, China; 2Division of Vascular and Thyroid surgery, sun Yat-sen Memorial hospital, sun Yat-sen University, guangzhou, China; 3guangzhou institute of standardization, guangzhou, China *These authors contributed equally to this work
Purpose: We aimed to evaluate the association of serum uric acid on admission with long-term outcome of critically ill patients.
Materials and methods: We conducted a retrospective cohort study using data extracted from the Medical Information Mart for Intensive Care III database. The primary endpoint was 90-day mortality. Propensity score matching (PSM) was performed, and multivariate Cox regression analysis was used to adjust for potential confounders. Receiver operating characteristic (ROC) curves were also used to assess the mortality predictions.
Results: A total of 2,123 patients were included finally with a PSM cohort consisting of 556 90-day non-survivors matched 1:1 with 556 90-day survivors. No statistically significant differ-ence of median admission uric acid was observed between the two groups (survivors 5.50 mg/dL vs non-survivors 5.60 mg/dL, p=0.536). ROC area under the curve was 0.511 (95% confidence interval [CI] 0.477–0.545), suggesting that uric acid had poor discriminative powers for predict-ing 90-day mortality. No significant association between uric acid and 90-day mortality was found (hazard ratio 1.00, 95% CI 0.98–1.03, p=0.6835).
Conclusion: Serum uric acid on intensive care unit admission failed to predict 90-day mortality of critically ill patients.
Keywords: uric acid, critical care, mortality, risk factors
Introduction
Uric acid, the end product of an exogenous pool of purines, which functions as either an antioxidant or a pro-oxidant, has been reported as a predictor of outcomes
in multiple diseases.1–4 Related research studies focused mainly on cardiovascular
disease and found that uric acid might serve as a biomarker of severity of coronary artery disease in patients with acute coronary syndrome, cardiovascular mortality, 1-year mortality of patients with acute coronary syndromes treated with percutaneous coronary intervention, and might improve the prognostic accuracy of some clinical
models.5–8 The prognostic and predictive value of uric acid was also explored in
type 2 diabetic patients and patients who had open heart surgery.9,10 However, the
value of initial serum uric acid on admission in critically ill patients seems limited. Akbar et al reported that elevated uric acid levels in patients with sepsis are associ-ated with an increased risk of acute kidney injury and acute respiratory distress syn-drome, but Zhu et al found that there was no correlation between the initial levels of
serum uric acid and prognosis of infection in critically ill patients.11,12 Meanwhile,
it has been reported that no relationship was found between serum uric acid and
Correspondence: Qingui Chen Department of Medical intensive Care Unit, The First Affiliated Hospital, Sun Yat-sen University, no 58 Zhongshan Rd 2, 510080 guangzhou, China Tel +86 135 8044 2523 email 920835644@qq.com
Journal name: Therapeutics and Clinical Risk Management Article Designation: Original Research
Year: 2018 Volume: 14
Running head verso: Chen et al
Running head recto: Serum uric acid cannot predict long-term outcome of critically ill patients DOI: 170647
Therapeutics and Clinical Risk Management downloaded from https://www.dovepress.com/ by 118.70.13.36 on 27-Aug-2020
For personal use only.
Dovepress
Chen et al
short-term mortality of critically ill patients.13,14 To the
best of our knowledge, there is no research to evaluate the association of serum uric acid on intensive care unit (ICU) admission with long-term outcome of critically ill patients. Thus, we performed a retrospective cohort study using a modifiable data mining technique applied to the publicly available Medical Information Mart for Intensive Care III (MIMIC-III) database, aiming to clarify whether there is an association between admission serum uric acid levels and
long-term outcome.15
Materials and methods
study design and data sources
We conducted a retrospective cohort study using data extracted from the MIMIC-III database, which is a large publicly available database consisting of de-identified health-related data of patients who had stayed in the ICU of Beth Israel Deaconess Medical Center between 2001 and 2012. Access to database has been approved by the institutional review boards of both Beth Israel Deaconess Medical Center and Massachusetts Institute of Technology Affiliates. No informed consent was required on the de-identified patients.
Participants
Adult patients (aged 18 years) of first hospital admission
and first ICU admission were considered and included, but
patients staying at ICU for 1 day and patients without
admission serum uric acid records were excluded. In addi-tion, patients whose death was earlier than ICU admission time and patients whose length of hospital stay was less than length of ICU stays were excluded in order to exclude potential typographical errors and records of organ donor account (Figure 1).
Variables
We applied Structured Query Language to extract data from the database mainly by using codes from the MIMIC Code
Repository.16,24 Age, sex, ICU mortality and hospital
mortal-ity, length of ICU stay and length of hospital stay, 28-day mortality and 90-day mortality, admission serum uric acid (admission was defined as within 24 hours after ICU admis-sion), Simplified Acute Physiology Score II (SAPS II), the Elixhauser comorbidities, and the Elixhauser Comorbidity Index (State Inpatient Database [SID]30) were extracted
or calculated.17–19 Missing components for the calculation
of SAPS II were treated as normal (usually 0). Because the database has had date of birth of patients who are older than
89 years shifted to exactly 300 years before to obscure their
age, we corrected them (age -300+89) before analysis.
Outcome measures
Ninety-day mortality after ICU admission was chosen as the primary end point, and 28-day mortality, hospital mortality, and ICU mortality were secondary outcomes. ICU mortality was determined only by the first ICU stay.
Propensity score matching (PsM)
We grouped the study subjects as survivors and non-survivors according to their 90-day survival status after ICU admis-sion. The propensity score for each patient was calculated to estimate their probability of death during the first 90 days after ICU admission by using multivariable logistic regres-sion models given the following covariates: gender, age, SAPS II, Elixhauser Comorbidity Index (SID30), sepsis (based on International Classification of Diseases, Ninth Revision [ICD-9] codes), mechanical ventilation on the first day, renal replacement therapy on the first day, congestive heart failure, cardiac arrhythmias, valvular disease, pul-monary circulation disorder, peripheral vascular disorder, hypertension, paralysis, other neurological disease, chronic pulmonary disease, uncomplicated diabetes, complicated
)LUVW,&8DGPLVVLRQ )LUVWKRVSLWDODGPLVVLRQ
$JH\HDUV Q
Q ,QFOXGHGLQDQDO\VLV
Q %ORRGXULFDFLGQRWQXOO
Q /26KRVSLWDO/26,&8
Q
7LPHRIGHDWK,&8DGPLVVLRQWLPH Q
/26,&8G
Figure 1 Flow chart of the study.
Abbreviations: iCU, intensive care unit; lOs, length of stay.
Therapeutics and Clinical Risk Management downloaded from https://www.dovepress.com/ by 118.70.13.36 on 27-Aug-2020
Dovepress serum uric acid cannot predict long-term outcome of critically ill patients
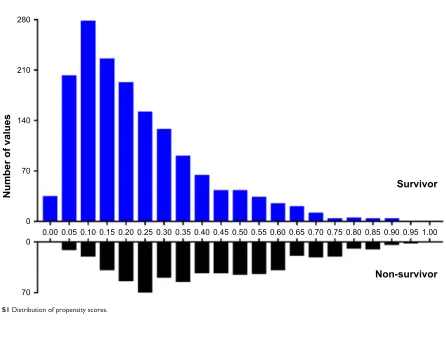
diabetes, hypothyroidism, renal failure, liver disease, peptic ulcer, acquired immune deficiency syndrome, lymphoma, metastatic cancer, solid tumor, rheumatoid arthritis, coagu-lopathy, obesity, weight loss, fluid and electrolyte disorders, blood loss anemia, deficiency anemia, alcohol abuse, drug abuse, psychoses, and depression. Matching was performed with the use of a 1:1 matching protocol without replacement (greedy-matching algorithm), with a caliper width equal to 0.05 of the standard deviation of the logit of the propensity score. The overlap of the distribution of the propensity scores across survivors and non-survivors groups is shown in Figure S1.
statistical analysis
For continuous variables, data were expressed as median and interquartile range (IQR) unless otherwise stated. For categorical variables, data were shown as numbers and per-centages. Comparison of continuous and categorical variables was performed using Kruskal-Wallis and chi-square (or Fisher’s exact) tests, respectively. We used receiver operating characteristic (ROC) curves to evaluate the prognostic predic-tive value of serum uric acid for 90-day mortality and other outcomes and used the Kaplan–Meier (K-M) method and log-rank tests to compare survival differences among patients of different admission serum uric acid levels. Variables asso-ciated with 90-day mortality were evaluated by univariate
Cox regression analysis, and those with a p-value 0.1 were
considered in multivariable Cox regression model. Consider-ing the expected collinearity between comorbidities and the Elixhauser Comorbidity Index (SID30), we would choose only either one of them to be enrolled into one adjusted
model when variables are potentially significant (p0.1) in
univariate analysis. Age was not included in the multivari-able regression analysis since it was factored into SAPS II. Multivariable Cox regression model was performed to evalu-ate the association of serum uric acid on 90-day mortality and 28-day mortality, and multivariable logistic regression model was used to examine the association between hospital
mortality and ICU mortality. p-values of 0.05 were
consid-ered to indicate statistical significance. Empower(R) (www.
empowerstats.com; X&Y solutions, Inc., Boston, MA, USA)
and R software, version 3.4.3 (http://www.r-project.org;
R Foundation for Statistical Computing, Vienna, Austria) were used for statistical analyses.
Results
Patient characteristics
A total of 2,123 patients were included (Figure 1). As shown in Table 1, the median age of the study patients was
64.09 years (IQR 51.39–75.74 years) and 1,219 of the 2,123 cases (57.42%) were male. The median admission serum uric acid was 5.40 mg/dL (IQR 3.80–7.90 mg/dL) with a median SAPS II score of 39 (IQR 30–49). Among them, 239 (11.26%) patients were diagnosed with sepsis based on ICD-9 codes and 1,032 (48.61%) patients required mechanical ventilation on admission. The five most common comorbidities were fluid and electrolyte disorders (38.48%), congestive heart failure (20.35%), deficiency anemia (20.16%), cardiac arrhythmias (20.07%), and coagulopathy (19.31%). The 90-day mortal-ity was 27.23% with 578 non-survivors and 1,545 survivors. The length of ICU stay and hospital stay was 3.79 (IQR 2.01–9.19) and 14.69 (IQR 8.05–26.37) days, respectively.
Non-survivors had significantly higher SAPS II (p0.001).
No statistically significant difference was observed in serum uric acid between survivors and non-survivors.
Characteristics of the PsM cohort
A total of 556 non-survivors were successfully matched with one control. Characteristics of PSM cohort are shown in Table 2. There was no statistically significant difference between survivors and non-survivors in age, gender, SAPS II on admission, Elixhauser Comorbidity Index (SID30), and
comorbidities (p0.05), and no statistically significant
dif-ference was found on serum uric acid between survivors and non-survivors.
survival status of patients with different
serum uric acid levels on admission
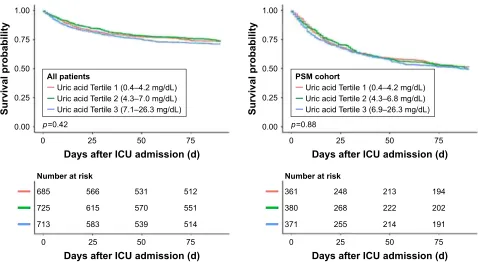
Patients were grouped according to their serum uric acid levels on admission. The K-M survival curves presented in Figure 2 showed that there was no difference in the survival rate among different serum uric acid levels on admission
(log-rank test: p=0.88) after PSM. The K-M survival curves
of 28-day mortality are shown in Figure S2.
ROC curve analysis
As shown in Figure 3, the area under the ROC curve (AUC) of admission serum uric acid for discrimination of 90-day survivors and non-survivors was 0.522 (95% confidence interval [CI] 0.494–0.550) and 0.511 (95% CI 0.477–0.545) for all patients and PSM cohort, respectively. ROC curve analysis of other outcomes also indicated a poor predictive value of serum uric acid.
association between serum uric acid
levels on admission and iCU outcomes
Results of univariate Cox regression analysis of all patients and PSM cohort are presented in Tables S1 and S2,
Therapeutics and Clinical Risk Management downloaded from https://www.dovepress.com/ by 118.70.13.36 on 27-Aug-2020
Dovepress
Chen et al
respectively. As shown in Table 3, multivariable regression analysis of PSM cohort indicated that serum uric acid was not an independent risk factor of 90-day mortality (hazard ratio
[HR] 1.00, 95% CI 0.98–1.03, p=0.6835), 28-day mortality
(HR 1.01, 95% CI 0.98–1.04, p=0.4894), hospital mortality
(odds ratio [OR] 1.01, 95% CI 0.97–1.04, p=0.6099), and
ICU mortality (OR 1.01, 95% CI 0.97–1.05, p=0.6934).
Results of regression analysis of all patients are also shown in Table 3.
Discussion
For the first time, the present study evaluated the associa-tion between serum uric acid on ICU admission and long-term outcome of critically ill patients. Results of the study Table 1 Characteristics and comparison between survivors and non-survivors of all patients
Variable All patients
(n=2,123)
Survivors (n=1,545)
Non-survivors (n=578)
p-value
age (years) 64.09 (51.39–75.74) 62.11 (48.68–73.83) 68.97 (57.79–79.52) 0.001
Male 1,219 (57.42%) 895 (57.93%) 324 (56.06%) 0.437
iCU mortality 187 (8.81%) 0 (0.00%) 187 (32.35%) 0.001
hospital mortality 379 (17.85%) 4 (0.26%) 375 (64.88%) 0.001
length of iCU stay (days) 3.79 (2.01–9.19) 3.47 (1.94–9.14) 4.21 (2.31–9.31) 0.001
length of hospital stay (days) 14.69 (8.05–26.37) 14.32 (7.90–26.00) 15.84 (9.03–27.50) 0.051
Uric acid on admission (mg/dl) 5.40 (3.80–7.90) 5.30 (3.80–7.80) 5.70 (3.90–8.00) 0.119
saPs ii on admission 39 (30–49) 36.00 (28.00–45.00) 47.00 (39.00–56.00) 0.001
elixhauser Comorbidity index (siD30) 11.00 (4.00–23.00) 11.00 (0.00–20.00) 17.00 (11.00–28.00) 0.001
sepsis (based on iCD-9 codes) 239 (11.26%) 132 (8.54%) 107 (18.51%) 0.001
Mechanical ventilation on first day 1,032 (48.61%) 754 (48.80%) 278 (48.10%) 0.772
Renal replacement therapy on first day 135 (6.36%) 93 (6.02%) 42 (7.27%) 0.295
Comorbidities
Congestive heart failure 432 (20.35%) 268 (17.35%) 164 (28.37%) 0.001
Cardiac arrhythmias 426 (20.07%) 268 (17.35%) 158 (27.34%) 0.001
Valvular disease 109 (5.13%) 67 (4.34%) 42 (7.27%) 0.006
Pulmonary circulation disorder 110 (5.18%) 70 (4.53%) 40 (6.92%) 0.027
Peripheral vascular disorder 185 (8.71%) 130 (8.41%) 55 (9.52%) 0.423
hypertension 239 (11.26%) 169 (10.94%) 70 (12.11%) 0.447
Paralysis 51 (2.40%) 36 (2.33%) 15 (2.60%) 0.723
Other neurological disease 182 (8.57%) 127 (8.22%) 55 (9.52%) 0.343
Chronic pulmonary disease 327 (15.40%) 238 (15.40%) 89 (15.40%) 0.997
Uncomplicated diabetes 365 (17.19%) 267 (17.28%) 98 (16.96%) 0.859
Complicated diabetes 133 (6.26%) 96 (6.21%) 37 (6.40%) 0.874
hypothyroidism 170 (8.01%) 126 (8.16%) 44 (7.61%) 0.682
Renal failure 302 (14.23%) 212 (13.72%) 90 (15.57%) 0.278
liver disease 152 (7.16%) 98 (6.34%) 54 (9.34%) 0.017
Peptic ulcer 1 (0.05%) 1 (0.06%) 0 (0.00%) 1.000
aiDs 15 (0.71%) 10 (0.65%) 5 (0.87%) 0.569
lymphoma 89 (4.19%) 55 (3.56%) 34 (5.88%) 0.017
Metastatic cancer 121 (5.70%) 54 (3.50%) 67 (11.59%) 0.001
solid tumor 59 (2.78%) 43 (2.78%) 16 (2.77%) 0.985
Rheumatoid arthritis 49 (2.31%) 31 (2.01%) 18 (3.11%) 0.130
Coagulopathy 410 (19.31%) 252 (16.31%) 158 (27.34%) 0.001
Obesity 84 (3.96%) 61 (3.95%) 23 (3.98%) 0.974
Weight loss 127 (5.98%) 80 (5.18%) 47 (8.13%) 0.011
Fluid and electrolyte disorders 817 (38.48%) 548 (35.47%) 269 (46.54%) 0.001
Blood loss anemia 72 (3.39%) 65 (4.21%) 7 (1.21%) 0.001
Deficiency anemia 428 (20.16%) 322 (20.84%) 106 (18.34%) 0.201
alcohol abuse 116 (5.46%) 91 (5.89%) 25 (4.33%) 0.158
Drug abuse 56 (2.64%) 49 (3.17%) 7 (1.21%) 0.012
Psychoses 68 (3.20%) 59 (3.82%) 9 (1.56%) 0.008
Depression 112 (5.28%) 86 (5.57%) 26 (4.50%) 0.327
Notes: Patients were grouped as survivors and non-survivors determined by 90-day mortality status. Data are expressed as median (interquartile range) or n (%) unless otherwise stated. Kruskal–Wallis and chi-square (or Fisher’s exact) tests were used to analyse continuous and categorical variables, respectively. Statistical significance (p0.05) is shown in bold.
Abbreviations: ICU, intensive care unit; SAPS II, Simplified Acute Physiology Score II; ICD-9, International Classification of Diseases, Ninth Revision; AIDS, acquired immune deficiency syndrome.
Therapeutics and Clinical Risk Management downloaded from https://www.dovepress.com/ by 118.70.13.36 on 27-Aug-2020
Dovepress serum uric acid cannot predict long-term outcome of critically ill patients
indicated that serum uric acid on admission cannot predict long-term outcome of critically ill patients.
It is interesting to find no correlation between serum uric acid with clinical outcomes of critically ill patients, since many studies had reported the prognostic predictive value of serum uric acid in many clinical conditions. For example, uric acid was found to be an independent predictor of cardio-vascular outcomes and increase prognostic accuracy of Cox
models in hypertensives with normal renal function which allowed a risk reclassification according to a recent report
of Perticone et al.8 Given serum uric acid is increased in
respiratory disease, especially in the presence of hypoxia and systemic inflammation, many researchers wondered whether
it could serve as a biomarker of prognostic predictive value.20
Nagaya et al reported that serum uric acid levels correlate with the severity and the mortality of primary pulmonary Table 2 Characteristics and comparison between survivors and non-survivors of PsM cohort
Variable All patients
(n=1,112)
Survivors (n=556)
Non-survivors (n=556)
p-value
age (years) 69.00 (57.80–79.00) 69.13 (58.27–78.71) 68.97 (57.44–79.54) 0.920
Male 621 (55.85%) 306 (55.04%) 315 (56.65%) 0.587
iCU mortality 176 (15.83%) 0 (0.00%) 176 (31.65%) 0.001
hospital mortality 358 (32.19%) 3 (0.54%) 355 (63.85%) 0.001
length of iCU stay (days) 4.08 (2.16–9.48) 3.81 (2.08–9.42) 4.29 (2.39–9.49) 0.164
length of hospital stay (days) 15.98 (8.82–28.13) 16.18 (8.64–29.04) 15.87 (9.09–27.52) 0.687
Uric acid on admission (mg/dl) 5.50 (3.80–8.20) 5.50 (3.70–8.30) 5.60 (3.90–7.90) 0.536
saPs ii on admission 46.00 (37.00–55.00) 45.00 (37.00–55.00) 46.00 (38.00–55.00) 0.202
elixhauser Comorbidity index (siD30) 18.00 (10.00–28.00) 19.00 (9.75–28.00) 17.00 (10.75–27.25) 0.428
sepsis (based on iCD-9 codes) 184 (16.55%) 83 (14.93%) 101 (18.17%) 0.146
Mechanical ventilation on first day 531 (47.75%) 263 (47.30%) 268 (48.20%) 0.764
Renal replacement therapy on first day 86 (7.73%) 45 (8.09%) 41 (7.37%) 0.653
Comorbidities
Congestive heart failure 321 (28.87%) 167 (30.04%) 154 (27.70%) 0.390
Cardiac arrhythmias 297 (26.71%) 148 (26.62%) 149 (26.80%) 0.946
Valvular disease 80 (7.19%) 38 (6.83%) 42 (7.55%) 0.642
Pulmonary circulation disorder 80 (7.19%) 41 (7.37%) 39 (7.01%) 0.816
Peripheral vascular disorder 105 (9.44%) 52 (9.35%) 53 (9.53%) 0.918
hypertension 139 (12.50%) 71 (12.77%) 68 (12.23%) 0.786
Paralysis 30 (2.70%) 16 (2.88%) 14 (2.52%) 0.711
Other neurological disease 106 (9.53%) 53 (9.53%) 53 (9.53%) 1.000
Chronic pulmonary disease 183 (16.46%) 95 (17.09%) 88 (15.83%) 0.571
Uncomplicated diabetes 194 (17.45%) 97 (17.45%) 97 (17.45%) 1.000
Complicated diabetes 72 (6.47%) 39 (7.01%) 33 (5.94%) 0.465
hypothyroidism 92 (8.27%) 51 (9.17%) 41 (7.37%) 0.276
Renal failure 182 (16.37%) 95 (17.09%) 87 (15.65%) 0.517
liver disease 97 (8.72%) 48 (8.63%) 49 (8.81%) 0.915
aiDs 12 (1.08%) 7 (1.26%) 5 (0.90%) 0.773
lymphoma 68 (6.12%) 34 (6.12%) 34 (6.12%) 1.000
Metastatic cancer 99 (8.90%) 44 (7.91%) 55 (9.89%) 0.247
solid tumor 35 (3.15%) 19 (3.42%) 16 (2.88%) 0.606
Rheumatoid arthritis 35 (3.15%) 18 (3.24%) 17 (3.06%) 0.864
Coagulopathy 292 (26.26%) 146 (26.26%) 146 (26.26%) 1.000
Obesity 42 (3.78%) 20 (3.60%) 22 (3.96%) 0.753
Weight loss 93 (8.36%) 47 (8.45%) 46 (8.27%) 0.914
Fluid and electrolyte disorders 509 (45.77%) 258 (46.40%) 251 (45.14%) 0.674
Blood loss anemia 11 (0.99%) 4 (0.72%) 7 (1.26%) 0.547
Deficiency anemia 218 (19.60%) 114 (20.50%) 104 (18.71%) 0.450
alcohol abuse 48 (4.32%) 25 (4.50%) 23 (4.14%) 0.768
Drug abuse 12 (1.08%) 5 (0.90%) 7 (1.26%) 0.773
Psychoses 21 (1.89%) 12 (2.16%) 9 (1.62%) 0.509
Depression 51 (4.59%) 26 (4.68%) 25 (4.50%) 0.886
Notes: Patients were grouped as survivors and non-survivors determined by 90-day mortality status. Data are expressed as median (interquartile range) or n (%) unless otherwise stated. Kruskal–Wallis and chi-square (or Fisher’s exact) tests were used to analyze continuous and categorical variables, respectively. Statistical significance (p0.05) is shown in bold.
Abbreviations: PSM, propensity score matching; ICU, intensive care unit; SAPS II, Simplified Acute Physiology Score II; ICD-9, International Classification of Diseases, Ninth Revision; AIDS, acquired immune deficiency syndrome.
Therapeutics and Clinical Risk Management downloaded from https://www.dovepress.com/ by 118.70.13.36 on 27-Aug-2020
Dovepress
Chen et al
hypertension.21 Bartziokas et al found that serum uric acid
was associated with increased 30-day mortality and risk for future acute exacerbation of chronic obstructive pulmonary
disease.22 Ergun et al reported that high serum uric acid
levels are predictive for not only long-term mortality but also
for short-term mortality.23 However, in terms of critically
ill patients, only a few studies were conducted to explore the value of uric acid and most of the conclusions were
negative.12–14 Considering that most of the previous studies
6XUYLYDOSUREDELOLW\
6XUYLYDOSUREDELOLW\
'D\VDIWHU,&8DGPLVVLRQG
'D\VDIWHU,&8DGPLVVLRQG
1XPEHUDWULVN
1XPEHUDWULVN
'D\VDIWHU,&8DGPLVVLRQG
'D\VDIWHU,&8DGPLVVLRQG
S S
$OOSDWLHQWV
8ULFDFLG7HUWLOH±PJG/ 8ULFDFLG7HUWLOH±PJG/ 8ULFDFLG7HUWLOH±PJG/
360FRKRUW
8ULFDFLG7HUWLOH±PJG/ 8ULFDFLG7HUWLOH±PJG/ 8ULFDFLG7HUWLOH±PJG/
Figure 2 Kaplan–Meier survival curve by different levels of uric acid of all patients and PsM cohort.
Abbreviations: iCU, intensive care unit; PsM, propensity score matching.
evaluated only the short-term outcomes with limited sample sizes, we conducted this present study aiming to evaluate the predictive value of serum uric acid for long-term outcome of critically ill patients. In our study, we included over 2,000 patients which made enough adjustment for confounders available and improved statistical power. Meanwhile, we performed PSM to further minimize the potential selection bias. Results of all patients and PSM cohort were consistent and provided a solid conclusion of the association between
Figure 3 (Continued)
$OOSDWLHQWV
GD\PRUWDOLW\
$8&
6HQVLWLYLW\
±VSHFLILFLW\
360FRKRUW
GD\PRUWDOLW\
$8&
6HQVLWLYLW\
±VSHFLILFLW\
Therapeutics and Clinical Risk Management downloaded from https://www.dovepress.com/ by 118.70.13.36 on 27-Aug-2020
Dovepress serum uric acid cannot predict long-term outcome of critically ill patients
serum uric acid and 90-day mortality for critically ill patients, although negative. We also examined some short-term outcomes in the study, and the results were consistent with previous studies.
Although the findings in our study were informative, there were several limitations in the present study. First, given the observational nature of our study, it is not possible to adjust all potential confounders. Although we considered
Figure 3 ROC curves of admission serum uric acid for prediction of clinical outcomes in all patients and the PsM cohort.
Abbreviations: ROC curves, receiver operating characteristic curves; iCU, intensive care unit; aUC, area under the ROC curves; PsM, propensity score matching.
GD\PRUWDOLW\
$8&
6HQVLWLYLW\
±VSHFLILFLW\
GD\PRUWDOLW\
$8&
6HQVLWLYLW\
±VSHFLILFLW\
+RVSLWDOPRUWDOLW\
$8&
6HQVLWLYLW\
±VSHFLILFLW\
+RVSLWDOPRUWDOLW\
$8&
6HQVLWLYLW\
±VSHFLILFLW\
,&8PRUWDOLW\
$8&
6HQVLWLYLW\
±VSHFLILFLW\
,&8PRUWDOLW\
$8&
6HQVLWLYLW\
±VSHFLILFLW\
Therapeutics and Clinical Risk Management downloaded from https://www.dovepress.com/ by 118.70.13.36 on 27-Aug-2020
Dovepress
Chen et al
many variables known to affect the outcomes, unmeasured confounders may have affected our results. As we know, the reference value of serum uric acid is different between male and female; hence, gender must be considered in the K-M survival curves. In fact, the results were consistent even after grouped by sex (data not shown), but there were still other potential confounders such as renal replacement therapy on the first day, fluid and electrolyte disorders, which made it difficult to take all these confounders into consideration in the K-M curves. And since there were too many specific primary diagnoses for all the patients, we categorized the primary diseases as several comorbidities Table 3 association of uric acid with 90-day mortality, 28-day mortality, iCU mortality, and hospital mortality
Subjects HR/OR 95% CI p-value
All patients
90-day mortality
non-adjusted 1.02 1.00–1.05 0.0552
Model i 1.00 0.98–1.03 0.7743
Model ii 1.01 0.98–1.03 0.5735
28-day mortality
non-adjusted 1.03 1.00–1.06 0.0571
Model i 1.01 0.98–1.04 0.6281
Model ii 1.01 0.98–1.04 0.5785
iCU mortality
non-adjusted 1.03 0.99–1.08 0.1198
Model i 1.01 0.96–1.05 0.8157
Model ii 1.00 0.96–1.05 0.9105
hospital mortality
non-adjusted 1.04 1.00–1.07 0.0301
Model i 1.01 0.97–1.04 0.6263
Model ii 1.01 0.97–1.04 0.6924
PSM cohort
90-day mortality
non-adjusted 1.01 0.98–1.03 0.6160
Model i 1.00 0.98–1.03 0.6835
28-day mortality
non-adjusted 1.01 0.98–1.04 0.3784
Model i 1.01 0.98–1.04 0.4894
iCU mortality
non-adjusted 1.02 0.98–1.07 0.3709
Model i 1.01 0.97–1.05 0.6934
hospital mortality
non-adjusted 1.02 0.98–1.05 0.3751
Model i 1.01 0.97–1.04 0.6099
Notes: association of uric acid with 90-day mortality and 28-day mortality was analyzed using Cox regression models, and associations of uric acid with iCU mortality and hospital mortality were analyzed using logistic regression models. For all patients, model i was adjusted for saPs ii, elixhauser Comorbidity index (siD30), and sepsis based on iCD-9 codes; model ii was adjusted for saPs ii, sepsis based on iCD-9 codes, congestive heart failure, cardiac arrhythmias, valvular disease, pulmonary circulation disorder, liver disease, lymphoma, metastatic cancer, coagulopathy, weight loss, fluid and electrolyte disorders, blood loss anemia, drug abuse, and psychoses. For PsM cohort, model was adjusted for saPs ii. statistical significance (p0.05) is shown in bold.
Abbreviations: iCU, intensive care unit; hR, hazard ratio; OR, odds ratio; Ci, confidence interval; PSM, propensity score matching; SAPS II, Simplified Acute Physiology Score II; ICD-9, International Classification of Diseases, Ninth Revision.
(Tables 1 and 2) to make it easier to adjust and analyze. However, it was indisputable that some unmeasured con-founders such as gout, uremia, and other uric acid metabolic disorder might still have affected the results. In addition, as a retrospective database study, it was difficult to account for the potential effect of therapy before ICU admission on serum uric acid levels, because such information was usually not documented. Thus, further well-designed pro-spective study is needed to confirm our results. Second, the present study included data from only one ICU center, which might limit the external applicability of the study results. Third, we found no association between serum uric acid on admission and long-term outcomes of critically ill patients, but whether the changes of serum uric acid would be associated with the clinical outcomes of the patients remained unknown.
Conclusion
This large retrospective cohort study found that there was no statistically significant association of admission serum uric acid with 90-day mortality of ICU patients, providing a stronger confirmation of the controversial issue. However, further prospective basic and clinical research studies are still needed especially to reveal the underlined mechanisms and to evaluate the potential predictive value of changes of uric acid.
Acknowledgments
The study was supported by National Natural Science Foundation of China (No 81670066), Major Science and Technology Planning Project of Guangdong Province (No 2016A020216009), Natural Science Foundation of Guangdong Province China (No 2015A030310346), and Special Funds for the Cultivation of Guangdong College Stu-dents’ Scientific and Technological Innovation (“Climbing Program” Special Funds).
Author contributions
Qingui Chen designed the study and was the primary author of the manuscript. Qinchang Chen and Kai Huang mainly performed data extraction and statistical analysis. All authors contributed toward data analysis, drafting, and critically revising the paper, gave final approval of the version to be published, and agreed to be accountable for all aspects of the work.
Disclosure
The authors report no conflicts of interest in this work.
Therapeutics and Clinical Risk Management downloaded from https://www.dovepress.com/ by 118.70.13.36 on 27-Aug-2020
Dovepress serum uric acid cannot predict long-term outcome of critically ill patients
References
1. El Ridi R, Tallima H. Physiological functions and pathogenic potential of uric acid: a review. J Adv Res. 2017;8(5):487 –493.
2. Martinon F. Update on biology: uric acid and the activation of immune and inflammatory cells. Curr Rheumatol Rep. 2010;12(2):135–141. 3. Ames BN, Cathcart R, Schwiers E, Hochstein P. Uric acid provides
an antioxidant defense in humans against oxidant- and radical-caused aging and cancer: a hypothesis. Proc Natl Acad Sci U S A. 1981;78(11): 6858–6862.
4. Sautin YY, Johnson RJ. Uric acid: the oxidant-antioxidant paradox.
Nucleosides Nucleotides Nucleic Acids. 2008;27(6):608–619.
5. Duran M, Kalay N, Akpek M, et al. High levels of serum uric acid pre-dict severity of coronary artery disease in patients with acute coronary syndrome. Angiology. 2012;63(6):448–452.
6. Dutta A, Henley W, Pilling LC, Wallace RB, Melzer D. Uric acid mea-surement improves prediction of cardiovascular mortality in later life.
J Am Geriatr Soc. 2013;61(3):319–326.
7. Ndrepepa G, Braun S, Haase HU, et al. Prognostic value of uric acid in patients with acute coronary syndromes. Am J Cardiol. 2012;109(9): 1260–1265.
8. Perticone M, Tripepi G, Maio R, et al. Risk reclassification ability of uric acid for cardiovascular outcomes in essential hypertension. Int J
Cardiol. 2017;243:473–478.
9. Zoppini G, Targher G, Negri C, et al. Elevated serum uric acid con-centrations independently predict cardiovascular mortality in type 2 diabetic patients. Diabetes Care. 2009;32(9):1716–1720.
10. Gaipov A, Solak Y, Turkmen K, et al. Serum uric acid may predict development of progressive acute kidney injury after open heart surgery.
Ren Fail. 2015;37(1):96–102.
11. Akbar SR, Long DM, Hussain K, et al. Hyperuricemia: an early marker for severity of illness in sepsis. Int J Nephrol. 2015;2015:301021. 12. Zhu HC, Cao RL. The relationship between serum levels of uric acid
and prognosis of infection in critically ill patients. World J Emerg Med. 2012;3(3):186–190.
13. Hooman N, Mehrazma M, Nakhaii S, et al. The value of serum uric acid as a mortality prediction in critically ill children. Iran J Pediatr. 2010;20(3):323–329.
14. Aminiahidashti H, Bozorgi F, Mousavi SJ, Sedighi O, Gorji AM, Rashidian H. Serum uric acid level in relation to severity of the disease and mortality of critically ill patients. J Lab Physicians. 2017;9(1):42–46.
15. Johnson AE, Pollard TJ, Shen L, et al. MIMIC-III, a freely accessible critical care database. Sci Data. 2016;3:160035.
16. Johnson A, Stone DJ, Celi LA, Pollard TJ. The MIMIC code repository: enabling reproducibility in critical care research. J Am Med Inform
Assoc. 2017;25(1):32–39.
17. Le Gall JR, Lemeshow S, Saulnier F. A new Simplified Acute Physiol-ogy Score (SAPS II) based on a European/North American multicenter study. JAMA. 1993;270(24):2957–2963.
18. Steiner C, Elixhauser A, Schnaier J. The healthcare cost and utilization project: an overview. Eff Clin Pract. 2002;5(3):143–151.
19. Thompson NR, Fan Y, Dalton JE, et al. A new Elixhauser-based comorbidity summary measure to predict in-hospital mortality. Med
Care. 2015;53(4):374–379.
20. Ruggiero C, Cherubini A, Ble A, et al. Uric acid and inflammatory markers. Eur Heart J. 2006;27(10):1174–1181.
21. Nagaya N, Uematsu M, Satoh T, et al. Serum uric acid levels correlate with the severity and the mortality of primary pulmonary hypertension.
Am J Respir Crit Care Med. 1999;160(2):487–492.
22. Bartziokas K, Papaioannou AI, Loukides S, et al. Serum uric acid as a predictor of mortality and future exacerbations of COPD. Eur Respir J. 2014;43(1):43–53.
23. Ergun R, Ergan B. Does serum uric acid levels predict in-hospital mortality in severe COPD exacerbations? Eur Respir J. 2015;46 (Suppl 59):PA395.
24. MIMIC Code Repository [homepage on the Internet]. Cambridge: Laboratory for Computational Physiology, Massachusetts Institute of Technology; 2018 [updated March 15, 2018]. Available from: http:// github.com/MIT-LCP/mimic-code. Accessed April 10, 2018.
Therapeutics and Clinical Risk Management downloaded from https://www.dovepress.com/ by 118.70.13.36 on 27-Aug-2020
Dovepress
Chen et al
Supplementary materials
6XUYLYRU
1XPEHURIYDOXHV
1RQVXUYLYRU
Figure S1 Distribution of propensity scores.
6XUYLYDOSUREDELOLW\
6XUYLYDOSUREDELOLW\
'D\VDIWHU,&8DGPLVVLRQG
'D\VDIWHU,&8DGPLVVLRQG
1XPEHUDWULVN
1XPEHUDWULVN
'D\VDIWHU,&8DGPLVVLRQG
'D\VDIWHU,&8DGPLVVLRQG
S S
$OOSDWLHQWV
8ULFDFLG7HUWLOH±PJG/ 8ULFDFLG7HUWLOH±PJG/ 8ULFDFLG7HUWLOH±PJG/
360FRKRUW
8ULFDFLG7HUWLOH±PJG/ 8ULFDFLG7HUWLOH±PJG/ 8ULFDFLG7HUWLOH±PJG/
Figure S2 Kaplan–Meier survival curve of 28-day mortality.
Abbreviations: iCU, intensive care unit; PsM, propensity score matching.
Therapeutics and Clinical Risk Management downloaded from https://www.dovepress.com/ by 118.70.13.36 on 27-Aug-2020
Dovepress serum uric acid cannot predict long-term outcome of critically ill patients
Table S1 Univariate Cox regression analysis of all patients on 90-day mortality
Variables HR 95% CI p-value
age (years) 1.02 1.02–1.03 0.0001
gender
Male 1.0
Female 1.07 0.91–1.26 0.4272
saPs ii 1.04 1.03–1.04 0.0001
sepsis (based on iCD-9 codes)
no 1.0
Yes 2.02 1.63–2.49 0.0001
Mechanical ventilation on first day
no 1.0
Yes 0.99 0.84–1.16 0.8727
Renal replacement therapy on first day
no 1.0
Yes 1.22 0.89–1.67 0.2207
Uric acid (mg/dl) 1.02 1.00–1.05 0.0552
elixhauser Comorbidity index (siD30) 1.04 1.03–1.04 0.0001
Comorbidities
Congestive heart failure
no 1.0
Yes 1.67 1.40–2.01 0.0001
Cardiac arrhythmias
no 1.0
Yes 1.60 1.33–1.92 0.0001
Valvular disease
no 1.0
Yes 1.53 1.12–2.10 0.0078
Pulmonary circulation disorder
no 1.0
Yes 1.41 1.02–1.95 0.0357
Peripheral vascular disorder
no 1.0
Yes 1.10 0.83–1.45 0.5042
hypertension
no 1.0
Yes 1.08 0.84–1.38 0.5602
Paralysis
no 1.0
Yes 1.08 0.65–1.81 0.7581
Other neurological disease
no 1.0
Yes 1.12 0.85–1.48 0.4238
Chronic pulmonary disease
no 1.0
Yes 1.01 0.81–1.27 0.9319
Uncomplicated diabetes
no 1.0
Yes 0.97 0.78–1.20 0.7806
Complicated diabetes
no 1.0
Yes 1.01 0.73–1.41 0.9442
hypothyroidism
no 1.0
Yes 0.93 0.68–1.27 0.6455
Renal failure
no 1.0
Yes 1.11 0.89–1.39 0.3518
(Continued)
Table S1 (Continued)
Variables HR 95% CI p-value
liver disease
no 1.0
Yes 1.38 1.04–1.82 0.0246
Peptic ulcer
no 1.0
Yes 0.00 0.00–inf 0.9866
aiDs
no 1.0
Yes 1.19 0.49–2.88 0.6938
lymphoma
no 1.0
Yes 1.47 1.04–2.08 0.0294
Metastatic cancer
no 1.0
Yes 2.63 2.04–3.39 0.0001
solid tumor
no 1.0
Yes 0.99 0.61–1.64 0.9836
Rheumatoid arthritis
no 1.0
Yes 1.44 0.90–2.30 0.1302
Coagulopathy
no 1.0
Yes 1.71 1.43–2.06 0.0001
Obesity
no 1.0
Yes 1.04 0.68–1.57 0.8648
Weight loss
no 1.0
Yes 1.42 1.06–1.92 0.0205
Fluid and electrolyte disorders
no 1.0
Yes 1.47 1.25–1.73 0.0001
Blood loss anemia
no 1.0
Yes 0.31 0.15–0.65 0.0021
Deficiency anemia
no 1.0
Yes 0.87 0.70–1.07 0.1879
alcohol abuse
no 1.0
Yes 0.76 0.51–1.13 0.1709
Drug abuse
no 1.0
Yes 0.41 0.20–0.87 0.0198
Psychoses
no 1.0
Yes 0.45 0.24–0.88 0.0188
Depression
no 1.0
Yes 0.81 0.55–1.20 0.2953
Note: Statistical significance (p0.05) is shown in bold.
Abbreviations: HR, hazard ratio; CI, confidence interval; SAPS II, Simplified Acute Physiology Score II; ICD-9, International Classification of Diseases-Ninth Revision; AIDS, acquired immune deficiency syndrome; SID, State Inpatient Database.
Therapeutics and Clinical Risk Management downloaded from https://www.dovepress.com/ by 118.70.13.36 on 27-Aug-2020
Dovepress
Chen et al
Table S2 Univariate Cox regression analysis of PsM cohort on 90-day mortality
HR 95% CI p-value
age (years) 1.00 0.99–1.00 0.5566
gender
Male 1.0
Female 0.95 0.80–1.13 0.5646
saPs ii 1.01 1.00–1.01 0.0606
sepsis (based on iCD-9 codes)
no 1.0
Yes 1.16 0.93–1.43 0.1866
Mechanical ventilation on first day
no 1.0
Yes 1.04 0.88–1.23 0.6044
Renal replacement therapy on first day
no 1.0
Yes 0.98 0.71–1.34 0.8889
Uric acid (mg/dl) 1.01 0.98–1.03 0.6160
elixhauser Comorbidity index (siD30) 1.00 0.99–1.00 0.3701 Comorbidities
Congestive heart failure
no 1.0
Yes 0.91 0.76–1.10 0.3262
Cardiac arrhythmias
no 1.0
Yes 0.99 0.82–1.19 0.9074
Valvular disease
no 1.0
Yes 1.05 0.77–1.44 0.7671
Pulmonary circulation disorder
no 1.0
Yes 0.94 0.68–1.30 0.7088
Peripheral vascular disorder
no 1.0
Yes 0.97 0.73–1.29 0.8432
hypertension
no 1.0
Yes 0.93 0.72–1.19 0.5546
Paralysis
no 1.0
Yes 0.88 0.52–1.50 0.6503
Other neurological disease
no 1.0
Yes 0.96 0.72–1.27 0.7778
Chronic pulmonary disease
no 1.0
Yes 0.97 0.77–1.21 0.7744
Uncomplicated diabetes
no 1.0
Yes 0.98 0.79–1.22 0.8543
Complicated diabetes
no 1.0
Yes 0.85 0.60–1.21 0.3748
hypothyroidism
no 1.0
Yes 0.83 0.60–1.13 0.2361
Renal failure
no 1.0
Yes 0.90 0.71–1.13 0.3562
(Continued)
Table S2 (Continued)
HR 95% CI p-value
liver disease
no 1.0
Yes 0.98 0.73–1.32 0.9022
aiDs
no 1.0
Yes 0.72 0.30–1.73 0.4603
lymphoma
no 1.0
Yes 0.94 0.67–1.33 0.7409
Metastatic cancer
no 1.0
Yes 1.14 0.86–1.50 0.3634
solid tumor
no 1.0
Yes 0.89 0.54–1.46 0.6411
Rheumatoid arthritis
no 1.0
Yes 0.94 0.58–1.53 0.8061
Coagulopathy
no 1.0
Yes 0.99 0.82–1.20 0.9481
Obesity
no 1.0
Yes 1.17 0.76–1.79 0.4717
Weight loss
no 1.0
Yes 0.93 0.69–1.26 0.6577
Fluid and electrolyte disorders
no 1.0
Yes 0.96 0.81–1.13 0.6048
Blood loss anemia
no 1.0
Yes 1.27 0.60–2.67 0.5344
Deficiency anemia
no 1.0
Yes 0.92 0.74–1.14 0.4309
alcohol abuse
no 1.0
Yes 0.94 0.62–1.43 0.7775
Drug abuse
no 1.0
Yes 1.21 0.57–2.55 0.6186
Psychoses
no 1.0
Yes 0.93 0.48–1.79 0.8215
Depression
no 1.0
Yes 0.94 0.63–1.41 0.7814
Abbreviations: PSM, propensity score matching; HR, hazard ratio; CI, confidence interval; SAPS II, Simplified Acute Physiology Score II; ICD-9, International Classification of Diseases-Ninth Revision; AIDS, acquired immune deficiency syndrome; siD, state inpatient Database.
Therapeutics and Clinical Risk Management downloaded from https://www.dovepress.com/ by 118.70.13.36 on 27-Aug-2020
Therapeutics and Clinical Risk Management
Publish your work in this journal
Submit your manuscript here: http://www.dovepress.com/therapeutics-and-clinical-risk-management-journal
Therapeutics and Clinical Risk Management is an international, peer-reviewed journal of clinical therapeutics and risk management, focusing on concise rapid reporting of clinical studies in all therapeutic areas, outcomes, safety, and programs for the effective, safe, and sustained use of medicines. This journal is indexed on PubMed Central, CAS,
EMBase, Scopus and the Elsevier Bibliographic databases. The manuscript management system is completely online and includes a very quick and fair peer-review system, which is all easy to use. Visit http://www.dovepress.com/testimonials.php to read real quotes from published authors.
Dovepress
Dove
press
serum uric acid cannot predict long-term outcome of critically ill patients
Therapeutics and Clinical Risk Management downloaded from https://www.dovepress.com/ by 118.70.13.36 on 27-Aug-2020