MATHEMATICAL MODELING OF MAIN POTENTIAL GENERATING IONS LOCALIZATION IN LIVING CELLS
Zoryana Ivanytska *, Edward Lychkovscyj *, Dmytro Sanagurskyj**
* Department of Biophysics, Pharmaceutical faculty, Danylo Halytsky Lviv National Medical University,
Pekarska St., 69, Lviv 79010, Ukraine E-mail: [email protected]
**Department of Biophysics and Bioinformatics, Biological faculty, Ivan Franko Lviv National University,
Hrushevskogo St., 4, Lviv, 79005, Ukraine
Summary
The diagram of ions movement through the cell’s membrane was offered and the mathematical model, which contains quantitative and qualitative dependences for the proper concentrations of the main electrogene ions and ions transport rate constants by the ion transport system, was built. The model has the ability to suggest changes of the kinetic parameters values of the ion transport systems (under action of metabolic factor, pharmacological, physical or chemical influences) be able essentially affect on homeostasis of the main potential generating ions.
KEYWORDS: Ions, Mathematical modeling, Transmembrane potential, Membrane associated processes
Introduction
The information exchanges between cells and environment is possible to add to the processes relate to the ions transition across the plasma membrane.
The dynamics of homeostasis of the potential generating ions is noted their complexity that based on great value of factors that act on ions localization inner and outer the cell. These factors are Na+,K+-АТPase, Са2+-АТPase, Na+/Са2+ exchanger, К+, Na+, Ca2+ and Cl- channels, Na+,2Cl-,K+ cotransporter (NKCС) which are so powerful that result on the irregularity of the ion distributions on both side of the membrane [1-6]. Because of the ions “behavior” is insufficiently studied, the one of possible pathway is analyse of the model.
Materials and methods
Mathematical model of localization of К+, Na+, Cl-, and Са2+
ions is based on:
1) Assume existence of the independence flows of Na+, К+, Са2+ and Cl- ions on the base of the flow independence principle (few flows are independent if no one of theirs stoichiometric equations are not linear combinations of others) [7]. The diagram described direction of ions transfer is represented on Figure 1.
2) The kinetic model of ions concentration changes inner and outer the cell is proposed for theoretical investigation the ions “behavior”.
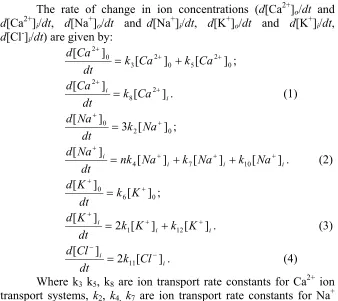
Figure 1. Diagram of ions transfer through the cellular membrane. The mechanism of ions transition through the cellular membrane includes 8 types of transport systems as Na+,K+-АТPase, Са2+
The rate of change in ion concentrations (d[Ca2+]o/dt and
d[Ca2+]i/dt, d[Na+]o/dt and d[Na+]i/dt, d[K+]o/dt and d[K+]i/dt,
d[Cl-]i/dt) are given by:
0 2 5 0 2 3 0 2 ] [ ] [ ]
[ + =k Ca + +k Ca +
dt Ca d
;
i
i k Ca
dt Ca d ] [ ] [ 2 8 2 + +
= . (1)
0 2
0 3 [ ]
]
[ + = k Na+
dt Na d ; i i i
i nk Na k Na k Na
dt Na d ] [ ] [ ] [ ] [ 10 7 4 + + + + + +
= . (2)
0 6
0 [ ]
]
[ + =k K+
dt K d ; i i
i k K k K
dt K d ] [ ] [ 2 ] [ 12 1 + + + +
= . (3)
i
i k Cl
dt Cl d ] [ 2 ] [ 11 − −
= . (4)
Where k3 k5, k8 are ion transport rate constants for Са2+ ion transport systems, k2, k4, k7 are ion transport rate constants for Na+ ion transport systems, k1, k6, k12 are ion transport rate constants for K+ ion transport systems, k11 is NKCС ion transport rate constant for Cl-, extracellular concentrations of [К+]o, [Na+]o, [Са2+]o, intracellular concentrations of [К+]i, [Na+]i, [Са2+]i, and [Cl-]i.
Table 1. Numerical values of parameters
Parameter Value [Са2+]о, [Ca2+]i 1 mМ, 0,0001mM
[Na+]о, [Na+]i 31 mМ, 2 mM
[К+]о, [К+]i 1 mМ, 7,68 mМ
[Cl-]i 0,5 mМ
n 3,38
Results
except for the determination of [Са2+]о, [Ca2+]i, [Na+]о, [Na+]i, [К+]о,
[К+]i, [Cl-]i. The values chosen for the ion transport rate constants are 1, 0,09 and 0. Such small value physical underscore slow work of the channel systems [6, 8,9].
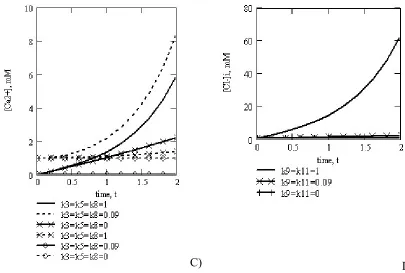
The modeling results were given by family of integral curves, form and position of which t. Result shows exponential increase of ion concentration at k = 0,09 and k = 1 and steady state at k = 0.The modeling results were given by family of integral curves, form and position of which depended on ions transport rate constants of the proper transport systems. This model provide independent “behavior” of ions concentrations in a cell. Figure 2, A, B, C, and D shows dynamics in ion concentration at different values of the ion transport rate constants of t. Result shows exponential increase of ion concentration at k = 0,09 and k =1 and steady state at k = 0.
C) D)
Figure 2. Dynamics of ion concentrations changes.
Discussions
The present study shows that the model based on the principles (see Materials and Methods) can qualitatively described changes in ion location those experimentally observed in a variety of cells. Because ions transitions appear to behave differently in various cell types, it is of interest to try to understand the origin of these features.
Apparently, cases with the ion transport rate constants k = 0,09 and k = 1 characterise cells during division and growth, case with k = 0 characterises cell with low action of transport systems that state shown for unfertilized oocytes [6]. The model has the ability to suggest changes of the kinetic parameters values of the ion transport systems (under action of metabolic factor, pharmacological, physical or chemical influences) be able essentially affect on homeostasis of
The proposed models were compared with experimental data. Calculated values of ion concentrations were in good qualitative agreement with experimental data.
As a result of numeral integration the dynamics of ions accumulation in the cell and external environment gotten. Showed that potential generation concentration grow gradually. Determined that influence of the parameter on the state of system the can be different. The resulted material is illustration of important mechanism for the analysis of ions transition and distribution between the cell and external environment.
References
1. Carafoli E. Intracellular calcium homeostasis. Annu.Rev.Biochem. 1987. 56: 359-433.
2. Diaz ME, Li Y, O’Neill SC, et al. Stability and instability of regulation of intracellular calcium. Exp.Physiol. 2004. 1(90): 3-12.
3. DiРolo R, Beaugé L. Sodium/Calcium Exchanger: Influence of Metabolic Regulation on Ion Carrier Interactions. Physiol. Rev. 2006. 86: 155-203.
4. Eggermont J. Calcium-activated Chloride Channels. (Un)known, (Un)loved?. Proc. Am. Thorac. Soc. 2004. 1: 22-27.
5. Lingrel JB, Kuntzweiler T. Na+,K+-ATPase. Biol.Chem. 1994. 269: 19659-19662.
6. Goyda ЕА. Biophysical aspects of early animal ontogenesis. Naykova dumka, Ukraine.
7. Nicolis G, Prigogine I. Perception of compound. Mir, Russion. 8. Blaustein MP, Hodgkin AL. The effect of cyanide on the efflux
of calcium from squid axons. J.Physiol. 1969. 200: 497–527.