www.nat-hazards-earth-syst-sci.net/14/779/2014/ doi:10.5194/nhess-14-779-2014
© Author(s) 2014. CC Attribution 3.0 License.
Natural Hazards
and Earth System
Sciences
Automatic classification of manual snow profiles by snow structure
F. Techel and C. Pielmeier
WSL Institute for Snow and Avalanche Research SLF, 7260 Davos, Switzerland
Correspondence to: F. Techel ([email protected])
Received: 22 November 2013 – Published in Nat. Hazards Earth Syst. Sci. Discuss.: 12 December 2013 Revised: – Accepted: 25 February 2014 – Published: 10 April 2014
Abstract. Manual snowpack observations are an important
component of avalanche hazard assessment for the Swiss avalanche forecasting service. Approximately 900 snow pro-files are observed each winter, in flat study plots or on rep-resentative slopes. So far, these profiles have been manu-ally classified combining both information on snow stabil-ity (e.g. Rutschblock test) and snowpack structure (e.g. lay-ering, hardness). To separate the classification of snowpack stability and structure, and also to reduce inconsistencies in ratings between forecasters, we developed and tested an au-tomatic approach to classify profiles by snowpack structure during two winters. The automatic classification is based on a calculated index, which consists of three components: prop-erties of (1) the slab (thickness), (2) weakest layer interface and (3) the percentage of the snowpack which is soft, coarse-grained and consists of persistent grain types. The latter two indices are strongly based on criteria described in the thresh-old sum approach. The new snowpack structure index allows a consistent comparison of snowpack structure to detect re-gional patterns, seasonal or inter-annual differences but may also supplement snow-climate classifications.
1 Introduction
Snowpack information is, among other data, one important source for assessing the avalanche danger. Snowpack obser-vations ideally incorporate obserobser-vations on snow stratigra-phy, failure initiation and crack propagation (McCammon and Sharaf, 2005). Characteristics of the snowpack layer-ing are crucial to the failure initiation (strength, e.g. ob-served with the Rutschblock score; Föhn, 1987) and the crack propagation process (toughness, e.g. observed with the Rutschblock release type; Schweizer et al., 2008). Properties
of weak layer or layer interfaces and the slab overlying a weak layer play a role in the fracture process necessary for dry-snow slab avalanches (e.g. van Herwijnen and Jamieson, 2007; Sigrist and Schweizer, 2007).
1.1 Unfavourable snowpack structure
Several studies compared stable and unstable snowpack con-ditions – generally profiles in slopes which were not trig-gered by skiers vs. those which were trigtrig-gered or where signs of instability like whumpfs, shooting cracks and recent avalanching were observed (e.g. Simenhois and Birkeland, 2006; Winkler and Schweizer, 2009). The focus in these studies was generally on snow stability (stability tests). How-ever, snow structure was also investigated. One important re-sult was the threshold sum approach (TSA, e.g. Schweizer and Jamieson, 2007), which describes typical ranges of snowpack parameters associated with snow instability (Ta-ble 1).
Slab properties also play a fundamental role in crack prop-agation leading to avalanche release (van Herwijnen and Jamieson, 2007). The slab is generally defined as the layer which slides in an avalanche or a stability test above a weak layer. Slab properties related to skier-triggering of dry-snow slab avalanches include layering within the slab, grain type, thickness, density and hardness, as well as the differences between slab and weak layer (e.g. Schweizer and Lütschg, 2001; van Herwijnen and Jamieson, 2007; Habermann et al., 2008).
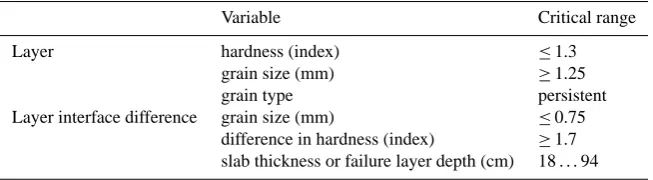
Table 1. Relevant snowpack criteria described in the threshold sum approach – TSA (Schweizer and Jamieson, 2007).
Variable Critical range
Layer hardness (index) ≤1.3
grain size (mm) ≥1.25
grain type persistent
Layer interface difference grain size (mm) ≤0.75 difference in hardness (index) ≥1.7 slab thickness or failure layer depth (cm) 18. . .94
– grain type – persistent grain types are those
consid-ered following temperature-gradient metamorphism as facets and depth hoar (Jamieson and Johnston, 1998) and also surface hoar,
– a combination of snowpack and avalanche
observa-tions, where a persistent weakness is one which was still active 10 days after its formation (resulting in avalanche activity on this layer) (Haegeli and Mc-Clung, 2007)
1.2 Snowpack observations and classification scheme currently used in Switzerland
In Switzerland, snowpack structure and stability is regularly investigated in the extensive observation programme of the Swiss avalanche warning centre in all regions in the Swiss Alps. Manual snow profiles are observed by SLF (WSL Insti-tute for Snow and Avalanche Research SLF) observers twice a month on level study plots (mostly below tree line) and on representative slopes (mostly above tree line). This informa-tion provides an invaluable source for the avalanche forecast-ers to assess snowpack structure (e.g. presence and regional distribution of weak layers) and snow stability (slope profiles only).
These profiles are manually classified according to the stability classification scheme introduced by Schweizer and Wiesinger (2001), called hereafter stab01. The stab01 -classification approach combines information on snow sta-bility (e.g. Rutschblock score) and snowpack structure. Some of the key parameters defining the stability class assigned to a profile are the Rutschblock score and release type (e.g. Föhn, 1987; Schweizer, 2002), presence of weak layers and layer interfaces, presence and hardness of slab or weak layers and the profile type. Profiles are classified from 1 (very poor) to 5 (very good). A more detailed overview is given in Schweizer and Wiesinger (2001). The stab01-classification scheme is primarily a stability classification: Rutschblock information generally has a higher weight and overrules profile type or weak layer information (Schweizer and Wiesinger, 2001).
Profiles not containing a stability test, as those in flat study plots, are therefore not classified. The classification scheme allows considerable room for a subjective interpretation of snow stability.
From the warning service perspective, it was felt necessary
– to differentiate between snowpack structure and snow
stability information:
– snow stability is relevant in the short term and is
described twice daily in the avalanche bulletin; snowpack weaknesses may be found within the new snow or storm snow as well as in persistent weak layers deep in the snowpack.
– snowpack structure is of interest particularly in
the long term (base for new snow, structure be-fore wetting); here the focus is on persistent weaknesses.
– to have a systematic, consistent and objective index of
snowpack structure relevant to avalanche forecasting facilitating the spatial and temporal analysis of snow-pack observations and reducing discrepancies between different forecasters’ subjective snow profile rating.
– to increase the number of profiles available for analysis
by including profiles without stability information
– to reduce the workload necessary for manual
classifi-cation of snow profiles.
In this paper we describe a method to automatically classify snowpack structure for manual snow profiles based on slab and weak layer properties.
2 Data and methods
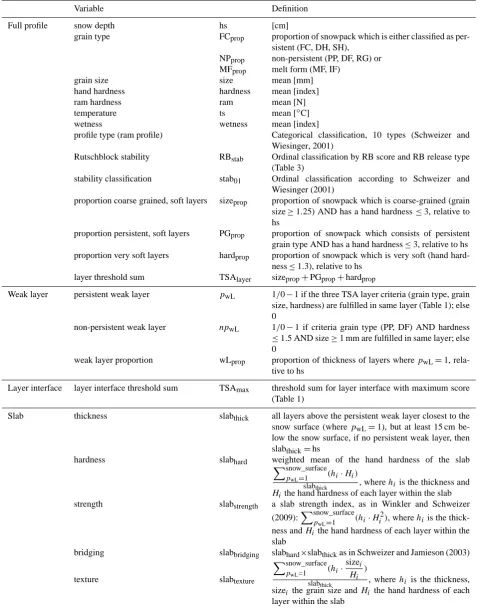
Table 2. Selection of some of the most important, investigated snowpack parameters.
Variable Definition
Full profile snow depth hs [cm]
grain type FCprop proportion of snowpack which is either classified as per-sistent (FC, DH, SH),
NPprop non-persistent (PP, DF, RG) or MFprop melt form (MF, IF)
grain size size mean [mm]
hand hardness hardness mean [index]
ram hardness ram mean [N]
temperature ts mean [◦C]
wetness wetness mean [index]
profile type (ram profile) Categorical classification, 10 types (Schweizer and Wiesinger, 2001)
Rutschblock stability RBstab Ordinal classification by RB score and RB release type (Table 3)
stability classification stab01 Ordinal classification according to Schweizer and Wiesinger (2001)
proportion coarse grained, soft layers sizeprop proportion of snowpack which is coarse-grained (grain size≥1.25) AND has a hand hardness≤3, relative to hs
proportion persistent, soft layers PGprop proportion of snowpack which consists of persistent grain type AND has a hand hardness≤3, relative to hs proportion very soft layers hardprop proportion of snowpack which is very soft (hand
hard-ness≤1.3), relative to hs layer threshold sum TSAlayer sizeprop+PGprop+hardprop
Weak layer persistent weak layer pwL 1/0−1 if the three TSA layer criteria (grain type, grain size, hardness) are fulfilled in same layer (Table 1); else 0
non-persistent weak layer npwL 1/0−1 if criteria grain type (PP, DF) AND hardness
≤1.5 AND size≥1 mm are fulfilled in same layer; else 0
weak layer proportion wLprop proportion of thickness of layers wherepwL=1, rela-tive to hs
Layer interface layer interface threshold sum TSAmax threshold sum for layer interface with maximum score (Table 1)
Slab thickness slabthick all layers above the persistent weak layer closest to the snow surface (wherepwL=1), but at least 15 cm be-low the snow surface, if no persistent weak layer, then slabthick=hs
hardness slabhard weighted mean of the hand hardness of the slab Xsnow_surface
pwL=1 (hi
·Hi)
slabthick , wherehiis the thickness and
Hi the hand hardness of each layer within the slab strength slabstrength a slab strength index, as in Winkler and Schweizer
(2009):Xsnow_surface pwL=1 (hi
·Hi2), wherehi is the thick-ness andHi the hand hardness of each layer within the slab
bridging slabbridging slabhard×slabthickas in Schweizer and Jamieson (2003)
texture slabtexture
Xsnow_surface pwL=1 (hi
·sizei
Hi
)
slabthick , where hi is the thickness,
Table 3. Classification of profile stability based on the Rutschblock (RB) test result in five classes (RBstab) based on RB score (score 1–7) and RB release type. The classification is based on the stabil-ity classification scheme by Schweizer and Wiesinger (2001)). RB release type: wBl – whole block, pBr – partial break, Edg – edge only.
RBstab Score, release type
1 RB1 all RB2 wBl
2 RB2 pBr OR Edg RB3 wBl
3 RB3 pBr OR Edg RB4 all RB5 wBl 4 RB5 pBr OR Edg RB6 wBl
5 RB6 pBr OR Edg RB7
test (Föhn, 1987), complements the snow profile observa-tions (50 % of profiles). Layer-specific snow density is hardly measured.
To develop an objective classification of snow structure, we randomly selected 258 profiles from the SLF snow-profile database (snow-profiles with poor recording quality were rejected) and asked 9 experienced (current and previous) SLF avalanche forecasters to rate the snowpack structure based solely on layering information by excluding information on location and snow stability and removing any additional text information describing snow and avalanche conditions. Snowpack structure was classified from 1 (unfavourable) to 5 (favourable). Each profile was assessed by at least two and up to four forecasters. For further analysis, we used the mean snowpack structure rating for each profile (hereafter called SNPKmanual).
Snowpack parameters related to unstable snow conditions and dry-snow slab avalanche release were calculated from the layering information (Table 2). Calculated parameters in-cluded simple means or sums over the full profile, but of particular interest were properties providing weak layer and slab information. A slab layer is defined as a layer of bonded snow above a weak layer. Current snow profile observation procedures do not distinguish between very soft layers (hand hardness index 1) of bonded snow and very soft layers of co-hesionless snow (hand hardness 1). As the SNPKmanual was based on layering information only – no stability test iden-tified the slab and the relevant weak layer – the slab was defined as all layers above the persistent weak layer clos-est to the surface but with a minimum depth of 15 cm. A value of 15 cm was chosen as a minimum threshold for a relevant slab depth and corresponds closely to the TSA ap-proach (Table 1). Grain shape was classified as persistent and non-persistent (Jamieson and Johnston, 1998) or melt form.
In a first step, we compared the existing classifica-tion (stab01) with the manually classified snow structure (SNPKmanual) and stability information (Rutschblock test). For the latter, the Rutschblock result was classified in five classes by Rutschblock score and release type (RBstab, Ta-ble 3).
To investigate the relevance of the snowpack parameters for the manual snow structure assessment, we used the non-parametric Spearman rank order correlation testing for a monotonic relationship (Crawley, 2007) and conditional in-ference trees (ctree, R package party; Hothorn et al., 2006) to investigate which properties are most relevant for snowpack structure classification. Results were considered significant if the level of significanceα≤0.05.
Based on the outcome of the uni-variate and multi-variate analysis, we developed a snow structure index incorporating some of the most relevant variables describing slab, weak layer and layer interfaces.
3 Results and discussion
As both the Rutschblock test and snowpack criteria are im-portant components of the existing stab01classification, it is not surprising that they are both correlated to stab01(RBst ab:
ρ=0.65, SNPKmanual: ρ=0.50). The correlation between stability information (RBstab) and manual snow structure classification (SNPKmanual), however, is significant but much weaker (ρ=0.33). This highlights that snowpack structure and snowpack stability do not necessarily develop in the same direction. For instance, a prolonged cold dry period might lead to an increase in snow stability, while at the same time temperature-gradient metamorphism results in a more unfavourable snowpack structure for future snowfall or snow loading by wind events.
The profile type classification (based on the ram hard-ness profile; Schweizer and Wiesinger, 2001) showed few associations to SNPKmanual. The two exceptions were a pro-file which was very soft throughout was rated mostly as unfavourable, and a profile which was very hard through-out was rated mostly favourable. While the ram hardness method is a more objective measurement technique than the hand hardness method, small thin layers and differences in soft layers are not detected using this method. Also, the ram probe is used for hardness measurements almost exclusively in Switzerland. Therefore this approach was not further in-vestigated.
3.1 Snowpack variables related to manual snowpack structure classification
3.1.1 Univariate analysis
The calculated snowpack parameters were tested for their rel-evance to SNPKmanual(Table 4).
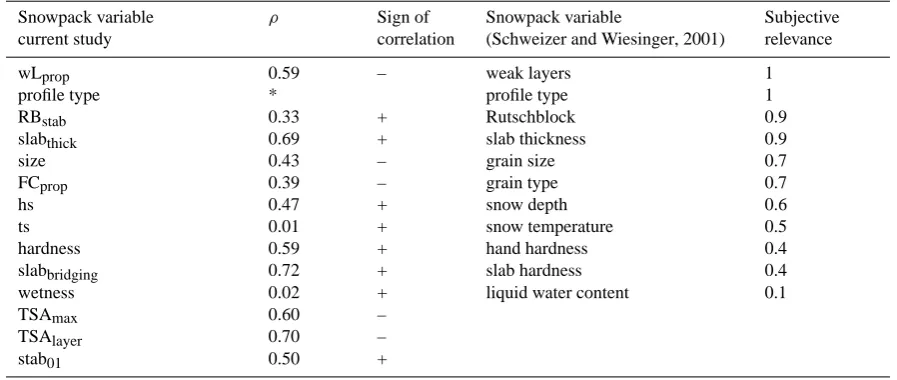
Table 4. Relevance/contribution of snow stability and snowpack structure observations for stability assessment according to Schweizer and Wiesinger (2001, stab01, right part of table). Parameters were subjectively ranked by nine experienced forecasters (score between 0 – not important and 1 – very important). The left part of the table shows the approximately corresponding parameters for the presented study. For these variables, the Spearman correlationρto the manually classified snowpack structure (SNPKmanual) is given. The correlation is not for all investigated parameters shown. * Profile type (nominal variable) – no correlation calculated.
Snowpack variable ρ Sign of Snowpack variable Subjective
current study correlation (Schweizer and Wiesinger, 2001) relevance
wLprop 0.59 – weak layers 1
profile type * profile type 1
RBstab 0.33 + Rutschblock 0.9
slabthick 0.69 + slab thickness 0.9
size 0.43 – grain size 0.7
FCprop 0.39 – grain type 0.7
hs 0.47 + snow depth 0.6
ts 0.01 + snow temperature 0.5
hardness 0.59 + hand hardness 0.4
slabbridging 0.72 + slab hardness 0.4
wetness 0.02 + liquid water content 0.1
TSAmax 0.60 –
TSAlayer 0.70 –
stab01 0.50 +
Many of the snowpack variables describing slab proper-ties, weak layers or weak layer interfaces are moderately or strongly correlated to SNPKmanual. However, they all have some shortcomings: for instance, slab properties are particu-larly suitable for discrimination of intermediate to favourable snowpack structure, while parameters related to weak lay-ers and weak layer interfaces are most useful to distinguish between intermediate and unfavourable snowpack classes. Therefore, a combination of different parameters seems most plausible and is also consistent with previous research.
3.1.2 Classification tree approach
Additionally to the correlation analysis, we used classifica-tion tree analysis to investigate which properties are most rel-evant to classify snowpack structure. A combination of slab properties (slabstrength, slabbridging, slabthick) and weak layer criteria (TSAlayer, pwL), as well as the overall mean grain size, was most suitable for the classification of the snow-pack structure. The classification accuracy of this classifica-tion tree was 64 % of profiles classified correctly, 31 %±1 class and 4 %±2 classes.
3.1.3 Snowpack structure index
Further, we developed a continuous index variable for snow-pack structure.
One of the requirements for this index was that it incorpo-rates information relevant to dry-snow slab avalanche initia-tion and propagainitia-tion. Thus, we forced the index to contain at least one parameter describing the slab, weak layer interfaces
and layer properties. Selection criteria to obtain the most suit-able three parameters were
1. preferably a strong correlation to the manual snowpack structure classification and
2. preferably no correlation between the selected vari-ables.
As all variables contributing to snowpack structure were sig-nificantly correlated to each other, we selected those with the lowest correlation between each other. For instance, the slab variables slabstrengthand slabbridgingshowed a marginally bet-ter correlation to SNPKmanualthan slabthickand were also se-lected by the classification tree analysis, but they showed a much stronger correlation to weak layer interfaces (TSAmax) and layer properties (TSAlayer) than slabthick.
Fig. 1. Box plots showing variables selected for the snowpack index (SNPKindex) and their distribution relative to the manually classified snowpack structure (SNPKmanual): threshold sum approach for layers (left) and layer interfaces (centre) and depth of persistent weak layer (right). All three variables are strongly correlated to SNPKmanualand moderately correlated to each other.
●
●
● ●
● ●
●
●
SNPK.manual
SNPK.inde
x
1−2 2−3 3−4 4−5
1 2 3 4 5
0 0.5 1 1.5 2 2.5 3
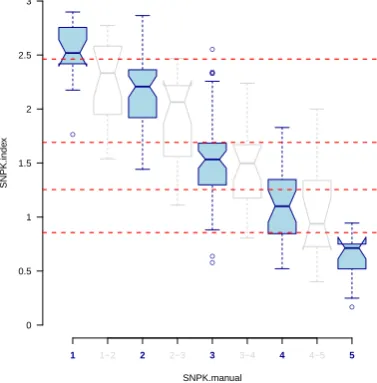
Fig. 2. Box plots showing the SNPKindex and the manually clas-sified snowpack structure (SNPKmanual, 1 – unfavourable to 5 – favourable). The red lines represent the SNPKindexsplitting thresh-olds between full SNPKmanual classes (light-blue boxes), as ob-tained with the classification tree analysis (Table 5). The correla-tion between the index and the manual classificacorrela-tion (including pro-files which were classified with half classes, light boxes) is strong (ρ=0.79,p <10−16).
The calculation of the SNPKindex consists of three sepa-rate calculations, each standardizing one parameter to values between 0 (favourable) and 1 (unfavourable):
1. The first part of the index describes the proportion of the snowpack which is very soft hardpropand the pro-portion which is coarse-grained sizeprop and the pro-portion which consists of persistent grain type PGprop (see Tables 1 and 2), standardized by the number of the
three components. TSAlayerindex=
TSAlayer
3 =
hardprop+sizeprop+PGprop
3 .
(1)
2. The second part of the index uses the maximum score of the threshold sum approach for layer interfaces, standardized by the maximum possible score.
TSAmaxindex=
TSAmax
6 (2)
3. The third part of the index incorporates a slab parame-ter, the standardized slab thickness.
slabdepthindex=
slabthick−30
170 −1
. (3)
The slab thickness is standardized to values between 1 (thickness 30 cm, which corresponds roughly to the median of slab thickness (32.5 cm) for SNPKmanual class 1 and is similar to slab thickness values de-scribed in van Herwijnen and Jamieson (2007)) and 0 (thickness 200 cm which corresponds to median of slab thickness for SNPKmanualclass 5, see also Fig. 2, right). Values of depthslab, which is less than 30 cm (or greater than 200 cm), are accordingly assigned a slabdepthindexof 1 (or 0).
The SNPKindexis then calculated as
SNPKindex=TSAlayerindex+TSAmaxindex+slabdepthindex. (4)
The continuous SNPKindex has a range from 0 (very favourable) to 3 (very unfavourable).
Fig. 3. Simplified snow profiles. The hand hardness profile is shown with the main grain type (colour) indicated. Layer properties (text) are given for each layer in the following order: grain type, grain size (mm), and hand hardness. Abbreviations are according to Fierz et al. (2009).
Applying the classification tree method to the SNPKindex results in significant splitting thresholds for all five SNPKmanualclasses (Table 5). Using these thresholds to clas-sify the 258 profiles results in 64 % of profiles being classi-fied correctly, 32 %±1 class and 4 %±2 classes.
3.2 Examples
The application of the SNPKindex to a typical selection of (simplified) profiles (Fig. 3) is shown in Table 6.
The simplified profiles show the following:
– Profile A1 has no persistent weaknesses, while profiles
A2 to A4 have similar slab layering but with a persis-tent weak layer and slab combination.
– Profiles B1 and B2 are two rather soft profiles, both
with a melt–freeze crust in the middle of the profile. While B1 has a faceted base (DH), the base of B2 is composed of small round grains.
– C1 and C2 contain a prominent persistent weakness
below a slab of varying thickness.
– Profiles D1 (dry) to D2 and D3 (wet) are examples of
typical spring snowpack-type evolution.
The SNPKindexwas calculated with a snow depth of 2 m for profiles A4 and C2, otherwise with 1 m. To compare the in-dex (Table 6, row 1) and the automatically calculated classes from the index (row 2) with the manual classification, four forecasters classified these simplified profiles as before (Ta-ble 6, row 3). Again, the classification accuracy was similar to before: 64 % of profiles being classified correctly or within ±1
2class, 27 %±1 class and 9 %±2 classes. 4 Conclusions
We have developed an automatic snowpack classification al-gorithm, which considers slab, weak layer and weak layer interface properties as observed in manual snow profiles.
Table 5. Best-splitting SNPKindexthresholds to classify profiles in five classes.
Threshold between classes SNPKindexthreshold
1 and 2 2.462
2 and 3 1.687
3 and 4 1.254
4 and 5 0.788
The index has a focus on persistent weak layers, which are frequently the failure layer associated with snow instability (Schweizer and Jamieson, 2007). Due to the lack of informa-tion on the bonding of very soft surface layers, the minimal potential slab depth was defined solely by the depth of the uppermost persistent weak layer.
The main advantage of the index is the automatic, objec-tive classification of snowpack structure in regard to dry-snow slab avalanche release. Like any statistical approach, the index has its limitations: about two thirds of the profiles were classified in the same class as the manual snowpack structure assessment. However, only very few profiles were misclassified by two classes. Also, the index has no bias to-wards a better or worse classification. While the index is an objective approach to classify snowpack structure, it must be kept in mind that it relies on highly standardized but subjec-tive observations (particularly hand hardness, grain type and size are to some extent observer dependent).
Currently, the classification is used operationally by the Swiss avalanche forecasting centre in the following way:
– class thresholds are used for colour coding and
inter-pretation of the index (Fig. 4);
– index values are used for inter-annual comparison
(Fig. 4, inset upper right corner).
Table 6. Comparison of 11 simplified, typical profile types by manual snowpack structure classification SNPKmanual, the calculated SNPKindexand the classes derived from SNPKindexfor profiles shown in Fig. 3.
Snow structure A1 A2 A3 A4 B1 B2 C1 C2 D1 D2 D3
SNPKmanual 5 4 2 5 2 3 1–2 3–4 2 3 5
SNPKindex 1.15 1.65 2.12 0.99 2.18 1.58 2.16 1.34 2.09 1.59 1.45
SNPKindex→classes 4 3 2 4 2 3 2 3 2 3 3
Snowpack structure 2013−03−20 [10 days]
●
●
●
●
●
●
●
●
●
●
●
●
●
●
●
●
●
●
●
●
●
●
●
●
●
●
●
●
●
●
●
●
●
●
●
●
●
●
●
●
●
●
●
●
●
●
●
●
●
●
●
●
●
●
●
●
●
●
●
●
●
●
●
●
●
●
●
●
●
●
●
●
●
●
SW 25 N 21N 25E 27 N 21 NE 25 FLACH 25 NW 21 FLACH 26 FLACH 14 E 16 E 18 SE 25 FLACH 18 NE 25 N 20 FLACH 19 NW 23 FLACH 14 N 18 SE 17 N 30 FLACH 17 N 22 FLACH 14 N 20 FLACH 19 E 18 FLACH 17 FLACH 17 FLACH 18 E 20 FLACH 18 N 15 S 14 S 16 S 14 N 28 NE 20 FLACH 16 E 29 N 20 FLACH 17 FLACH 15 FLACH 13 NW 26
FLACH 25SE 22
FLACH 16
FLACH 14 N 12
S 21 NW 24 N 25 NW 26 FLACH 13 FLACH 13 S 16 FLACH 13 N 23 SE 13
N 25 FLACH 17
FLACH 22
NE 27E 27
N 27 FLACH 14 N 14 N 15 NW 23 N 28 NW 21 NE 21 2013−12−01 14:26:12 [Source: manual snow profiles 10 days]
● ● ● ● ● ● ● ● ● ● ●●● ●● ● ● ● ● ● ● ●● ● ● ● Flat study plot
R$snpk_index R$ele v ation ++ −− 1500 2000 2500 3000 ● ● ● ● ● ● ● ● ● ● ● ● ● ● ● ● ● ● ● ● ● ● ● ● ● ● ● ● ● ● ● North aspect R$snpk_index R$ele v ation ++ −− 1500 2000 2500 3000 ● ● ● ● ● ● ● ● ● ● South aspect R$snpk_index R$ele v ation ++ −− 1500 2000 2500 3000
Comparison 17 years
Dec Jan Feb Mar Apr
−− +/− ++
●
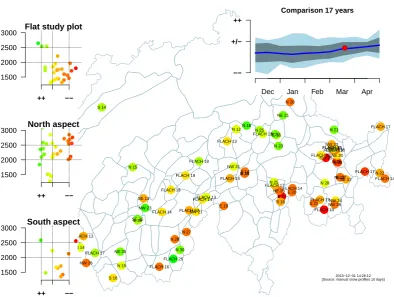
Fig. 4. Map of Switzerland showing the locations where manual profiles were observed (main graph, coloured points). Colour coding corresponds to the five classes calculated from SNPKindex(red: unfavourable (– –); yellow: medium (±); green: favourable (++)). Each point represents one profile with the slope aspect and elevation given (e.g. N 15 is north aspect at 1500 m). In the background the shapes of the 120 forecast regions are shown. The insets on the left side of the plot show the profiles according to aspect and elevation. The inset in top right corner gives a comparison of the actual conditions (red point) with the previous 17 years, where the mean is the blue line; the grey-shaded areas are±1 standard deviations from the mean and the light-blue-shaded area the minima and maxima during this period.
may also be used for historical analysis of avalanche events or for snow-climatological investigations. Using the adjusted threshold sum approach for a simulated snowpack (Monti et al., 2012), it might be possible to apply a similar approach to modelled snow profiles such as the snowpack simula-tion SNOWPACK. This could increase the informasimula-tion den-sity regarding snowpack structure information for avalanche forecasting services.
Acknowledgements. We greatly thank the (current and former) SLF avalanche forecasters Gian Darms, Lukas Dürr, Hans-Jürg Etter, Stephan Harvey, Thomas Stucki, Kurt Winkler, and Benjamin Zweifel. We would also like to take the opportunity to thank the SLF observers who provided us with the invaluable snow profile observations. We thank Kurt Winkler, Alec van Herwijnen, Jürg Schweizer and the two external reviewers Thomas Wiesinger and Fabiano Monti for their valuable comments, which greatly helped to improve the manuscript.
Edited by: R. Lasaponara
References
Crawley, M.: The R book, John Wiley and Sons Ltd., 1st Edn., 2007. Fierz, C., Armstrong, R. L., Durand, Y., Etchevers, P., Greene, E., McClung, D. M., Nishimura, K., Satyawali, P. K., and Sokra-tov, S. A.: The International Classification for Seasonal Snow on the Ground, IHP-VII Technical Documents in Hydrology N◦83, IACS Contribution N◦1, UNESCO-IHP, Paris, 2009.
Föhn, P.: The rutschblock as a practical tool for slope stability eval-uation, IAHS-AISH P., 162, 223–228, 1987.
Habermann, M., Schweizer, J., and Jamieson, B.: Influence of snow-pack layering on human-triggered snow slab avalanche release, Cold Reg. Sci. Technol., 54, 176–182, 2008.
Haegeli, P. and McClung, D.: Expanding the snow climate classifi-cation with avalanche relevant information – initial description of avalanche winter regimes for south-western Canada, J. Glaciol., 53, 166–276, 2007.
Hothorn, T., Hornik, K., and Zeileis, A.: Unbiased recursive parti-tioning: a conditional inference framework, J. Comput. Graph. Stat, 15, 651–674, 2006.
Jamieson, B. and Johnston, C.: Refinements to the stability index for skier-triggered dry-slab avalanches, Ann. Glaciol., 26, 296–302, 1998.
McCammon, I. and Sharaf, D.: Integrating strength, energy and structure into stability decisions: so you dig a pit and then what?, Avalanche Rev., 23, 18–19, 2005.
Monti, F., Cagnati, A., Valt, M., and Schweizer, J.: A new method for visualizing snow stability profiles, Cold Reg. Sci. Technol., 78, 64–72, 2012.
Schweizer, J.: The rutschblock test – procedure and application in Switzerland, Avalanche Rev., 20, 14–15, 2002.
Schweizer, J. and Jamieson, B.: A threshold sum approach to sta-bility evaluation of manual profiles, Cold Reg. Sci. Technol., 47, 50–59, 2007.
Schweizer, J. and Jamieson, J.: Snow cover properties for snow pro-file interpretation, Cold Reg. Sci. Technol., 37, 233–241, 2003. Schweizer, J. and Lütschg, M.: Characteristics of human-triggered
avalanches, Cold Reg. Sci. Technol., 33, 147–162, 2001. Schweizer, J. and Wiesinger, T.: Snow profile interpretation for
sta-bility evaluation, Cold Reg. Sci. Technol., 33, 179–188, 2001. Schweizer, J., McCammon, I., and Jamieson, B.: Snowpack
obser-vations and fracture concepts for skier-triggering of dry-snow slab avalanches, Cold Reg. Sci. Technol., 51, 112–121, 2008. Sigrist, C. and Schweizer, J.: Critical energy release rates of weak
snowpack layers determined in field experiments, Geophys. Res. Lett., 34, L03502, doi:10.1029/2006GL028576, 2007.
Simenhois, R. and Birkeland, K.: The extended column test: a field test for fracture initiation and propagation, in: Proceedings 2006 International Snow Science Workshop, Telluride, Colorado, 79– 85, 2006.
van Herwijnen, A. and Jamieson, B.: Snowpack properties associ-ated with fracture initiation and propagation resulting in skier-triggered dry snow slab avalanches, Cold Reg. Sci. Technol., 50, 13–22, doi:10.1016/j.coldregions.2007.02.004, 2007.