www.nat-hazards-earth-syst-sci.net/14/1905/2014/ doi:10.5194/nhess-14-1905-2014
© Author(s) 2014. CC Attribution 3.0 License.
Numerical modeling and analysis of the effect of complex Greek
topography on tornadogenesis
I. T. Matsangouras1, I. Pytharoulis2, and P. T. Nastos1
1Laboratory of Climatology and Atmospheric Environment, Faculty of Geology and Geoenvironment, University of Athens, Panepistimioupolis, 15784, Athens, Greece
2Department of Meteorology and Climatology, School of Geology, Aristotle University of Thessaloniki, University Campus, 54124, Thessaloniki, Greece
Correspondence to: I. T. Matsangouras ([email protected])
Received: 16 January 2014 – Published in Nat. Hazards Earth Syst. Sci. Discuss.: 11 February 2014 Revised: – – Accepted: 3 June 2014 – Published: 30 July 2014
Abstract. Tornadoes have been reported in Greece over re-cent decades in specific sub-geographical areas and have been associated with strong synoptic forcing. While it has been established that meteorological conditions over Greece are affected at various scales by the significant variability of topography, the Ionian Sea to the west and the Aegean Sea to the east, there is still uncertainty regarding topography’s importance on tornadic generation and development.
The aim of this study is to investigate the role of topog-raphy in significant tornadogenesis events that were trig-gered under strong synoptic scale forcing over Greece. Three tornado events that occurred over the last years in Thebes (Boeotia, 17 November 2007), Vrastema (Chalkidiki, 12 February 2010) and Vlychos (Lefkada, 20 September 2011) were selected for numerical experiments. These events were associated with synoptic scale forcing, while their in-tensities were T4–T5 (on the TORRO scale), causing sig-nificant damage. The simulations were performed using the non-hydrostatic weather research and forecasting model (WRF), initialized by European Centre for Medium-Range Weather Forecasts (ECMWF) gridded analyses, with tele-scoping nested grids that allow for the representation of at-mospheric circulations ranging from the synoptic scale down to the mesoscale. In the experiments, the topography of the inner grid was modified by: (a) 0 % (actual topography) and (b) −100 % (without topography), making an effort to de-termine whether the occurrence of tornadoes – mainly iden-tified by various severe weather instability indices – could be indicated by modifying topography. The principal insta-bility variables employed consisted of the bulk Richardson
number (BRN) shear, the energy helicity index (EHI), the storm-relative environmental helicity (SRH), and the max-imum convective available potential energy (MCAPE, for parcels with maximumθe). Additionally, a model verification
was conducted for every sensitivity experiment accompanied by analysis of the absolute vorticity budget.
Numerical simulations revealed that the complex topogra-phy constituted an important factor during the 17 November 2007 and 12 February 2010 events, based on EHI, SRH, BRN, and MCAPE analyses. Conversely, topography around the 20 September 2011 event was characterized as the least significant factor based on EHI, SRH, BRN, and MCAPE analyses.
1 Introduction
Climatological studies have described the spatiotempo-ral distribution of tornadoes over the Mediterranean Sea throughout recent decades (Dessens, 1984; Dessens and Snow, 1987; Paul, 1999, 2000; Giaiotti et al., 2007; Gayà et al., 2011; Gianfreda et al., 2005). In addition to the cli-matological research, several publications have presented or analyzed case studies of important tornado and waterspout events around Greece, revealing that tornadoes are neither a rare nor unknown phenomenon in Greece (Matsangouras and Nastos, 2010; Matsangouras et al., 2010, 2011b, 2012, 2014; Nastos and Matsangouras, 2010, 2012; Sioutas, 2011).
Tornadogenesis is a major forecast challenge in regions of complex terrain (e.g., Homar et al., 2003). It is no wonder that the complex Greek inland terrain, along with the Ionian Sea to the west and the Aegean Sea to the east, appears to be a vulnerable area for convective weather and tornado oc-currence. Operational and research meteorologists often re-fer to and investigate the presence of diagnostic variable sets that can be used as forecast parameters for severe convective weather. Diagnostic variables have a long history in relation to forecasting severe convective weather (Schaefer, 1986; Johns and Doswell, 1992) as their values represent their ca-pacity to summarize in a single value some kinematic or ther-modynamics characteristics of the severe storm environment. Doswell and Schultz (2006) have discussed clearly these di-agnostic variables and introduced a five scale classification scheme: (1) simple observed variables, (2) simple calculated variables, (3) derivatives or integrals (spatial or temporal) of simple observed or calculated variables, (4) combined vari-ables, and (5) indices. Are these diagnostic variables suffi-cient to forecast tornadogenesis? What other factors make the environment conditions favorable to tornadoes?
In order to answer these questions we need to review the diagnostic variables that have been identified by prior re-search as “ingredients” for tornado occurrence. The concept of ingredients was introduced by Doswell (1987), Doswell et al. (1996), and Groenemeijer et al. (2011), and can be de-fined as an essential, but not sufficient, condition for a phe-nomenon to occur. For example, a storm requires two in-gredients: (1) convective available potential energy (CAPE; Table 1) and (2) lift. By lift, we mean the sufficient initial ver-tical motion that results in convection, and this could be car-ried out either by thermal processes or by a synoptic driven force (fronts) or even by the effect of topography/orography. Miglietta and Regano (2008) confirm the importance of even a relatively shallow orography for the development of con-vective cells, using weather research and forecasting model (WRF) sensitivity experiments over a small area in Apulia (in southern Italy). Regarding CAPE, several researchers have noted that large values of CAPE are not mandatory for tor-nado development (Monteverdi et al., 2003; Hannesen et al., 1998; Groenemeijer and Van Delden, 2007). Besides CAPE, Rasmussen (2003) has shown that the storm relative helicity (SRH) in the lower atmosphere (Table 1) can be used to dis-tinguish non-tornadic from weakly and significantly tornadic
storms. On the other hand, for Craven and Brooks (2002) and Brooks (2009) the strong low level wind shear was iden-tified as a good predictor of tornadoes. Energy helicity index (EHI; Table 1) was evaluated by Rasmussen (2003) on the basis of three classes of proximity soundings, relating con-vective weather and supercell storms with tornadic and non tornadic events. The bulk Richardson number (BRN, Table 1) is used to quantify the relationship between buoyant energy and vertical wind shear (Moncrieff and Green, 1972), tak-ing into account the wind components of the difference be-tween the density-weighted mean winds over the 6000 m and the 500 m a.g.l.As discussed in Droegemeier et al. (1993), the BRN is only a gross estimate of the effects of verti-cal wind shear on convective storms, since it does not mea-sure the turning of the wind profile with height. However, Weisman and Klemp (1984) show, using cloud-scale model simulations, that the BRN can distinguish between supercell and multicell storms, with modeled supercells likely when 10≤BRN≤50 and multicell storms likely when BRN>35. It is important to note that there is no well-defined threshold value for BRN, since there is an overlap in the values used to specify storm type.
A model simulation with spatial resolution that reproduces the weather conditions at storm scale is a powerful tool for understanding the relevant physical processes involved and calculating the above-mentioned diagnostic variables. In our study, three tornado events were simulated using the non-hydrostatic WRF model, in order to determine whether the model is able to indicate the occurrence of tornadic activity by modifying the topography. The selected tornado events have been associated with synoptic scale forcing; their in-tensities were T4–T5 on the TORRO scale (Meaden, 1976) and caused significant damage. The TORRO scale describes peak winds, yet it was designed as a formal extension of the B-scale (Meaden, 1976). T4 and T5 are characterized as significant/strong tornadoes with a wind velocity rang-ing between 51–61 m s−1 (T4) and 61–71 m s−1 (T5). The analyzed tornado events have occurred over recent years in three Greek areas; namely in Thebes (central Greece, Boeo-tia, 17 November 2007), Vrastema (north Greece, Chalkidiki, 12 February 2010) and Vlychos (west Greece, Lefkada, 20 September 2011).
An analysis of severe weather variables was conducted for every simulation. The diagnostic variables comprise the BRN, EHI, SRH, and maximum convective available po-tential energy (MCAPE, for parcels with maximum θe).
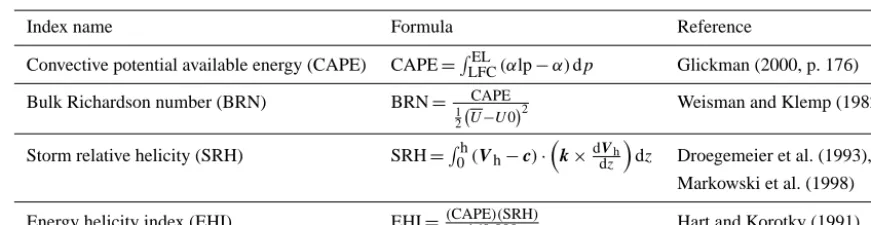
Table 1. A selection of indices commonly used for severe storm forecasting. In the formulae,Tdenotes temperature andDdenotes dew point in◦C, with a subscript indicating at what mandatory pressure level (in hPa) this value is to be taken from;αdenotes the specific volume and lp denotes a value associated with a lifted parcel; LFC stands for a lifted parcel’s level of free convection and EL stands for its equilibrium level. For the Bulk Richardson number,U0denotes the density-weighted speed of the mean vector wind in the layer 0–6 km, andUdenotes
the speed of the mean vector wind in the layer from the surface to 500 m – the quantity is sometimes referred to as the “BRN shear”. For the storm-relative helicity,k×dVh
dz is the horizontal vorticity, and vectorkis the unit vector in the vertical,Vh−cis the storm-relative
environmental wind velocity. The shear vector consists of two components, the speed shearVh(a change in wind speed with height) and the
directional shear or storm motion vector (a change in wind direction with height).
Index name Formula Reference
Convective potential available energy (CAPE) CAPE=REL
LFC(αlp−α)dp Glickman (2000, p. 176)
Bulk Richardson number (BRN) BRN= CAPE
1 2 U−U0
2 Weisman and Klemp (1982)
Storm relative helicity (SRH) SRH=Rh
0(Vh−c)·
k×dVh dz
dz Droegemeier et al. (1993), Markowski et al. (1998) Energy helicity index (EHI) EHI=(CAPE)(SRH)
160.000 Hart and Korotky (1991)
Overall, the goal of this paper is to investigate the im-portance of complex terrain in tornado formation. The data sources and WRF setup are presented in Sect. 2. Section 3 analyzes the selected tornado events and puts forwards a brief weather synoptic analysis. In Sect. 4 we show the model sim-ulation verification. In Sect. 5 we demonstrate our analysis of absolute vorticity budget and in Sect. 6 we examine and discuss the results obtained. Finally, Sect. 7 summarizes our findings and conclusions.
2 Data sources and model setup
Starting in 2007, the Laboratory of Climatology and At-mospheric Environment (LACAE, http://lacae.geol.uoa.gr) at the University of Athens has made a systematic effort to record tornadoes, waterspouts, and funnel clouds over Greece. In 2009, LACAE developed an open-ended, online tornado reporting database web system (http://tornado.geol. uoa.gr), contributing to the compilation of a climatology con-cerning these extreme weather events. A flow chart of the LACAE tornado reporting data stream system, accompanied by a plausibility check process, was presented by Matsan-gouras et al. (2014). The Laboratory of Climatology and At-mospheric Environment is in close collaboration with the European Severe Storm Laboratory (ESSL) and regularly submits reports to the European Severe Weather Database (ESWD).
The three selected tornado cases: (1) Thebes (Boeotia, 17 November 2007), (2) Vrastema (Chalkidiki, 12 February 2010), and (3) Vlychos (Lefkada, 20 September 2011) were reported to LACAE tornado database. The selected events have been associated with synoptic scale forcing (frontal ac-tivity), while their intensities were T4–T5 on the TORRO scale and consequently caused significant damage.
Tornado event simulations were performed using the non-hydrostatic WRF model with the dynamical core of advanced research WRF (ARW). An analysis of BRN, EHI, SRH, and MCAPE (for parcels with maximumθe) severe weather
vari-ables was conducted for every simulation.
Figure 1. The upper image (a) illustrates the actual topography of Greece with the location (black dots) of tornadoes and meteorological
stations (red and blue abbreviations, respectively). The three nested domains used for numerical investigations of tornado events (lower images) are illustrated during (b) 17 November 2007, (c) 12 February 2010 and (d) 20 September 2011. In (b), (c) and (d) images D1 is the outer domain, D3 is the inner domain and D2 is the intermediate domain.
and the three nested domains. In the vertical, 39 sigma lev-els (up to 50 hPa) with increased resolution in the bound-ary layer were utilized by all nests. ERA-Interim reanaly-sis data (Dee et al., 2011) from the European Centre for Medium-Range Weather Forecasts (ECMWF) with a spatial resolution of 0.75◦×0.75◦ were used as initial and lateral boundary conditions for the domain D1. The resolution jump from the grid spacing of ERA-Interim data (0.75◦×0.75◦) to the one of the external WRF grid (12 km×12 km) ranges from about 5.5:1 to 7:1 (in longitude and latitude, respec-tively). Its use is justified by Beck et al. (2004) who con-cluded that the considered one-way nesting strategies are comparably successful for precipitation simulations even if a large resolution jump of 10:1 is employed. Similarly, Liu et al. (2012) showed that downscaling ratios of 7:1, 5:1, and 3:1 in an WRF model perform better than smaller ra-tios in terms of rainfall. Resolution jumps (from the forcing data to the external model grid) higher than 5:1 and up to 10:1 have been successfully employed in various numerical
Dudhia, 2001) in four layers (0–10, 10–40, 40–100, and 100–200 cm). Cumulus convection was parameterized only in nests D1 and D2 by the most recent version of the Kain– Fritsch scheme (Kain, 2004).
The model was initialized at 00:00 UTC, on 17 November 2007 (∼21 h before the event) for the 2007 tornado event. For the tornado events of 2010 and 2011, the model was ini-tialized at 00:00 UTC on 12 February 2010 (∼17 h before the event) and at 00:00 UTC on 20 September 2011 (∼15 h before the event), respectively. The time of initialization was selected in order to examine the model predictability more than 12 forecast hours ahead of the event and represent the values of previous diagnostic variables without spin up prob-lems.
The model outputs were available at a 10 min interval. This interval was chosen so as to investigate the ability of the WRF to simulate, in short time intervals, the evolution of convective weather events influenced by topography modifi-cations.
3 Tornadic events and synoptic analyses
In this section, a brief synoptic analysis for each tornado event is presented. Synoptic analyses concern the isobaric level of 500 hPa, based on ECMWF ERA-Interim analysis archive data set, and the mean sea level (MSL) pressure based on UK Met Office (UKMO) MSL pressure analysis. Figure 2 illustrates a collection of images revealing the force, the im-pact, and damage caused by each tornado to the local popu-lation. Hereafter, for reasons of brevity, we coded the torna-does as TXX, where T stands for tornado and XX represent the last two digits of the year when tornado occurred (e.g., T10 = Tornado event that occurred in 2010).
The first tornado event (hereafter T07) formed at approx-imately 21:20 UTC (±5 min) on 17 November 2007, over Loutoufi (lat.: 38.28◦N, long.: 23.28◦E; Fig. 1), a small vil-lage located 9 km SW of the city of Thebes. The tornado dissipated in the NW Thebes urban area (Piri district), its path was 10 km, and scattered broken branches of olive trees were dispersed all over the area (Fig. 2a and b). Additionally, significant structural damage was documented in the village of Loutoufi and city of Thebes. Regarding the tornado force scale, it could be characterized as a T4–T5 on the TORRO scale, based on a tornado damage survey. Synoptic analysis at the isobaric level of 500 hPa at 18:00 UTC (not shown), de-picts a closed cyclonic circulation over central Italy, implying a SW upper air stream over west Greece. A long trough line is positioned from southern Italy to northern Libya, accom-panied by a thermal trough of−20◦C. UKMO MSL pressure analysis at 18:00 UTC (Fig. 3a) illustrates a cold front activ-ity and an instabilactiv-ity line over west Greece.
The second tornado event (hereafter as T10) occurred 2.5 km south of Chalkidiki, at the village of Vrastama (lat.: 40.36, long.: 23.54; Fig. 1), a non urban area 45 km
south-Figure 2. Images (a–h) illustrate the impact of tornadoes to the
lo-cal society: (a) and (b) in Thebes, on 17 November 2007 (source: courtesy of 1st author), (c) and (d) in Vrastama, on 12 Febru-ary 2010 (source: http://forum.snowreport.gr/forumposts.asp?TID= _23403{\&}PN=_1), (e) and (f) in Vlychos, on 20 September 2011 (source: http://www.kolivas.de).
east of Thessaloniki in northern Greece, on 12 February 2010. The T10 developed approximately between 17:10 and 17:35 UTC, and caused significant damage to a nearby green-olive processing unit and to several green-olive-oil-producing farms (more than 100 olive trees were uprooted). Based on the dam-age caused (Fig. 2c and d), it could be characterized as T4– T5 on the TORRO scale. An ECMWF ERA-Interim upper air analysis at the isobaric level of 500 hPa (not shown), dur-ing the day of T10 event, showed a closed cyclonic circu-lation associated with cold air masses (−35◦C), inducing a SW upper air flow over the area of interest at 12:00 UTC. The cyclonic circulation extended throughout the lower tro-posphere; UKMO MSL pressure analysis at 18:00 UTC (Fig. 3b) showed a cold front extended from northern Greece to Peloponnisos (southern Greece) and northern Libya.
The last tornado event (hereafter as T11) developed at ap-proximately 15:20 UTC (±10 min), on 20 September 2011, over Vlychos (lat.: 38.68◦N, long.: 20.69◦E; Fig. 1), a small
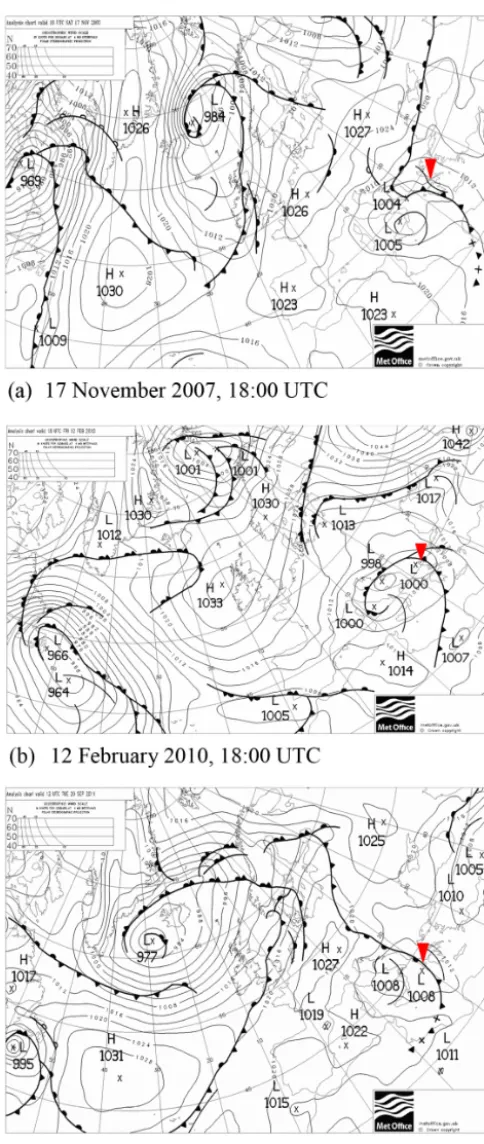
Figure 3. Mean sea level analysis charts, from the UK Met Office,
depicting the frontal activity around the tornadoes’ time of occur-rence for T07 (a), T10 (b) and T11 (c) tornado events. In every image, red triangles indicate the tornado locations.
A detailed synoptic analysis accompanied by remote sens-ing data (satellite and radar images) for T10 event was also presented by Matsangouras et al. (2011a). The syn-optic weather conditions and analysis during the day of the T07 event were similarly discussed by Matsangouras et al. (2012). Visualizations of weather conditions (spatial dis-tribution of lightning activity and ground observations) for T10 and T11 events are presented in Fig. 4, based on the Hel-lenic National Meteorological Service (HNMS) archive data set. Images were produced via HNMS’s METshell software (version v.2010.a) tailored for operational forecasting usage (Basiakos et al., 2000).
4 Model verification
The analysis of model errors in the control simulations per-formed on the day of each tornado is depicted in Table 2. The spin-up time (first 6 h) is not taken into account. The statistics are calculated using the available meteorological aerodrome reports (METARs) (from the meteorological sta-tions of HNMS that are nearest to each tornado event) and the corresponding model values of the innermost domain (D03). The model output fields of the grid point closest to each sta-tion are used in the verificasta-tion. Figure 1 illustrates the lo-cation of tornadoes and the meteorological stations (red and blue text, respectively). The distance of these stations from the corresponding tornado events range from 26 to 65 km and are considered representative of the meteorological con-ditions observed in the environment of tornadoes. Statistical measures of 10 m wind speed (WS), 2 m temperature (T), 2 m dew point (Td), and mean sea-level pressure (MSLP) at the meteorological stations are depicted in Table 2.
The model overestimated the 10 m wind speed across all stations from 0.68 to 2.36 m s−1. The MAE and RMSE of the 10 m wind speed ranged from 1.83 to 3.37 m s−1and from 2.50 to 4.01 m s−1, respectively. The 2 m temperature and the 2 m dew point were overestimated in all control simula-tions. The MAE (RMSE) of temperature was between 1.71 K (2.22 K) and 5.47 K (6.11 K) with the highest errors appear-ing at Tanagra airport (LGTG) (case of 17 November 2007). The dew point MAE and RMSE ranged from 1.19 to 3.37 K and from 1.60 to 4.42 K, respectively. Finally, the bias of the mean sea-level pressure was either close to 0 or negative, and its values fluctuated between 0.28 and−2.49 hPa. Its MAE was between 1.26 and 2.49 hPa, while the range of the RMSE was from 1.43 to 2.64 hPa.
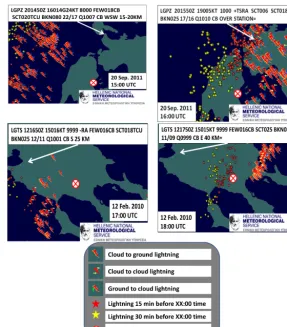
Figure 4. Visualization of lightning distribution in a 15 min step, associated with the T11 (upper images) and T10 (lower images) events.
Red and yellow stars represent the spatial distribution of lightning activity 15 and 30 min prior tornado formation, respectively. Tornadoes developed within the above hourly time window and the red X in a red circle denotes the location. METAR data from the closest weather stations, Preveza (LGPZ) and Thessaloniki (LGTS) for T11 and T10, respectively, were also presented.
2 hPa for the mean sea-level pressure, in the first 1–2 fore-cast days. Pytharoulis (2009) evaluated the SKIRON model (0.05◦×0.05◦) in Greece for the period June 2007–April 2009. During the first forecast days, the latter model ex-hibited RMSE between: (a) 2.2 and 2.7 m s−1 for the 10 m wind speed, (b) 2 and 2.5 K for 2 m temperature, and (c) 1 and 1.5 hPa for the mean sea-level pressure. Papadopoulos and Katsafados (2009) evaluated the POSEIDON forecasting system (0.05◦×0.05◦) across the eastern Mediterranean from
mid-November 2007 to October 2008 and obtained RMSE between: (a) 2.4 and 2.7 m s−1 for the 10 m wind speed, (b) 2.3 and 2.9 K for the 2 m temperature, and (c) 1.2 and 1.8 hPa for the mean sea-level pressure in the first two fore-cast days.
In this study, the model errors are generally within the values that appear in the literature, with a few exceptions (e.g., the 2 m temperature at LGTG and the 2 m dew point at LGPZ). The only parameter that systematically exhibited high values of RMSE is the 10 m wind speed. Some possible reasons for these errors are as follows:
a. They correspond to high-impact weather events at in-dividual stations and not to different weather types for multiple stations and long periods. In this study, most of the stations were under the influence of cumulonimbus activity for several hours. Even if a numerical model is successful in representing convective activity, it is very difficult to adequately represent the mesoscale flow in-duced by the storm. Ebert (2008) argues that although high-resolution numerical weather predictions can look quite realistic and be very useful, they have a “difficulty of predicting an exact match to the observations”. b. The model values were extracted from domain 3 that is
integrated with a time step of 8 s. On the contrary, the observed 10 m wind speeds are 10 min average values. c. The evaluation is based on METAR and not on SYNOP
Table 2. Statistical measures of 10 m wind speed (WS), 2 m temperature (T), 2 m dew point (Td) and mean sea-level pressure (MSLP) at the meteorological stations of the Hellenic National Meteorological Service at the airports of Tanagra (LGTG), Thessaloniki (LGTS), Cephalonia (LGKF), and Preveza (LGPZ). The model output fields of the D03 grid point closest to each station are used. ME=mean error (WRF-simulated minus observed value), MAE=mean absolute error, RMSE=root mean squared error, sample size=number of valid pairs of simulated and observed values. The date of the model validation and the distance of each station from the location of the corresponding tornado event are also indicated. The spin-up time (first 6 h) is not taken into account.
Date 17 November 2007 12 February 2010 20 September 2011 20 September 2011
Met. station LGTG LGTS LGKF LGPZ
Distance (km) 26 50 65 28
ME 10 m WS (m s−1) 2.36 0.95 1.16 0.68
ME 2 m T (K) 5.23 1.20 2.03 1.64
ME 2 m Td (K) 0.96 0.57 2.84 3.77 ME MSLP (hPa) −1.48 −2.49 0.28 −0.61 MAE 10 m WS (m s−1) 3.37 2.13 1.83 3.29 MAE 2 m T (K) 5.47 1.71 2.10 3.07 MAE 2 m Td (K) 1.68 1.19 2.97 3.77 MAE MSLP (hPa) 1.50 2.49 1.26 1.88 RMSE 10 m WS (m s−1) 3.98 2.64 2.50 4.01 RMSE 2 m T (K) 6.11 2.22 2.26 3.49 RMSE 2 m Td (K) 1.97 1.60 3.98 4.42 RMSE MSLP (hPa) 1.76 2.64 1.43 2.08
Sample size 15 36 21 30
of the actual measurements of the above parameters, re-spectively, performed with METAR reports. Moreover, the fact that the METAR reports are available in hourly and half-hourly intervals, contrary to the 6-hourly in-tervals of SYNOP, which were employed in the above-mentioned studies, allows the identification of tempo-rary model errors, which could have been missed if the model validation was based on the latter reports.
5 Absolute vorticity budget
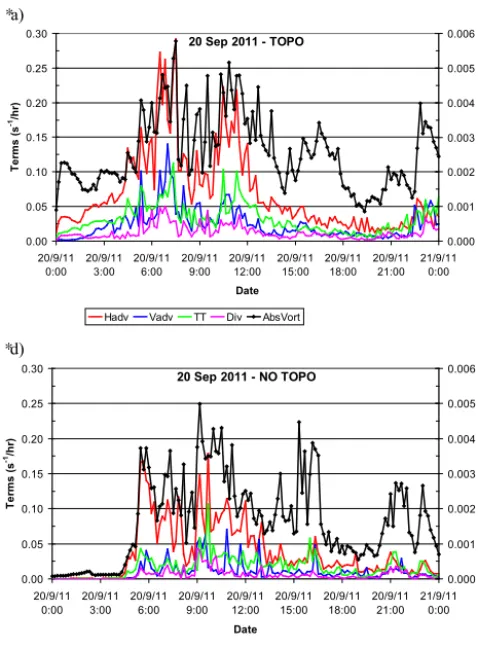
The vorticity field and the vorticity equation are useful tools, commonly employed in studies of atmospheric dynamics. The absolute vorticity and the vorticity equation terms were derived at 10 min intervals at 1 km a.s.l.This height was se-lected because in nature it is generally located near the base of thunderstorms and in the simulations it was detected above the model topography (at the location of each actual tornado). The values of the above terms, but not the conclusions, were modified when the height moderately increased (up to 2 km). The calculations were performed using the Grid Analysis and Display System (GrADS) and were based on the simulated WRF parameters of the innermost domain (D3). The neces-sary upper air fields were vertically interpolated at 250 m in-tervals before the calculation of the vertical derivatives. All the derivatives were estimated using second-order centered finite differences.
Figures 5–7 illustrate time series of the maximum values of the absolute vorticity and the vorticity equation terms of horizontal and vertical advection, tilting/twisting, and diver-gence, in a box of 0.2◦×0.2◦latitude–longitude centered at the actual location of each tornado. It was chosen to exhibit the results in a limited area and not locally, in order to con-sider any shift of the meteorological conditions due to model error. Both experiments (with and without topography) are shown for each tornado case. The solenoidal term is not dis-played because it was computed to be at least four orders of magnitude less than the other terms. A very limited number of grid points with topography above or equal to 1 km within the above-mentioned area (0.2◦×0.2◦) were not taken into account.
(a)
17 Nov 2007 - TOPO
0.00 0.05 0.10 0.15 0.20 0.25 17/11/07
0:00 17/11/073:00 17/11/076:00 17/11/079:00 17/11/0712:00 17/11/0715:00 17/11/0718:00 17/11/0721:00 18/11/070:00
Date Ter m s ( s -1/hr ) 0.000 0.002 0.004 0.006 0.008 0.010 A bs Vo rt (s -1)
Hadv Vadv TT Div AbsVort
17 Nov 2007 - NO TOPO
0.00 0.05 0.10 0.15 0.20 0.25 17/11/07
0:00 17/11/073:00 17/11/076:00 17/11/079:00 17/11/0712:00 17/11/0715:00 17/11/0718:00 17/11/0721:00 18/11/070:00
Date Ter m s ( s -1/hr ) 0.000 0.002 0.004 0.006 0.008 0.010 A bs Vo rt (s -1)
Hadv Vadv TT Div AbsVort
(b)
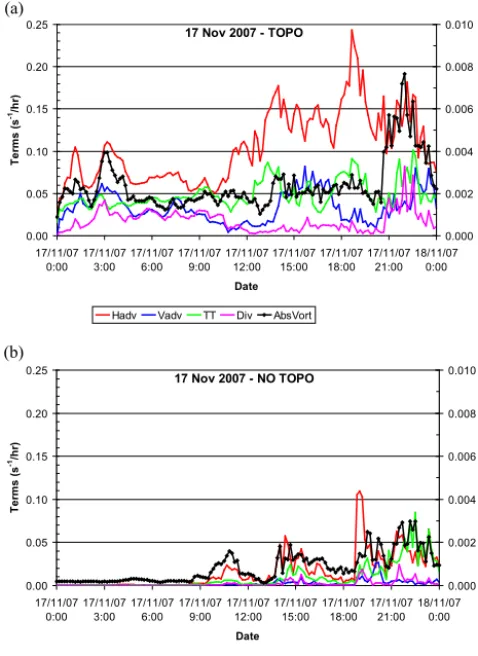
Figure 5. Time series of WRF maximum simulated values of
Ab-solute Vorticity (s−1) and of the vorticity equation terms (s−1h−1) of horizontal (Hadv) and vertical advection (Vadv), tilting/twisting (TT), and divergence (DIV), at 1 km a.s.l.in a box of 0.2◦×0.2◦ latitude–longitude centered at the actual location of the tornado of 17 November 2007, (a) with topography and (b) without topogra-phy. Time is in UTC.
In all cases, the simulations with topography are associ-ated with higher values of maximum absolute vorticity in the area of interest than those without topography (Figs. 5–7). Similarly, the vorticity equation terms that determine the Eu-lerian time change of vorticity display higher maximum va-lues in the experiment with topography. The differences be-tween the two experiments, and the concomitant importance of topography for tornadogenesis, are more distinguishable in the cases of 17 November 2007 (Fig. 5) and 12 Febru-ary 2010 (Fig. 6). The former tornado occurred at a location surrounded by mountains and the latter one developed in the mountains of Chalkidiki in northern Greece.
6 Results and discussion
In this section, we present the results of numerical simulation analyses of EHI, BRN, SRH, and MCAPE diagnostic vari-ables based on the actual topography and modified
a)
12 Feb 2010 - TOPO
0.00 0.05 0.10 0.15 0.20 0.25 0.30 0.35 0.40 12/2/10
0:00 12/2/103:00 12/2/106:00 12/2/109:00 12/2/1012:00 12/2/1015:00 12/2/1018:00 12/2/1021:00 13/2/100:00
Date Ter m s ( s -1/hr ) 0.000 0.002 0.004 0.006 0.008 0.010 0.012 0.014 0.016 A bs Vo rt (s -1)
Hadv Vadv TT Div AbsVort
12 Feb 2010 - NO TOPO
0.00 0.05 0.10 0.15 0.20 0.25 0.30 0.35 0.40 12/2/10
0:00 12/2/103:00 12/2/106:00 12/2/109:00 12/2/1012:00 12/2/1015:00 12/2/1018:00 12/2/1021:00 13/2/100:00 Date Ter m s ( s -1/hr ) 0.000 0.002 0.004 0.006 0.008 0.010 0.012 0.014 0.016 A bs Vo rt (s -1)
Hadv Vadv TT Div AbsVort E)
Figure 6. Similar to Fig. 5 but for the case of 12 February 2010.
phy in the inner domain box (D3 as described in Sect. 2). The actual topography is illustrated in meters in Fig. 1a. Here-after, for brevity reasons, the numerical simulation results based on modified (reducing) topography of D3 domain will be coded as TOPOMX, where X stands for the percentage (%) of modification. Thus, TOPOM0 means modified topog-raphy by 0 % (actual topogtopog-raphy), and TOPOM100 refers to modified topography by−100 % (without topography).
a)
20 Sep 2011 - TOPO
0.00 0.05 0.10 0.15 0.20 0.25 0.30 20/9/11
0:00 20/9/113:00 20/9/116:00 20/9/119:00 20/9/1112:00 20/9/1115:00 20/9/1118:00 20/9/1121:00 21/9/110:00
Date Ter m s ( s -1/hr ) 0.000 0.001 0.002 0.003 0.004 0.005 0.006 A bs Vo rt (s -1)
Hadv Vadv TT Div AbsVort
20 Sep 2011 - NO TOPO
0.00 0.05 0.10 0.15 0.20 0.25 0.30 20/9/11
0:00 20/9/113:00 20/9/116:00 20/9/119:00 20/9/1112:00 20/9/1115:00 20/9/1118:00 20/9/1121:00 21/9/110:00
Date Ter m s ( s -1/hr ) 0.000 0.001 0.002 0.003 0.004 0.005 0.006 A bs Vo rt (s -1)
Hadv Vadv TT Div AbsVort
E)
Figure 7. Similar to Fig. 5 but for the case of 20 September 2011.
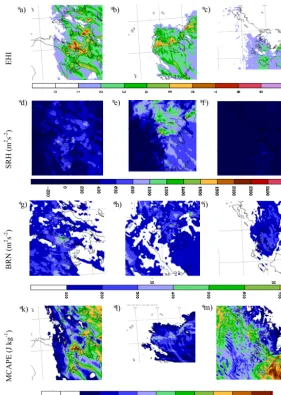
less than 15 km to the south), while 30 min after tornadoge-nesis EHI reduces to 6 (Fig. 8a). In contrast to TOPOM0, TOPOM100 (Fig. 8a, dotted green line with squares) EHI analysis depicts a gradually reduction of EHI values (from 5 to 3) prior to the time of tornadogenesis, documenting the influence of topography. During T10 numerical simula-tions with TOPOM0 (Fig. 8a, solid red line with triangles) and TOPOM100 (Fig. 8a, dotted red line with triangles), EHI analysis presents significant high values (EHI>5) for both simulation sets. More specifically, the TOPOM0 exper-iment shows a gradual increase of the EHI value (from 5 to 8, 80 min prior to tornadogenesis) (Fig. 8a). Figure 9b de-picts this value too close to the tornadogenesis location (less than 10 km to the WSW), while after tornado formation the EHI declines to 5. The EHI analysis of T10 TOPOM100 experiment presents lower values (compared to TOPOM0) that started reducing prior to tornadogenesis. Regarding the T11 (a coastal tornado event) TOPOM0 (Fig. 8a, solid blue line with circles) and TOPOM100 (Fig. 8a, dotted blue line with circles) numerical simulations, EHI analysis remains identical, suggesting that topography did not influenced EHI. The spatial distribution of EHI in T11 TOPOM0 experiment shows a value of EHI>2, 30 km SE of tornado location (Fig. 9c). a) 0 1 2 3 4 5 6 7 8 9 EH I Minutes T07 TOPOM0 T07 TOPOM100 T10 TOPOM0 T10 TOPOM100 T11 TOPOM0 T11 TOPOM100 b) 200 400 600 800 1000 1200 1400 1600 1800 2000 SR H (m 2s -2) Minutes T07 TOPOM0 T07 TOPOM100 T10 TOPOM0 T10 TOPOM100 T11 TOPOM0 T11 TOPOM100 c) 0 100 200 300 400 500 600 700 B R N (m 2s -2) Minutes T07 TOPOM0 T07 TOPOM100 T10 TOPOM0 T10 TOPOM100 T11 TOPOM0 T11 TOPOM100 d) 600 800 1000 1200 1400 1600 1800 2000 2200 MC A PE (J kg -1) Minutes T07 TOPOM0 T07 TOPOM100 T10 TOPOM0 T10 TOPOM100 T11 TOPOM0 T11 TOPOM100 Figure 8. Graphics (a–d) illustrating TOPOM0 (solid lines) and
TOPOM100 (dotted lines) simulations results 90 min prior to and 60 min after tornadogenesis for EHI (a), SRH (b), BRN (c), and MCAPE (d) for every tornadic case study. The results of T07, T10, and T11 simulations are illustrated with green lines with squares, red lines with triangles, and blue lines with circles, respectively. All values for the two sets of simulations (TOPOM0 and TOPOM100) illustrate the values of instability indices in radii of less than 20 km from the tornadogenesis location.
EHI
a) b) c)
SR
H
(m
2s -2)
d) e) f)
BRN
(m
2s -2)
g) h) i)
MC
A
PE
(J k
g
-1 )
k) l) m)
Figure 9. Spatial distribution of the four diagnostic variables of TOPOM0 simulations at the time of tornadogenesis for each tornado case
(T07 left column, T10 middle column and T11 right column.
less than 20 km SE from the tornado location. TOPOM100 (Fig. 8b, dotted green line with squares) numerical simu-lation spatial distribution depicts the same cell area with a value of 200 m2s−2less than SRH TOPOM0, suggesting an influence of topography at this tornado study. The influence of topography is also evident in the SRH analysis of T10 case study. T10 TOPOM0 (Fig. 8b, solid red line with tri-angles) numerical simulation suggests that the maximum va-lues were constant at 1200 m2s−2(prior to tornadogenesis) and increased significantly (2000 m2s−2) as the storm prop-agated eastwards. Figure 9e illustrates the maximum SRH T10 TOPOM0 value (1200 m2s−2) in less than 10 km WSW. T10 TOPOM100 (Fig. 8b, dotted red line with triangles) re-sults follow the TOPOM0 spatial distribution pattern (sig-nificant increase of SRH after tornadogenesis) but in lower values (200 m2s−2 less). Regarding T11 simulations, SRH analysis does not reveal any influence of topography, but
dis-plays a similar output to the EHI analysis. From these two outputs, regarding T11 simulations, we become aware that similar CAPE numerical investigation is not going to depict any positive or negative influence of topography as EHI is expressed in terms of SRH and CAPE (Table 2).
The latter BRN analysis for T07 reveals the influence of to-pography as the TOPOM100 simulation demonstrates lower values compared with the TOPOM0 simulation. Studying the two sets of T10 numerical simulations, TOPOM0 (Fig. 8c, solid red line with triangles) and TOPOM100 (Fig. 8c, dot-ted red line with triangles), we come to the same conclu-sion regarding the analysis of BRN diagnostic variable. The TOPOM0 BRN spatial distribution illustrates higher values (Fig. 9h, 300 m2s−2, 10 km west of the tornado location) than TOPOM100. In contrast to T10, the two numerical ex-periments of T11 do not reveal any influence of topography over BRN analysis. In both simulations of T11 (Fig. 8c) BRN variable analysis displays an identical spatial distribution.
At T07 TOPOM0 simulation, MCAPE analysis (Fig. 8d, solid green line with triangles) shows that values re-main steadily higher than 1500 J kg−1. Regarding T07 TOPOM100 simulation, MCAPE analysis (Fig. 8d, solid green line with triangles) illustrates a gradual decrease of MCAPE prior to tornadogenesis. MCAPE spatial dis-tribution (Fig. 9k) from TOPOM0 simulation at the time of tornadogenesis illustrates an area of high values south of tornado location. Regarding T10, MCAPE analysis of TOPOM0 (Fig. 8d, dot red line with triangles) and TOPOM100 (Fig. 8d, dotted red line with triangles) simu-lations indicates that topography does not significantly af-fect the evolution of this diagnostic variable. The MCAPE at TOPOM100 analysis is reduced only for a short time frame (from 30 min prior to 20 min after tornadogenesis). MCAPE analysis for the simulation sets of T11 illustrates an identical pattern of maximum values, depicting that topography does not influence the MCAPE diagnostic variable in this tornado event.
Based on EHI, SRH, BRN, and MCAPE analyses of TOPOM100 and TOPOM0 simulations, the complex terrain was important in T07 and T10, with the former exhibiting higher values. Topography appeared to constitute an unim-portant factor during T11 event, utilizing EHI, SRH, BRN, and MCAPE diagnostic variables. Conversely in the T07 event, topography was an important factor across all diagnos-tic variables, since EHI and MCAPE variables at TOPOM0 simulation actually doubled compared to the TOPOM100 simulation at the time of tornadogenesis. During the T07 event, the storm propagated ENE, over a steep slope terrain, from the coast at the Gulf of Corinth to a complex terrain of 1200 m elevation. EHI, MCAPE and SRH variables showed a significant increase 30 min prior to the T07 tornado event.
7 Summary and conclusions
Three tornado events that occurred in recent years in Greece were selected for numerical experiments, in order to in-vestigate the role of topography in significant tornadoge-nesis events triggered under strong synoptic scale forcing. The first tornado event (T07) affected Thebes (Boeotia,
on 17 November 2007), the second event (T10) Vrastema (Chalkidiki, on 12 February 2010) and the last one (T11) Vlychos (Lefkada, on 20 September 2011). These events have been associated with synoptic scale forcing, while their intensities were T4–T5 (TORRO scale) causing significant damage.
Considering the time of tornado occurrence and MSL syn-optic analysis charts, from UK Met Office (UKMO), all tor-nadoes were formed within storms that were associated with a synoptic force ingredient. All events occurred in the pro-frontal activity area, ahead of cold front.
Numerical simulations were performed using the non-hydrostatic weather research and forecasting (WRF, ARW core) model. Three one-way nested domains were utilized with spatial resolution of 12 km for D1, 4 km for D2 and 1.333 km for D3 domain. Initial and lateral boundary condi-tions for the D1 domain were obtained from ECMWF ERA-Interim data set, with telescoping nested grids that allow for the representation of atmospheric circulations ranging from the synoptic scale down to the mesoscale. The WRF-ARW model setup was able to forecast significant values of diag-nostic variables with a lead time of more than 12 h. In all experiments the topography of the inner grid (D3) was modi-fied by: (a) 0 % (actual topography) and (b)−100 % (without topography). Analyses concerned a data set of diagnostic in-stability variables: EHI, BRN, SRH, and MCAPE.
The model verification performed in this study has shown that model errors are generally within the values that appear in the literature, with a few exceptions (e.g., the 2 m temper-ature at LGTG and the 2 m dew point at LGPZ). The analysis of absolute vorticity budget revealed that in all cases the sim-ulations with topography are associated with higher values of maximum absolute vorticity in the area of interest than those without topography. Similarly, the vorticity equation terms that determine the Eulerian time change of vorticity display higher maximum values in the experiment with topography. The differences between the two experiments, and the con-comitant importance of topography for tornadogenesis, are more distinguishable in the cases of 17 November 2007 and 12 February 2010. The similar values of maximum absolute vorticity and maximum vorticity equation terms in the two experiments of T11 event suggested that, in this case, topog-raphy played a minor role, while the synoptic forcing domi-nated.
Numerical simulations revealed that complex topogra-phy constituted an important factor during 17 November 2007, 12 February 2010 events, based on EHI, SRH, BRN, and MCAPE analyses. Conversely, topography around the 20 September 2011 event was a less important factor based on EHI, SRH, BRN, and MCAPE analyses.
Acknowledgements. The authors would like to thank the
Hel-lenic National Meteorological Service (HNMS) for providing all the necessary graphics and remote sensor data set associated with the tornadic events. The contribution of the European Centre for Medium-Range Weather Forecasts (ECMWF) is also acknowledged for the data set utilized to generate the initial and boundary conditions for the WRF-ARW runs. Finally, the authors extend thanks to the UK Met Office (UKMO) and the http://www.wetter3.de for the retrieval of the UKMO’s MSL pressure analysis charts, as well as to the MMM division of NCAR for providing WRF model.
Edited by: N. R. Dalezios
Reviewed by: two anonymous referees
References
Basiakos, I., Katsaras, P., Alexiou, I., Mavroudis, A., Karanikas, T., and Skrimizeas, P.: Operational Workstations at the Hellenic Na-tional Meteorological Service & A windows NT Based Briefing System, 11th European Working Group on Operational Meteo-rological Workstations (11th EGOWS), 5–8 June 2000, Helsinki, Finland, 2000.
Beck, A., Ahrens, B., and Stadlbacher, K.: Impact of nesting strate-gies in dynamical downscaling of reanalysis data, Geophys. Res. Lett., 31, L19101, doi:10.1029/2004GL020115, 2004.
Bosart, L. F., Seimon, A., LaPenta, K. D., and Dickinson, M. J.: Su-percell tornadogenesis over complex terrain: the Great Barring-ton, Massachusetts, tornado on 29 May 1995, Weather Forecast., 21, 897–922, 2006.
Braun, S. A. and Monteverdi, J. P.: An analysis of a mesocyclone– induced tornado occurrence in Northern California, Weather Forecast., 6, 13–31, 1991.
Brooks, H. E.: Proximity soundings for severe convection for Eu-rope and the United States from reanalysis data, Atmos. Res., 93, 546–553, 2009.
Brooks, H. E., Doswell, C. A. III, and Kay, M. P.: Climatological estimates of local daily tornado probability for the United States, Weather Forecast., 18, 626–640, 2003.
Chen, C.-S., Lin, Y.-L., Peng, W.-C., and Liu, C.-L.: Investigation of a heavy rainfallevent over southwestern Taiwan associated with a subsynoptic cyclone during the 2003 Mei-Yu season, Atmos. Res., 95, 235–254, 2010.
Chen, C.-S., Lin, Y.-L., Hsu, N.-N., Liu, C.-L., and Chen, C.-Y.: Orographic effects on localized heavy rainfall events over south-western Taiwan on 27 and 28 June 2008 during the post-Mei-Yu period, Atmos. Res., 101, 595–610, 2011.
Chen, C.-S., Lin, Y.-L., Zeng, H.-T., Chen, C.-Y., and Liu, C.-L.: Orographic effects on heavy rainfall events over northeastern Tai-wan during the northeasterly monsoon season, Atmos. Res., 122, 310–335, 2013.
Chen, F. and Dudhia, J.: Coupling an advanced land-surface/ hy-drology model with the Penn State/ NCAR MM5 modeling system. Part I: Model description and implementation, Mon. Weather Rev., 129, 569–585, 2001.
Chiao, S., Lin, Y.-L., and Kaplan, M. L.: Numerical study of the orographic forcing of heavy precipitation during MAP IOP-2B, Mon. Weather Rev., 132, 2184–2203, 2004.
Colle, B. A. and Mass, C. F.: Windstorms along the western side of the Washington Cascade Mountains. Part I: A high-resolution observational and modeling study of the 12 February 1995 event, Mon. Weather Rev., 126, 28–52, 1998.
Colle, B. A. and Mass, C. F.: High-resolution observations and nu-merical simulations of easterly gap flow through the Strait of Juan de Fuca on 9–10 December 1995, Mon. Weather Rev., 128, 2398–2422, 2000a.
Colle, B. A. and Mass, C. F.: The 5–9 February 1996 flooding event over the Pacific Northwest: Sensitivity studies and evaluation of the MM5 precipitation forecasts, Mon. Weather Rev., 128, 593– 617, 2000b.
Craven, J. P. and Brooks, H. E.: Baseline climatology of sound-ing derived parameters associated with deep, moist convection, Preprints, 21st Conference on Severe Local Storms, 12–16 Au-gust 2002, St. Antonio, TX, USA, 2002.
Dee, D. P., Uppala, S. M., Simmons, A. J., Berrisford, P., Poli, P., Kobayashi, S., Andrae, U., Balmaseda, M. A., Balsamo, G., Bauer, P., Bechtold, P., Beljaars, A. C. M., van de Berg, L., Bid-lot, J., Bormann, N., Delsol, C., Dragani, R., Fuentes, M., Geer, A. J., Haimberger, L., Healy, S. B., Hersbach, H., Hólm, E. V., Isaksen, L., Kållberg, P., Köhler, M., Matricardi, M., McNally, A. P., Monge-Sanz, B. M., Morcrette, J. J., Park, B. K., Peubey, C., de Rosnay, P., Tavolato, C., Thépaut, J. N., and Vitart, F.: The ERA-Interim reanalysis: configuration and performance of the data assimilation system, Q. J. Roy. Meteor. Soc., 137, 553–597, doi:10.1002/qj.828, 2011.
Dessens, J.: Les Trombes en France, Climatologie et Caractéris-tiques Physiques, Lannemezan, France, 1984 (in French). Dessens, J. and Snow, J. T.: Tornadoes in France, Weather Forecast.,
4, 110–132, 1987.
Doswell, C. A. III: The distinction between large-scale and mesoscale contribution to severe convection: a case study exam-ple, Weather Forecast., 2, 3–16, 1987.
Doswell, C. A. III and Evans, J. S.: Proximity sounding analysis for derechos and supercells: An assessment of similarities and differences, Atmos. Res., 67–68, 117–133, 2003.
Doswell, C. A. III and Schultz, D. M.: On the use of indices and parameters in forecasting severe storms, E-Journal of Severe Storms Meteorology, 1, 1–22, 2006.
Doswell, C. A. III, Brooks, H. E., and Maddox, R. A.: Flash flood forecasting: an ingredients-based methodology, Weather Fore-cast., 11, 560–580, 1996.
Droegemeier, K. K., Lazarus, S. M., and Davies-Jones, R. D.: The influence of helicity on numerically simulated convective storms, Mon. Weather Rev., 121, 2005–2029, 1993.
Ebert, E. E.: Fuzzy verification of high-resolution gridded forecasts: a review and proposed framework, Meteorol. Appl., 15, 51–64, 2008.
Ferrier, B. S., Lin, Y., Black, T., Rogers, E., and DiMego, G.: Imple-mentation of a new grid-scale cloud and precipitation scheme in the NCEP Eta model, Preprints, 15th Conference on Numerical Weather Prediction, San Antonio, TX, American Meteorological Society, 280–283, 2002.
Gayà, M., Llasat, M.-C., and Arús, J.: Tornadoes and waterspouts in Catalonia (1950–2009), Nat. Hazards Earth Syst. Sci., 11, 1875– 1883, doi:10.5194/nhess-11-1875-2011, 2011.
Giaiotti, D. B., Giovannoni, M., Pucillo, A., and Stel, F.: The cli-matology of tornadoes and waterspouts in Italy, Atmos. Res., 83, 534–541, 2007.
Gianfreda, F., Miglietta, M. M., and Sansò, P.: Tornadoes in South-ern Apulia (Italy), Nat. Hazards, 34, 71–89, 2005.
Glickman, T. S.: Glossary of Meteorology, 2nd Edn., American Me-teorological Society, 855 pp., 2000.
Gofa, F., Pytharoulis, I., Andreadis, T., Papageorgiou, I., Fragkouli, P., Louka, P., Avgoustoglou, E., and Tyrlis, V.: Evaluation of the operational NWP forecasts of the Hellenic National Meteoro-logical Service, in: 9th Conference on Meteorology, Climatol-ogy and Atmospheric Physics, 28–31 May, Thessaloniki, 51–58, 2008.
Groenemeijer, P. and van Delden, A.: Sounding-derived parameters in the vicinity of large hail and tornadoes in The Netherlands, Atmos. Res., 67–68, 273–299, 2007.
Groenemeijer, P., Corsmeier, U., and Kottmeier, Ch.: The devel-opment of tornadic storms on the cold side of a front favoured by local enhancement of moisture and CAPE, Atmos. Res., 100, 765–781, 2011.
Hannesen, R., Dotzek, N., Gysi, H., and Beheng, K. D.: Case study of a tornado in the Upper Rhine valley, Meteorol. Z., 7, 163–170, 1998.
Hart, J. A. and Korotky, W.: The SHARP workstation v1.50 users guide. National Weather Service, NOAA, U.S. Department of Commerce, 30 pp., 1991.
Homar, V., Gaya, M., Romero, R., Ramis, C., and Alonso, S.: Torna-does over complex terrain: an analysis of the 28th August 1999 tornadic event in Eastern Spain, Atmos. Res., 67–68, 301–317, 2003.
Houze, R. A. Jr.: Cloud Dynamics, Academic Press Inc, San Diego, California, 1993.
Iacono, M. J., Delamere, J. S., Mlawer, E. J., Shephard, M. W., Clough, S. A., and Collins, W. D.:: Radiative forcing by long-lived greenhouse gases: Calculations with the AER ra-diative transfer models, J. Geophys. Res., 113, D13103, doi:10.1029/2008JD009944, 2008.
Janjic, Z. I.: The surface layer in the NCEP Eta Model, Eleventh Conference on Numerical Weather Prediction, 19–23 August, American Meteorological Society, Norfolk, VA, 354–355, 1996. Janjic, Z. I.: Nonsingular Implementation of the Mellor–Yamada Level 2.5 Scheme in the NCEP Meso model, NCEP Office Note, 437, 61 pp., 2002
Johns, R. H. and Doswell, C. A. III: Severe local storms forecasting, Weather Forecast., 7, 588–612, 1992.
Johns, R. H., Davies, M., and Leftwich, P. M.: Some wind and in-stability parameters associated with strong and violent tornadoes. Part II: Variations in the combinations of wind and instability pa-rameters. The Tornado: Its Structure, Dynamics, Hazards, and Prediction, Amer. Geophys. Union, Geophys. Monogr., 79, 583– 590, 1993.
Kain, J. S.: The Kain-Fritsch convective parameterization: An up-date, J. Appl. Meteorol., 43, 170–181, 2004.
Katsafados, P., Mavromatidis, E., Papadopoulos, A., and Pytharoulis, I.: Numerical simulation of a deep Mediter-ranean storm and its sensitivity on sea surface temperature, Nat.
Hazards Earth Syst. Sci., 11, 1233–1246, doi:10.5194/nhess-11-1233-2011, 2011.
Koletsis, I., Lagouvardos, K., Kotroni, V., and Bartzokas, A.: Numerical study of a downslope windstorm in Northwestern Greece, Atmos. Res., 94, 178–193, 2009.
Koletsis, I., Lagouvardos, K., Kotroni, V., and Bartzokas, A.: The interaction of northern wind flow with the complex topogra-phy of Crete Island – Part 2: Numerical study, Nat. Hazards Earth Syst. Sci., 10, 1115–1127, doi:10.5194/nhess-10-1115-2010, 2010.
Liu, J., Bray, M., and Han, D.: Sensitivity of the Weather Research and Forecasting (WRF) model to downscaling ratios and storm types in rainfall simulation, Hydrol. Process., 26, 3012–3031, doi:10.1002/hyp.8247, 2012.
Louka, P., Galanis, G., Siebert, N., Kariniotakis, G., Katsafa-dos, P., Pytharoulis, I., and Kallos, G.: Improvements in wind speed forecasts for wind power prediction purposes using Kalman filtering, J. Wind Eng. Ind. Aerod., 96, 2348–2362, doi:10.1016/j.jweia.2008.03.13, 2008.
Markowski, P. M., Straka, J. M., Rasmussen, E. N., and Blanchard, E. N.: Variability of Storm-Relative Helicity during VORTEX, Mon. Weather Rev., 126, 2959–2971, 1998.
Mass, C., Ovens, D., Westrick, K., and Colle B.: Does increasing horizontal resolution produce more skilful forecasts?, B. Am. Meteorol. Soc., 83, 407–430, 2002.
Matsangouras, J. T. and Nastos, P. T.: The 27 July 2002 tor-nado event in Athens, Greece, Adv. Sci. Res., 4, 9–13, doi:10.5194/asr-4-9-2010, 2010.
Matsangouras, I. T., Nastos, P. T., and Nikolakis, D.: Study of me-teorological conditions related to the tornado activity on 25-3-2009 over NW Peloponnesus, Greece, in: Proc. 10th Inter-national Conference on Meteorology, Climatology and Atmo-spheric Physics (COMECAP2010), 25–38 May 2010, Patras, Greece, 417–425, 2010 (in Greek).
Matsangouras, I. T., Nastos, P. T., and Pytharoulis, I.: Synoptic-mesoscale analysis and numerical modeling of a tornado event on 12 February 2010 in northern Greece, Adv. Sci. Res., 6, 187– 194, doi:10.5194/asr-6-187-2011, 2011a.
Matsangouras, I. T., Nastos, P. T., and Sioutas, M. V.: 300 Years his-torical records of tornadoes, waterspouts and funnel clouds over Greece, in: 6th European Conference on Severe Storms (ECSS 2011), Palma de Mallorca Balearic Islands, Spain, 3–7 October 2011, ECSS2011-215, 2011b.
Matsangouras, I. T., Nastos, P. T., and Pytharoulis, I.: Numerical Investigation of the Role of Topography in Tornado Events in Greece, in: Advances in Meteorology, Climatology and Atmo-spheric Physics, edited by: Helmis, C. G. and Nastos, P. T., Springer Berlin Heidelberg, 209–215, doi:10.1007/978-3-642-29172-2_30, 2012.
Matsangouras, I. T., Nastos, P. T., Bluestein, H. B., and Sioutas, M. V.: A climatology of tornadic activity over Greece based on historical records, Int. J. Climatol., 34, 2538–2555, doi:10.1002/joc.3857, 2014.
Meaden, G.: Tornadoes in Britain: their intensities and distribution in space and time, J. Meteorol., 1, 242–251, 1976.
Miao, J.-F., Kroon, L. J. M., VilaGuerau de Arellano, J., and Holt-slag, A. A. M.: Impacts of topography and land degradation on the sea breeze over eastern Spain, Meteorol. Atmos. Phys., 84, 157–170, doi:10.1007/s00703-002-0579-1, 2003.
Miglietta, M. M. and Regano, A.: An observational and numerical study of a flash-flood event over south-eastern Italy, Nat. Hazards Earth Syst. Sci., 8, 1417–1430, doi:10.5194/nhess-8-1417-2008, 2008.
Moncrieff, M. W. and Green, J. S. A.: The propagation and transfer properties of steady convective overturning in shear, Q. J. Roy. Meteor. Soc., 98, 336–352, 1972.
Monteverdi, J. P., Doswell, C. A. III, and Lipari, G. S.: Shear param-eter thresholds for forecasting tornadic thunderstorms in northern and central California, Weather Forecast., 18, 357–370, 2003. Nastos, P. T. and Matsangouras, J. T.: Tornado activity in
Greece within the 20th century, Adv. Geosci., 26, 49–51, doi:10.5194/adgeo-26-49-2010, 2010.
Nastos, P. T. and Matsangouras, I. T.: Composite Mean and Anomaly of Synoptic Conditions for Tornadic Days over North Ionian Sea (NW Greece), in: Advances in Meteorol-ogy, Climatology and Atmospheric Physics, edited by: Helmis, C. G. and Nastos, P. T., Springer Berlin Heidelberg, 639–645, doi:10.1007/978-3-642-29172-2_91, 2012.
Paul, F.: A developing inventory of tornadoes in France, Atmos. Res., 56, 269–280, 2000.
Paul, J. F.: An inventory of tornadoes in France, Weather, 54, 217– 219, 1999.
Papadopoulos, A. and Katsafados, P.: Verification of operational weather forecasts from the POSEIDON system across the East-ern Mediterranean, Nat. Hazards Earth Syst. Sci., 9, 1299–1306, doi:10.5194/nhess-9-1299-2009, 2009.
Pytharoulis, I.: High-resolution operational numerical weather fore-casts for agrometeorological applications, in: 6th Hellenic Con-ference of Agricultural Engineering, 8–10 October, Thessaloniki, Greece, 75–82, 2009 (in Greek).
Rasmussen, E. N.: Refined supercell and tornado forecast parame-ters, Weather Forecast., 18, 530–535, 2003.
Rasmussen, E. N. and Blanchard, D. O.: A baseline climatology of sounding-derived super-cell and tornado forecast parameters, Weather Forecast., 13, 1148–1164, 1998.
Schaefer, J. T.: Severe thunderstorm fore-casting: A historical per-spective, Weather Forecast., 1, 164–189, 1986.
Shafer, C. M., Mercer, A. E., Doswell, C. A. III, Richman, M. B., and Leslie, L. M.: Evaluation of WRF Forecasts of Tornadic and Nontornadic Outbreaks When Initialized with Synoptic-Scale In-put, Mon. Weather Rev., 137, 1250–1271, 2009.
Sioutas, M. V.: A tornado and waterspout climatology for Greece, Atmos. Res., 100, 344–356, 2011.
Sioutas, M. V., Nastos, P. T., Matsangouras, I. T., and Floca, H. A.: Meteorological Conditions Associated with Strong Tornadoes in Greece, in: Advances in Meteorology, Climatology and At-mospheric Physics, edited by: Helmis, C. G. and Nastos, P. T., Springer Berlin Heidelberg, 293–299, doi:10.1007/978-3-642-29172-2_42, 2012.
Skamarock, W. C., Klemp, J. B., Dudhia, J., Gill, D. O., Barker, D. M., Duda, M. G., Huang, X.-Y., Wang, W., and Powers, J.G.: A description of the Advanced Research WRF Version 3, NCAR/TN-475, 2008.
Stathopoulos, C., Kaperoni, A., Galanis, G., and Kallos, G.: Wind power prediction based on numerical and statistical models, J. Wind Eng. Ind. Aerod., 112, 25–38, 2013.
Thompson, R. L., Edwards, R., Hart, J. A., Elmore, K. L., and Markowski, P.: Close proximity soundings within supercell envi-ronments obtained from the Rapid Update Cycle, Weather Fore-cast., 18, 1243–1261, 2003.
Wang, W., Bruyere, C., Duda, M., Dudhia, J., Gill, D., Lin, H.-C., Michalakes, J., Rizvi, S., Zhang, X., Beezley, J., Coen, J., and Mandel, J.: ARW Version 3 Modeling System User’s Guide, NCAR-MMM, 352 pp., 2010.
Weisman, M. L. and Klemp, J. B.: The dependence of numerically simulated convective storms on vertical wind shear and buoy-ancy, Mon. Weather Rev., 110, 504–520, 1982.