Nutrient Intake From Food in Children With Autism
abstract
OBJECTIVE:The impact of abnormal feeding behaviors reported for children with autism spectrum disorders (ASDs) on their nutritional status is unknown. We compared nutrient intake from food consumed
by children with and without ASD and examined nutrient deficiency
and excess.
METHODS:Prospective 3-day food records and BMI for children (2–11 years) with ASD participating in the Autism Treatment Network (Arkansas, Cincinnati, Colorado, Pittsburgh, and Rochester) were com-pared with both the National Health and Nutrition Examination Survey data and a matched subset based on age, gender, family income, and race/ethnicity (N= 252 analyzed food records).
RESULTS:Children with ASD and matched controls consumed similar amounts of nutrients from food. Only children with ASD aged 4 to 8 years consumed significantly less energy, vitamins A and C, and the mineral Zn; and those 9 to 11 years consumed less phosphorous. A greater percentage of children with ASD met recommendations for vitamins K and E. Few children in either group met the recommended intakes forfiber, choline, calcium, vitamin D, vitamin K, and potassium.
Specific age groups consumed excessive amounts of sodium, folate,
manganese, zinc, vitamin A (retinol), selenium, and copper. No differ-ences were observed in nutritional sufficiency of children given re-stricted diets. Children aged 2 to 5 years with ASD had more overweight and obesity, and children 5 to 11 years had more under-weight.
CONCLUSIONS:Children with ASD, like other children in America, con-sume less than the recommended amounts of certain nutrients from food. Primary care for all children should include nutritional surveil-lance and attention to BMI.Pediatrics2012;130:S145–S153
AUTHORS:Susan L. Hyman, MD,aPatricia A. Stewart, PhD,
RD,a,bBrianne Schmidt, RD,aUsa Cain, BA,cNicole Lemcke,
MS, RD,aJennifer T. Foley, BS,aRobin Peck, DT,bTraci
Clemons, PhD,dAnn Reynolds, MD,eCynthia Johnson, PhD,f,g
Benjamin Handen, PhD,gS. Jill James, PhD,hPatty Manning
Courtney, MD,iCynthia Molloy, MD, and Philip K. Ng, BSb
aDepartment of Pediatrics, University of Rochester Medical Center, Rochester, New York;bClinical and Translational Science Institute, University of Rochester School of Medicine, Rochester, New York;cBoston University School of Medicine, Boston, Massachusetts;dEMMES Corporation, Baltimore, Maryland; eDepartment of Pediatrics, University of Colorado School of Medicine, Denver, Colorado;fDepartments of Pediatrics and gDepartment of Psychiatry, University of Pittsburgh School of Medicine, Pittsburgh, Pennsylvania;hDepartment of Pediatrics, University of Arkansas for Medical Sciences, Little Rock, Arkansas; andiDepartment of Pediatrics, University of Cincinnati College of Medicine, Cincinnati, Ohio
KEY WORDS
autism, diet, nutrition, supplements
ABBREVIATIONS
AI—average intake
AMDR—acceptable macronutrient distribution range ASD—autism spectrum disorder
ATN—Autism Treatment Network DRI—daily recommended intake EAR—estimated average requirement NCI—National Cancer Institute
NDSR—Nutrition Data System for Research RDA—recommended daily allowance UL—upper limit
WWEIA—What We Eat In America
This manuscript has been read and approved by all authors. This article is unique and not under consideration by any other publication and has not been published elsewhere.
www.pediatrics.org/cgi/doi/10.1542/peds.2012-0900L
doi:10.1542/peds.2012-0900L
Accepted for publication Aug 8, 2012
Address correspondence to Susan Hyman, MD, 601 Elmwood Ave, Box 671, Rochester, NY 14642. E-mail: susan_hyman@urmc. rochester.edu
PEDIATRICS (ISSN Numbers: Print, 0031-4005; Online, 1098-4275).
Copyright © 2012 by the American Academy of Pediatrics
Children with autism spectrum dis-orders (ASDs) are reported to have food aversions and habitual eating behav-iors.1–5The authors of previous studies
have examined the nutritional intake of children with ASDs by using 3-day diet diaries,4–9 24-hour recalls,10food
frequency questionnaires,8,10–14 food
preference,15 and food variety
meas-ures.5,12,16 Compared with siblings,
children with ASDs ate a more limited variety of foods.3,16However, although
food variety was less,5,8,12,17no signifi
-cant difference in nutrition compared with typically developing controls was consistently identified.4,5,7,9,10,13,18 The
nutrients most commonly reported to
be consumed in insufficient amounts
includefiber, calcium, iron, and vitamins A, C, and D.6–8,10–13,17–19Vitamins E, K, B6,
B12, folic acid, and zinc have been found to be eaten in insufficient amounts in at least 1 study each.5–7,11–14,19,20Few
authors have examined the additional impact of restricted diets.19,21Conversely,
the limited yet repetitive intake of chil-dren with ASDs may place them at risk for nutritional excess.6,22 BMI (body
mass index) is only a gross indicator of nutrition status. Although children with ASDs are reported to have BMI in the typical range,23it does not
neces-sarily reflect nutrient sufficiency.
The methodology for dietary analysis of nutrient intake in individuals and pop-ulations has been outlined by the In-stitute of Medicine24but has not been
uniformly applied in dietary studies of children with ASDs.4,7,9,10,13,14,19,25 An
additional problem that impacts the interpretation of several studies in-volving children with ASDs is the use of nutritional analysis software with an incomplete database, which may un-derestimate nutrient intake thereby overestimating inadequacy.4,5,10 Other
studies used the recommended daily allowance (RDA) to measure nutrient adequacy. The RDA is the intake at which 97% to 98% of the population
exceeds their needs. Defining the RDA or a percentage of the RDA as in-sufficient also overestimates the prev-alence of deficiency.
This study was undertaken to charac-terize the nutritional intake of children with ASDs and assess the impact of reported food aversions and restricted diets. It is the largest sample of dietary intake and BMI status of children with ASDs collected and analyzed using current methodology. In this article, the diet and BMI of children with ASDs are compared with the general pedi-atric population by using the National
Health and Nutrition Examination
Survey (NHANES) data.26Accurate
un-derstanding of the unique nutritional risk of children with ASDs relative to other children is important to clini-cians who are responsible for nutri-tional surveillance in primary care and to parents who are concerned about the effects of limited or re-stricted diets.
METHODS
Sample
Children (2–11 years; N = 367) were
recruited between November 2009 and June 2011 from 5 participating Autism Treatment Network (ATN) sites. The ATN is a collaboration of 17 centers across North America funded by Autism Speaks and the Health Resources and Services Administration to establish and study the medical standard of care for individuals with ASDs.27Clinical
di-agnoses of ASDs are supported by the Diagnostic and Statistical Manual IV
criteria28 and the Autism Diagnostic
Observation Schedule.29 De-identified
health and behavioral data for partici-pating families who consented through institutional review board-approved protocols are submitted to a central database. Newly enrolled and existing ATN families were invited to participate in this study by the site ATN clinicians and study coordinators. Recruitment
was not based on concern about diet or feeding behavior.
Procedures
Height and weight were measured 3 times, and the 2 closest measurements were averaged. BMI and BMI percentile were calculated. History of the child’s dietary restrictions was collected. Total family income was endorsed by the family in the same incremental ranges as the NHANES.30
Parents completed a 3-day food re-cord containing all food, beverage, and supplements ingested by the child over 3 consecutive days including 1 weekend day. A registered dietitian or trained research assistant at each site used a standardized method to in-struct parents how to record intake. The importance of measurement, added ingredients, brands, and label claims was emphasized. The completed form was returned to the ATN site by mail, e-mail, or fax. Supplements, including any vitamins, minerals, botanicals, and amino acids, were recorded on a sep-arate form, which will be analyzed in a future publication. Meal replace-ments such as specialized formulas were analyzed as a food component and were included in this analysis. Die-titians at each site reviewed the records and contacted the parents for missing details. De-identified food records were sent to the University of Rochester for analysis.
Dietary intake data, the dependent var-iable, were determined from the 3-day food record by using Nutrition Data System for Research (NDSR) software versions 2009 and 2010, developed by
the Nutrition Coordinating Center
(University of Minnesota, Minneapolis, MN).31NDSR has an extensive food list
existing in the program so the total nutrient intake is not underestimated due to missing values. The NDSR anal-ysis was used to produce average nu-trient intakes for 160 nunu-trients.
Nutrition Variables
The estimated average requirement (EAR) is the average daily nutrient intake level estimated to meet the requirements of half of the healthy individuals in a group for nutrients for which an RDA is scientifically established. The cut point method, which reflects the proportion of individuals within a group with inadequate intake, was used to determine the percentage of individuals with intakes below the EAR.24
Because of its skewed requirement dis-tribution, the full probability approach was used to determine the prevalence of insufficient iron intake.32
The average intake (AI) is the recom-mended daily intake based on observed or experimentally determined approx-imations. It is used for nutrients where data are insufficient to establish an EAR. Intake levels above the AI imply a low prevalence of inadequate intake. State-ments regarding inadequacy cannot be made when intakes are below the AI. Therefore, the percentage of children with intakes greater than the AI was determined to reflect sufficiency for those nutrients.24
Tolerable upper limit (UL) is the highest recommended daily intake level of a nutrient likely to pose no risk of ad-verse health effects.24It is used to
as-sess the potential risk of excessive intake. The percentage of children with intakes greater than the UL from food alone was determined.
BMI status was categorized by using NHANES criteria:,5th percentile,
un-derweight; .85th percentile,
over-weight; and.95th percentile, obese. Data Analysis
The demographic data were summa-rized with descriptive statistics. To
obtain an estimate of usual (or long term) intake data from NDSR, data were adjusted for day to day variability by using the National Cancer Institute (NCI)
method.33,34 The NCI method models
Box-Cox–transformed 24-hour intake
observations as a function of observed
fixed-effect covariates, unobserved
individual-level random effects, and within-individual error. The covariates (sequence and weekend versus week-day) are “nuisance effects” that are explicitly adjusted for in the estimation of usual intake. Complete details of the NCI method and the SAS (SAS Institute Inc, Cary, NC) macros necessary tofit this model and to perform the Monte Carlo-based estimation of usual intake distributions can be found at the NCI Web site.34The adjusted nutrient intake
was then compared with age and gen-der appropriate daily recommended intake (DRI) to examine nutritional sufficiency as established by the In-stitute of Medicine Food and Nutrition Board.24The DRIs are a set of reference
values used to plan and assess nutri-ent intakes of healthy people and in-clude the RDA, EAR, AI, and ULs. One sample tests for proportions were used to compare the proportion of our population above or below the DRIs as compared with population-based
esti-mates.26All analyses were conducted
by using SAS version 9.1 (SAS Institute Inc).
The nutrient intake from diet was also compared with a general population of
children collected through NHANES.35
The NHANES is a continuous survey of
∼5000 people per year from 15
na-tionally representative communities. It surveys the health and nutritional status of adults and children in the United States by using a complex, strat-ified, multistage probability cluster sampling design. The NHANES analysis compared with the DRIs lags behind data collection. The most current micronu-trient dietary analysis available is from
the NHANES 2001–2002 What We Eat In
America (WWEIA).26A subset of nutrients
important to bone health (vitamin D, calcium, phosphorus, and magne-sium) was analyzed by using WWEIA 2005–2006.36To compare macronutrient
intake and BMI data from our sample with those from the general US pop-ulation, we selected comparison groups of boys and girls of similar age from NHANES 2007–2008.37,38
Participants in this study were matched on race, ethnicity, and income to the
NHANES30 participants because of the
potential impact of these factors on food choice.39In most cases, 2 matches
from the NHANES were found per study participant. The NHANES 2007–200837,38
was the most recently analyzed sample for BMI and macronutrients and was
used for comparison by t test for
continuous variables (nutrient intake) and byx2tests for categorical varia-bles (BMI category). We used PROC SURVEYMEANS and PROC SURVEYFREQ in SAS 9.1 and appropriate 4-year sample weights.
RESULTS
Participants in this study were 367
children with ASD (2–11 years); 295
completed and returned the 3-day food records. A total of 72 participants agreed to participate in the study, completed BMI and initial forms, but did not complete the 3-day food records. Three 3-day food records were not analyzed because of reported ill-ness in the recording interval. The nu-trition data are based on 252 records analyzed at the time of manuscript preparation. The demographics of the sample are described in Table 1.
Special Diets and Nutritional Supplement Use
Supplement use was defined as the use of vitamins, minerals, herbal, or botanical compounds and was repor-ted by 66% of study participants. This compared with 35% of children ages 2 to 13 years in the NHANES and 61% in a
national sample of children with chronic disease.40,41
BMI
Data on 362 participants were
com-pared with a matched NHANES (2007–
2008) population by BMI category (Table 2). The age ranges for the BMI data differ from the DRIs used in nu-trient analysis. Children with ASDs aged 2 to 5 years were more likely to be overweight (P,.05) or obese (P, .001) than the NHANES matched cohort. Among children aged 6 to 11 years, proportionately more children with ASDs were underweight than in the
NHANES matched cohort (P , .05).
Children on restricted diets were more likely to be underweight than those not on restricted diets (P= .02).
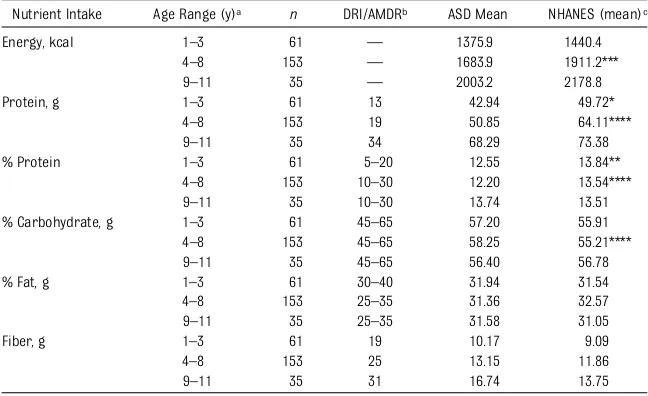
Macronutrient Intake
Children with ASDs (ages 4–8 years)
consumed less energy and lower centage of protein and greater per-centage of carbohydrates on average
than the NHANES (2007–2008) matched
sample.37 However, all macronutrient
intakes were within the acceptable
macronutrient distribution range
(AMDR) by age. No differences in mac-ronutrient consumption were found for children younger than 4 and older than 8 years of age (Table 3).
Micronutrients Examined by EAR Insufficient intake of vitamin D in chil-dren with ASDs was common with 87% of children younger than 4 years, 89% of those 4 to 8 years, and 79% of those 9 to 11 years below the EAR. There is no comparison group from the NHANES because the vitamin D intake from the
2005–2006 survey was analyzed as an
AI not an EAR. A greater percentage of the NHANES controls did not meet vi-tamin E recommendations although both groups had less than the recom-mended intake. Children with ASDs ages 4 to 8 years had lower reported intakes of vitamin A, vitamin C, and zinc compared with the NHANES controls. Children ages 9 to 11 years had lower levels of phosphorus intake. The per-centage of children with nutrient in-take less than the EAR increased with TABLE 1 Demographic Description of Study Population
Total ATN Subjects Age 2–11 y (n= 3360)
Total Number of Participants (n= 367)
Analyzed Food Records (n= 252)
By ATNasite, %
Little Rock NA 13 16
Denver NA 20 17
Pittsburgh NA 24 20
Cincinnati NA 18 19
Rochester NA 25 27
Characteristic
Age in years (SD) 5.17 (2.51) 5.37 (2.43) 5.58 (2.51)
Gender (% boys) 84 86 86
Race/ethnicitya
White 72 84 85
African American 6 5 5
Asian American 5 2 2
Other 6 3 3
Hispanic 10 6 15
Mean household income (SD)b
,$15K NA 5 5
$15–,$25K NA 9 8
$25–,$35K NA 9 10
$35–,$50K NA 19 19
$50–,$75K NA 19 19
$$75K NA 39 39
Primary caregiver educationc
Highest grade completed Less than high
school
4 2 1
High school 16 13 15
Some college, trade school
32 33 32
College degree 29 33 31
Post graduate 19 18 20
NA, not applicable.
aMissing forN= 50;N= 10; andN= 7, respectively. bMissing forN= 30 andN= 9, respectively. cMissing forN= 230;N= 29; andN= 18, respectively.
TABLE 2 BMI Data on 362 Children With ASDs Compared With NHANES 2007–2008
Age, 2–5 y Age, 6–11 y
ASD NHANES Matcheda ASD NHANES Matcheda
N 213 302 149 257
BMI category, %
Underweight (,5th%) 7 6 7 2*
Healthy weight (5th–85th%) 63 78* 66 64
Overweight (.85th–95th%) 16 7* 11 13
Obese (.95th%) 14 9** 16 21
*P,.001; **P,.05.
age for vitamins A, C, E, B12, and folate and the minerals zinc and magnesium (Table 4).
Micronutrients Examined by AI Consistent with the NHANES data, very few children with ASDs consumed
ade-quate fiber and potassium (Table 5).
There was no difference in the number
of nutrients consumed in sufficient
amounts, above the EAR/AI, for chil-dren in the different weight catego-ries. There was no difference in the number of nutrients consumed in ad-equate amounts by children with ASDs reported to be on restricted diets and those not on restricted diets (P= .55).
Excess Intake
Many children with ASDs had nutrient intakes above the UL from food alone such as copper, retinol (vitamin A), folic acid, zinc, and manganese (Table 6). Elevated intake of sodium was seen for all age groups studied and was greater in the NHANES control group than in the children with ASDs.
DISCUSSION
Our data, on a large, geographically diverse cohort of children with ASDs,
identified lower than recommended
intakes of vitamins A, D, and K, as well as calcium, choline,fiber, magnesium, phosphorus, and potassium from food
sources. These findings confirm
pre-vious reports of insufficient intake of calcium,fiber, zinc, and vitamins A, D, and K.6–8,10,11,13,14,17–19However, we did
notfind that children with ASDs
con-sumed insufficient iron, B6, B12, or
folic acid.6,7,11–14,19,20 Analysis of
Vita-min D intake was complicated by
re-cent changes in reference values,42
but over 3 quarters of the participants had vitamin D intakes below the EAR.
Of note, ,3% of children in the
NHANES 2005–2006 sample had
ade-quate vitamin D intake.36 Patterns of
insufficient nutrient consumption by
age were identified. Younger children with ASDs were less likely to have in-sufficient nutrient intake. This may be due to lower absolute requirements
and more parental control of foods offered to younger children.
To address the accuracy and reliability of the nutrient data in this study, we focused on 3 critical elements of study design: the tools used to collect intake data, the completeness of the nutrient analysis software, and the appropri-ateness of the DRI and statistical methods selected to interpret results.
Only 1 previous study8used both the
recommended statistical analyses to
assess insufficiency and nutritional
analysis software complete enough to provide accurate data. However, that study of 53 children with ASDs and 58 controls reported on a limited num-ber of nutrients. The careful collec-tion and analysis of the data on this ATN cohort provide for the most ac-curate description of what children with ASDs eat in the United States to date.
The use of a matched NHANES control group further expands upon previous work that compares the nutrition of children with ASDs to controls with typical development.4,8,10,12,15,18
Al-though many children with ASDs do not consume recommended levels of nutrient intake, this is consistent with intake of the general pediatric pop-ulation in the United States. Most families of children with ASDs can be counseled that although their child may not be consuming the recom-mended diet, they may not differ from children without ASDs in their nutritional intake. No general rec-ommendation for vitamin or mineral supplementation can be made based on the food intake data reported in this study. Specific nutrient supple-mentation should be based on in-dividual assessment.
Although the purpose of this study was to examine the nutrient intake from food in children with ASDs as a group, there were isolated children with very restricted diets. Some of these children TABLE 3 Mean Macronutrient Intake of Children With ASD Compared With NHANES 2007–2008
Matched Cohort
Nutrient Intake Age Range (y)a n DRI/AMDRb ASD Mean NHANES (mean)c
Energy, kcal 1–3 61 — 1375.9 1440.4
4–8 153 — 1683.9 1911.2***
9–11 35 — 2003.2 2178.8
Protein, g 1–3 61 13 42.94 49.72*
4–8 153 19 50.85 64.11****
9–11 35 34 68.29 73.38
% Protein 1–3 61 5–20 12.55 13.84**
4–8 153 10–30 12.20 13.54****
9–11 35 10–30 13.74 13.51
% Carbohydrate, g 1–3 61 45–65 57.20 55.91 4–8 153 45–65 58.25 55.21****
9–11 35 45–65 56.40 56.78
% Fat, g 1–3 61 30–40 31.94 31.54
4–8 153 25–35 31.36 32.57
9–11 35 25–35 31.58 31.05
Fiber, g 1–3 61 19 10.17 9.09
4–8 153 25 13.15 11.86
9–11 35 31 16.74 13.75
*P,.05; **P= .04; ***P= .001; ****P,.001.
aNine through 11 years age category includes boys only because there were too few girls in this age category for analysis. bAMDR is the range of intake for a particular energy source that is associated with reduced risk of chronic disease while providing intakes of essential nutrients. If an individual consumes in excess of the AMDR, there is a potential of increasing the risk of chronic diseases and/or insufficient intake of essential nutrients from other macronutrients.
were able to achieve nutrient adequacy and others were not. The fortification of foods commonly eaten by children may greatly impact their nutritional status.
Although food frequency questionnaires have been used to assess dietary ade-quacy, existing tools may not be appro-priate for studying the intake of children
with ASDs given their selective, repetitive intake.8,10–14
The risk for nutritional insufficiency of children on restricted diets remains an area of concern. Hediger et al21found
decreased bone cortical thickness in children following a casein-free diet. Decreased calcium intake was not reported by Cornish19in a very small
postal sample of children with ASDs on casein-free diets, however. Although
dairy products and fortified
gluten-containing products are an important
source of nutrients, we did not find
a greater number of nutrient deficits in children reported to be on special diets. The ATN data record all special diets as 1 category. Future analysis of these data will further examine this subset of children.
There is no consensus among previous studies comparing the BMI of children with ASDs and controls.5,11,12,16,43,44
Children with ASDs younger than 5 years of age are more frequently TABLE 4 Micronutrient Intake EAR Analysis of Children With ASDs Compared With WWEIA 2001–2002
Nutrient Age Range (y)a ASD (%,EAR) WWEIA (%,EAR)
Calciumb 1–3 85.8 NA
4–8 57.9 NA
9–13 29.0 NA
Copper 1–3 0.1 ,3
4–8 0.4 ,3
9–13 0.2 ,3
Dietary folate 1–3 2.7 ,3
Equivalents 4–8 2.7 ,3
9–13 4.9 ,3
Iron 1–3 0.2 ,3
4–8 0.5 ,3
9–13 0.2 ,3
Magnesiumc 1–3 0.1 ,3
4–8 2.3 ,3
9–13 18.1 22
Niacind 1–3 0.6 ,3
4–8 0.3 ,3
9–13 0.0 ,3
Phosphorusc 1–3 2.0 ,3
4–8 1.0 ,3
9–13 28.9 16*
Riboflavin 1–3 0.4 ,3
4–8 0.5 ,3
9–13 0.8 ,3
Selenium 1–3 0.0 ,3
4–8 0.1 ,3
9–13 0.0 ,3
Thiamine 1–3 0.4 ,3
4–8 0.2 ,3
9–13 0.2 ,3
Vitamin A 1–3 3.8 ,3
Retinol activity equivalents 4–8 9.1 4***
9–13 17.4 13
Vitamin B12 1–3 3.5 ,3
4–8 4.3 ,3
9–13 5.0 ,3
Vitamin B6 1–3 0.2 ,3
4–8 0.4 ,3
9–13 0.1 ,3
Vitamin C 1–3 2.4 ,3
4–8 8.2 ,3****
9–13 10.2 8
Vitamin Db 1–3 86.9 NA
4–8 89.2 NA
9–13 79.1 NA
Vitamin E 1–3 35.1 80****
4–8 42.0 80****
9–13 55.9 97****
Zinc 1–3 1.0 ,3
4–8 6.3 ,3**
9–13 8.4 ,3
NA, not applicable. *P= .04; **P= .02; ***P= .001; ****P,.001.
aNine through 11 years age category includes boys only because there were too few girls in this age category for analysis. bDRIs for calcium and vitamin D changed from AI to EAR. Appropriate comparison is not available.
cCompared with 2005–2006 WWEIA.
dReflects preformed niacin only and does not include contribution from tryptophan; therefore, there may be an over-estimated percentage below EAR.
TABLE 5 Micronutrient Intake AI Analysis of Children With ASDs Compared With WWEIA 2001–2002
Nutrient Age Range (y)a
ASD (%.AI)
WWEIA (%.AI)
Choline 1–3 30.2 NA 4–8 18.2 NA 9–13 5.5 NA
Fiber 1–3 2.4 ,3
4–8 1.3 ,3 9–13 1.6 ,3 Manganese 1–3 86.8 NA 4–8 86.3 NA 9–13 84.7 NA Pantothenic
acid
1–3 89.9 NA
4–8 66.0 NA 9–13 73.5 NA Potassium 1–3 1.9 6
4–8 0.1 ,3 9–13 0.0 ,3 Sodium 1–3 94.1 .97
4–8 97.2 .97 9–13 98.8 .97 Vitamin K 1–3 69.2 47** 4–8 21.1 14* 9–13 34.7 27 NA, not applicable. *P= .01; **P,.001.
overweight or obese. Underweight was more common for children with ASDs aged 6 to 11 years than for the NHANES controls. Preschool children with ASDs spend more time in therapeutic activi-ties, where snacks may be used to re-inforce participation, and where children may have less opportunity or interest in active play resulting in overweight. Chil-dren with typical development may have more autonomy in food choices and ac-cess to food when they reach school age.
Although BMI is an important indicator for healthy weight, it is not necessarily a good indicator of nutrient status. Among children with ASD, there was no differ-ence in the number of nutrients
con-sumed in insufficient amounts across
weight categories.
LIMITATIONS
Although this is the largest study of nutrient intake from food in children with ASDs to date, volunteers were predominantly white. It is possible that volunteers for this study who com-pleted the 3-day food record might have been either more concerned about their child’s nutrition or had children with more challenging behaviors. The nutritional data are only as good as the accuracy of the food record and the
completeness of nutrition analysis
software. This is true for NHANES as well. Despite our efforts, inaccuracies in recording and the database may still exist. Another limitation is the use of the DRIs, which were established for physi-cally healthy individuals with and with-out developmental disabilities. Whether these recommendations are applicable to children with ASDs is unknown and will require prospective study. Currently they are the best available estimate of nutrient needs of children.
This analysis was complicated by other issues affecting nutritional science in-cluding differences in units between the DRIs and food labels, the differences in bioavailability of fortified nutrients, and the changing and extensive fortification of foods. We attempted to address all of these concerns in the analysis. The comparison of micronutrients to the NHANES from 2001 to 2002 was neces-sary because this is the most recent
complete NHANES/DRI comparison
available although BMI and macro-nutrients were compared with data
from 2007 to 2008. Specific analyses
were matched by age categories; however, there were not enough girls in
the oldest age category to allow for analysis of this group.
SPECIFIC RECOMMENDATIONS AND CONCLUSIONS
The data from this study have several implications. The results indicate the importance of nutritional surveillance in primary care for all children, not just children with ASDs. The rate of nutri-tional insufficiency is noteworthy in both the children with ASDs and the NHANES controls. Although there is not a simple nutrition screening tool available for children with ASDs at this time, clinicians should obtain a history of mealtime behavior and dietary intake in the context of well child care.45
Al-though a varied diet is typically associ-ated with better nutrition, fortification of foods given to children in this age range may allow a less varied diet to meet most nutrient needs. Just because a child with ASDs has a limited variety does not mean that he or she needs additional vitamins or a food supplement. Dietary assess-ment needs to be considered individually, corroborated with anthropometric and laboratory data, and include consider-ation of referral to a registered dietitian as necessary.
ACKNOWLEDGMENTS
We thank Nellie Wixom, RD, for her as-sistance in data management; Diana Fernandez, MD, MPH, PhD, Stephen Cook, MD, MPH, Peggy Auinger, MS, and Alanna Moshfegh, MS, RD, for their advice; and the Cornell Dietetic Interns for help with literature review. We thank Harriet Austin, PhD, Dana Barvinchak, Terri Mitchell, Margaret Pauly, MS, RD, LD, Erin Bailey, Esther Hsueh, Dave Maloney, Ann C. Meyers, MS, RD, LDN, Mindy Reagan, RD, LD, and Nikki Withrow, MS, RD for their tireless work with the families. We acknowledge the Autism Treatment Network for use of the data, and we thank the families who partici-pated in the registry.
TABLE 6 Intake Above the UL for
Micronutrients in Children With ASDs Compared With WWEIA 2001–2002
Nutrient Age Range (y)a ASD
(%.UL) WWEIA (%.UL)
Calcium 1–3 0.1 ,3 4–8 0.1 ,3 9–13 0.2 NA Copper 1–3 13.0 15 4–8 0.0 ,3 9–13 0.0 ,3 Folic Acid 1–3 7.3 5 (Synthetic) 4–8 7.3 4* 9–13 3.1 ,3
Iron 1–3 0.0 ,3
4–8 0.1 ,3 9–13 0.0 ,3 Manganese 1–3 39.9 NA 4–8 20.3 NA 9–13 2.5 NA Phosphorus 1–3 0.0 ,3 4–8 0.0 ,3 9–13 0.0 ,3 Selenium 1–3 7.1 8
4–8 0.4 ,3 9–13 0.0 ,3 Sodium 1–3 65.1 83***
4–8 70.6 94*** 9–13 86.7 .97*** Vitamin A 1–3 29.8 12*** (Retinol) 4–8 9.0 ,3*** 9–13 0.2 ,3 Vitamin B6 1–3 0.0 ,3
4–8 0.0 ,3 9–13 0.0 ,3 Vitamin C 1–3 0.7 ,3 4–8 0.0 ,3 9–13 0.0 ,3 Vitamin D 1–3 0.0 NA 4–8 0.0 NA 9–13 0.0 NA Zinc 1–3 40.9 69***
REFERENCES
1. Bennetto L, Kuschner ES, Hyman SL. Olfac-tion and taste processing in autism.Biol Psychiatry. 2007;62(9):1015–1021
2. Valicenti-McDermott M, McVicar K, Rapin I, Wershil BK, Cohen H, Shinnar S. Frequency of gastrointestinal symptoms in children with autistic spectrum disorders and as-sociation with family history of autoim-mune disease.J Dev Behav Pediatr. 2006;27 (suppl 2):S128–S136
3. Schreck KA, Williams K, Smith AF. A com-parison of eating behaviors between chil-dren with and without autism.J Autism Dev Disord. 2004;34(4):433–438
4. Lockner DW, Crowe TK, Skipper BJ. Dietary intake and parents’perception of mealtime behaviors in preschool-age children with autism spectrum disorder and in typically developing children.J Am Diet Assoc. 2008; 108(8):1360–1363
5. Schmitt L, Heiss CJ, Campbell EE. A com-parison of nutrient intake and eating behaviors of boys with and without autism. Topics Clin Nutr. 2008;23(1):23–31 doi: 10.1097/1001.TIN.0000312077.0000345953. 0000312076c
6. Xia W, Zhou Y, Sun C, Wang J, Wu L. A pre-liminary study on nutritional status and intake in Chinese children with autism.Eur J Pediatr. 2010;169(10):1201–1206
7. Herndon AC, DiGuiseppi C, Johnson SL, Leiferman J, Reynolds A. Does nutritional intake differ between children with autism spectrum disorders and children with typical development?J Autism Dev Disord. 2009;39(2):212–222
8. Bandini LG, Anderson SE, Curtin C, et al. Food selectivity in children with autism spectrum disorders and typically de-veloping children. J Pediatr. 2010;157(2): 259–264
9. Levy SE, Souders MC, Ittenbach RF, Giarelli E, Mulberg AE, Pinto-Martin JA. Relation-ship of dietary intake to gastrointestinal symptoms in children with autistic spec-trum disorders.Biol Psychiatry. 2007;61(4): 492–497
10. Johnson CR, Handen BL, Mayer-Costa M, Sacco K. Eating habits and dietary status in young children with autism. J Dev Phys Disabil. 2008;20:437–448
11. Lindsay RL, Eugene Arnold L, Aman MG, et al. Dietary status and impact of risper-idone on nutritional balance in children with autism: a pilot study. J Intellect Dev Disabil. 2006;31(4):204–209
12. Emond A, Emmett P, Steer C, Golding J. Feeding symptoms, dietary patterns, and growth in young children with autism
spectrum disorders. Pediatrics. 2010;126 (2). Available at: www.pediatrics.org/cgi/ content/full/126/2/e337
13. Zimmer MH, Hart LC, Manning-Courtney P, Murray DS, Bing NM, Summer S. Food va-riety as a predictor of nutritional status among children with autism.J Autism Dev Disord. 2012;42(4):549–556
14. Cornish E. A balanced approach towards healthy eating in autism.J Hum Nutr Diet. 1998;11(6):501–509
15. Schreck KA, Williams K. Food preferences and factors influencing food selectivity for children with autism spectrum disorders. Res Dev Disabil. 2006;27(4):353–363
16. Berlin KS, Lobato DJ, Pinkos B, Cerezo CS, LeLeiko NS. Patterns of medical and de-velopmental comorbidities among children presenting with feeding problems: a latent class analysis.J Dev Behav Pediatr. 2011;32 (1):41–47
17. Ho HH, Eaves LC, Peabody D. Nutrient intake and obesity in children with autism.Focus Autism Other Dev Disabl. 1997;12(3):187–192
18. Raiten DJ, Massaro T. Perspectives on the nutritional ecology of autistic children. J Autism Dev Disord. 1986;16(2):133–143
19. Cornish E. Gluten and casein free diets in au-tism: a study of the effects on food choice and nutrition.J Hum Nutr Diet. 2002;15(4):261–269
20. Dosman CF, Drmic IE, Brian JA, et al. Ferritin as an indicator of suspected iron deficiency in children with autism spectrum disorder: prevalence of low serum ferritin concen-tration.Dev Med Child Neurol. 2006;48(12): 1008–1009
21. Hediger ML, England LJ, Molloy CA, Yu KF, Manning-Courtney P, Mills JL. Reduced bone cortical thickness in boys with autism or autism spectrum disorder.J Autism Dev Disord. 2008;38(5):848–856
22. Bailey RL, McDowell MA, Dodd KW, Gahche JJ, Dwyer JT, Picciano MF. Total folate and folic acid intakes from foods and dietary supplements of US children aged 1–13 y. Am J Clin Nutr. 2010;92(2):353–358
23. Curtin C, Anderson SE, Must A, Bandini L. The prevalence of obesity in children with autism: a secondary data analysis using nationally representative data from the National Survey of Children’s Health.BMC Pediatr. 2010;10:11
24. Institute of Medicine. Dietary Reference Intakes: Applications and Dietary Assessment. Washington, DC: National Academy Press; 2000
25. Dosman CF, Brian JA, Drmic IE, et al. Chil-dren with autism: effect of iron supple-mentation on sleep and ferritin. Pediatr Neurol. 2007;36(3):152–158
26. Moshfegh A, Goldman J, Clevelan L. What we eat in America, NHANES 2001–2002: Usual nutrient intakes from food compared to di-etary reference intakes. US Department of Agriculture, Agricultural Research Service. Available at: www.ars.usda.gov/SP2UserFiles/ Place/12355000/pdf/0102/usualintaketables2001-02.pdf. Accessed August 22, 2012
27. Coury D, Jones NE, Klatka K, Winklosky B, Perrin JM. Healthcare for children with autism: the Autism Treatment Network. Curr Opin Pediatr. 2009;21(6):828–832
28. American Psychiatric Association.Diagnostic and Statistical Manual of Mental Disorders, 4th ed. Washington, DC: American Psychiat-ric Association; 1994
29. Lord C, Rutter M, DiLavore P, Risi S.Autism Diagnostic Observation Schedule. Los Angeles, CA: Western Psych Corp; 1999
30. Centers for Disease Control and Prevention. The National Health and Nutrition Examina-tion Survey (NHANES): analytic and report-ing guidelines. Available at: www.cdc.gov/ nchs/data/nhanes/nhanes_03_04/nhanes_ analytic_guidelines_dec_2005.pdf. Accessed August 22, 2012
31. Schakel S. Maintaining a nutrient database in a changing marketplace: keeping pace with changing food products—a research perspective.J Food Compost Anal. 2001;14: 315–322
32. Murphy SP, White KK, Park S-Y, Sharma S. Multivitamin-multimineral supplements’ ef-fect on total nutrient intake.Am J Clin Nutr. 2007;85(1):280S–284S
33. Tooze JA, Kipnis V, Buckman DW, et al. A mixed-effects model approach for estimat-ing the distribution of usual intake of nutrients: the NCI method.Stat Med. 2010; 29(27):2857–2868
34. National Cancer Institute. Usual dietary intakes: food intakes, US population, 2001– 2004. Available at: http://riskfactor.cancer.gov/ diet/usualintakes/pop/. Accessed August 22, 2012
35. US Department of Health and Human Services, Centers for Disease Control and Prevention. National Health and Nutrition Examination Survey Data. Available at: www.cdc.gov/nchs/ nhanes/nhanes_questionnaires.htm. Accessed August 22, 2012
vitD_ca_phos_mg_2005-06.pdf. Accessed August 22, 2012
37. US Department of Agriculture, Agricultural Research Service. Nutrient intakes from food: mean amounts consumed per in-dividual, by race/ethnicity and age, what we eat in America, NHANES 2007–2008. Available at: www.ars.usda.gov/ba/bhnrc/ fsrg. Accessed August 22, 2012
38. Centers for Disease Control and Pre-vention. National Health and Nutrition Ex-amination Survey, 2007–2008 examination files, body measure. www.cdc.gov/nchs/ nhanes/nhanes2007-2008/exam07_08.htm. Accessed August 22, 2012
39. Wang Y, Chen X. How much of racial/ethnic disparities in dietary intakes, exercise, and
weight status can be explained by nutri-tion- and health-related psychosocial fac-tors and socioeconomic status among US adults? J Am Diet Assoc. 2011;111(12): 1904–1911
40. Ball SD, Kertesz D, Moyer-Mileur LJ. Dietary supplement use is prevalent among chil-dren with a chronic illness. J Am Diet Assoc. 2005;105(1):78–84
41. Picciano MF, Dwyer JT, Radimer KL, et al Dietary supplement use among infants, children, and adolescents in the United States, 1999–2002. Arch Pediatr Adolesc Med. 2007;161(10):978–985
42. Holick MF, Binkley NC, Bischoff-Ferrari HA, et al Evaluation, treatment, and prevention of vitamin d deficiency: an endocrine
soci-ety clinical practice guideline.J Clin Endo-crinol Metab. 2011;96(7):1911–1930
43. Hendy HM, Williams KE, Riegel K, Paul C. Parent mealtime actions that mediate associations between children’s fussy-eating and their weight and diet.Appetite. 2010;54(1):191–195
44. Curtin C, Bandini LG, Perrin EC, Tybor DJ, Must A. Prevalence of overweight in chil-dren and adolescents with attention deficit hyperactivity disorder and autism spec-trum disorders: a chart review. BMC Pediatr. 2005;5:48
DOI: 10.1542/peds.2012-0900L
2012;130;S145
Pediatrics
K. Ng
Benjamin Handen, S. Jill James, Patty Manning Courtney, Cynthia Molloy and Philip
Jennifer T. Foley, Robin Peck, Traci Clemons, Ann Reynolds, Cynthia Johnson,
Susan L. Hyman, Patricia A. Stewart, Brianne Schmidt, Usa Cain, Nicole Lemcke,
Nutrient Intake From Food in Children With Autism
Services
Updated Information &
http://pediatrics.aappublications.org/content/130/Supplement_2/S145
including high resolution figures, can be found at:
References
#BIBL
http://pediatrics.aappublications.org/content/130/Supplement_2/S145
This article cites 34 articles, 3 of which you can access for free at:
Subspecialty Collections
http://www.aappublications.org/cgi/collection/autism:asd_sub
Autism/ASD
al_issues_sub
http://www.aappublications.org/cgi/collection/development:behavior
Developmental/Behavioral Pediatrics following collection(s):
This article, along with others on similar topics, appears in the
Permissions & Licensing
http://www.aappublications.org/site/misc/Permissions.xhtml
in its entirety can be found online at:
Information about reproducing this article in parts (figures, tables) or
Reprints
http://www.aappublications.org/site/misc/reprints.xhtml
DOI: 10.1542/peds.2012-0900L
2012;130;S145
Pediatrics
K. Ng
Benjamin Handen, S. Jill James, Patty Manning Courtney, Cynthia Molloy and Philip
Jennifer T. Foley, Robin Peck, Traci Clemons, Ann Reynolds, Cynthia Johnson,
http://pediatrics.aappublications.org/content/130/Supplement_2/S145
located on the World Wide Web at:
The online version of this article, along with updated information and services, is
by the American Academy of Pediatrics. All rights reserved. Print ISSN: 1073-0397.