630 |
P a g e
MEAN SQUARED KERNEL INDUCED FUZZY
POSSIBILISTIC C-MEANS: AN ANALYZING HIGH
DIMENSIONAL DATABASE
S. R. Kannan
Department of Mathematics, Pondicherry University, (India)
ABSTRACT
In order to find an available subgroups in real life databases this paper presents effective fuzzy c-means by incorporating the membership function of fuzzy c-means, the typicality of possibilistic c-means approaches, mean squared kernel induced distance. To show the effectiveness of the proposed method this paper successfully implements the proposed method with synthetic dataset and it shows the superiority of the proposed method through clustering accuracy.
Keywords: Data Analysis, Fuzzy C-Means, Mean Squared Distance
1. INTRODUCTION
There are many mathematical assisted methods recently have been applied to find an available subgroups in
high dimensional data [11]. Very recently clustering techniques [1, 6, 8, 14] have been used for finding available
subgroups in complex high dimensional data. Clustering[3] involves the task of dividing data points into
homogeneous classes or clusters so that items in the same class are as similar as possible and items in different
classes are as dissimilar as possible [7, 15]. The fuzzy c-means clustering (FCM) algorithm has recently been
applied to clustering the high dimensional real life related databases [4]. Though fuzzy c-means [5] works well
in clustering the noise free database, it has considerable drawbacks in clustering the database which have noise
and outliers. Furthermore, results in the above said studies have been inconsistent to clearly differentiate the
data objects into appropriate clusters, and none has given importance to reduce the computational time, and the
selection of blindness prototypes by random manner. The blindness of random prototype initialization in existed
fuzzy c-means leads the clustering process as a time consuming task. Hence, in order to cluster effectively the
objects which have similar expression patterns in high dimensional databases into different available subgroups,
this paper proposes effective normed kernel distance based fuzzy clustering algorithms in the combination of
both fuzzy membership function and typicality of possibilistic c-means. The combination of Possibility with
fuzzy clustering has been successfully implemented to cluster the unlabeled data of real life problems by many
researches [9, 13]. Here the typicality values are constrained and the sum of the overall data points of
631 |
P a g e
induced distance to evaluate the relations between cluster prototypes and data objects. The kernel induceddistance helps to have higher dimensional feature space from original pattern space in order to obtain strong
membership for a cluster. The new novel approach has implemented with synthetic database.
The rest of this paper is organized as follows. In Section 2, this paper briefs the basic fuzzy c-means. Section 3
describes about Proposed Fuzzy C-Means algorithm. The experimental results on Synthetic Dataset are reported
in Section 4. Finally, conclusion is presented in Section 5.
II. FUZZY C-MEAN ALGORITHM
Fuzzy C-Means discovers soft clusters where a particular point can belong to more than one cluster with certain
membership. The objective of the algorithm is to find the subgroups into the data so that the similarity of data
objects within each subgroup is very higher. The functional of the Fuzzy C-Means Algorithm has three
independent variables, U the membership matrix, Xthe data space and the vector of prototypes V. Fuzzy C-Means [2] is based on minimization of the following objective function:
n k c i i k m ikFCM
U
V
u
x
v
J
1 1 2)
,
(
,
Where m is the weighting parameter greater than 1,
u
ik is the partition matrix. The partitioning and centre updating equations are:
mn k ik n k k m ik i
u
x
u
v
1 1The algorithm is composed of the following steps
Step1:
(i) Set the cluster centre
(ii) Set the fuzzification parameter
(iii)Set the random partition
Step2:
Obtain partition matrix U, using
1 1 1 1 2 2
cj m j k i k ik
v
x
v
x
u
Step3
:
1 1 1 1 2 2
c632 |
P a g e
Update the cluster centre using
mn k ik n k k m ik i
u
x
u
v
1 1Step 4:
If
U
t1
U
t
then stop the algorithm or go to step 2.
III. MEAN SQUARED DISTANCE KERNEL FUNCTION BASED FUZZY POSSIBILISTIC
C-MEANS [MSFPCM]
This paper incorporates fuzziness weighting exponent, the expression of possibilistic typical weighting exponent
(
) and means squared kernel induced distance with the objective of proposed fuzzy c-means. The proposed objective function of Fuzzy Possibilistic C-Means is given by
k i
n k c i ik mik K x v
u V
U
J , 2 ,
1 1
where
n v x v x
K k i
i k
2
|| ||
,
(1)
The proposed partition matrix in an objective function satisfies the following conditions:
, 1
0uik
for 1≤i≤c,1≤k≤n,
, 0 1 n u n k ik
for 1≤i≤c,
n k ik 11
for 1≤i≤c. (2)
n in (1) is number of objects, and
is parameter. The weighting exponents compute the amount of fuzziness in the resulting classification in order to obtain proper center of cluster.Minimizing the proposed objective function in equation (1) with respect to
u
ik,
ik, andv
i, we have obtain ageneralized membership equations
u
ik and typicality
ik for the iterative solution of an objective function. The general iterative Membership and typicality value updating equation is as:633 |
P a g e
N
l l i
i k ik v x K v x K 1 1 1 1 1 , 1 , 1
(4)
The general center updating equation is as:
01
n i i k ik m ik n v x u
N i ik m ik N i i ik m ik i u x u v 1 1
(5)
IV. EXPERIMENTAL RESULTS ON ARTIFICIAL IMAGE
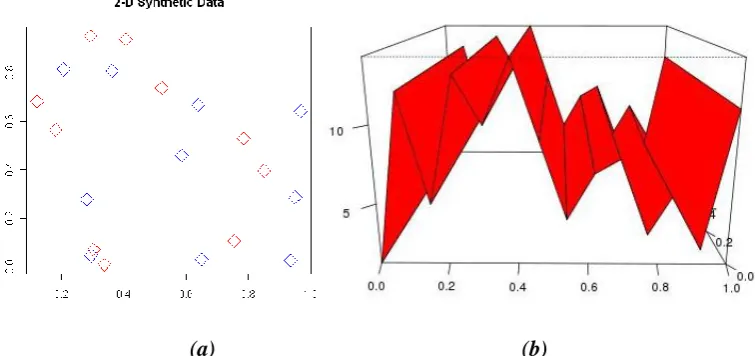
This subsection describes the experimental results on artificial image which is generated by random data given
in Fig. 1. There are two algorithms used in this section, i.e., FPCM [12], and MSFPCM for showing the
performance of proposed method. First experiment of this paper introduces the FPCM algorithm to an artificial
image which is generated by random data in Fig. 1. The artificial image includes two classes is given in Fig.
1(a-b). The results of standard FPCM are given in Table 1 and in Fig. 2. Table 1 lists the memberships obtained for
each object in final iteration of standard FPCM. Fig. 2 gives the clustering result of FPCM. The FPCM takes 28
iterations to termination condition.
(a)
(b)
634 |
P a g e
Fig. 2: Result by FPCM
Table1. Memberships of Final Iteration of Standard FPCM
Membership
for cluster 1 Belonging
Membership
for cluster 2 Belonging Object
0.444489 Cluster 2 0.555511 Cluster 2 1
0.505239 Cluster 1 0.494761 Cluster 1 2
0.417151 Cluster 2 0.582849 Cluster 2 3
0.465711 Cluster 2 0.534289 Cluster 2 4
0.415176 Cluster 2 0.584824 Cluster 2 5
0.501166 Cluster 1 0.498834 Cluster 1 6
0.574661 Cluster 2 0.425339 Cluster 2 7
0.416436 Cluster 2 0.583564 Cluster 2 8
0.633863 Cluster 1 0.366137 Cluster 1 9
0.501074 Cluster 1 0.498926 Cluster 1 11
0.597672 Cluster 1 0.402338 Cluster 1 12
0.600000 Cluster 1 0.400000 Cluster 1 13
0.537437 Cluster 1 0.462563 Cluster 1 14
635 |
P a g e
Now this paper introduces the proposed MSFPCM to cluster the artificial image into two clusters in order to testits effect on performance. Fig. 3 shows the results of MSFPCM on synthetic image. It is observed from Fig. 3
that the MSFPCM reduces the misclassification in ordering the objects into two clusters based on the intensities
of objects, and it achieves better memberships to the objects for a particular cluster than FPCM which are listed
in Table 2. Table 2 compares clustering centres to the average value of points corresponding to each cluster, and
it is found that the average value of points are almost close to the centres obtained by MSFPCM. The algorithm
obtains the results after five iterations of the algorithm.
Fig.3 Image by MSFPCM
Table.2 Memberships of Final Iteration of MSFPCM
Membership
for cluster 1 Belonging
Membership
for cluster 2 Belonging Object
0.997561 Cluster 1 0.002439 Cluster 1 1
0.984777 Cluster 1 0.015223 Cluster 1 2
0.970592 Cluster 1 0.029408 Cluster 1 3 0.927684 Cluster 1 0.072316 Cluster 1 4
0.979993 Cluster 1 0.020007 Cluster 1 5 0.999689 Cluster 1 0.000311 Cluster 1 6 0.010525 Cluster 2 0.989475 Cluster 2 7
636 |
P a g e
0.979724 Cluster 1 0.020276 Cluster 1 9 0.988386 Cluster 1 0.011614 Cluster 1 11 0.010660 Cluster 2 0.989340 Cluster 2 12
0.000066 Cluster 2 0.999934 Cluster 2 13
0.020064 Cluster 2 0.979936 Cluster 2 14 0.998899 Cluster 1 0.001101 Cluster 1 15
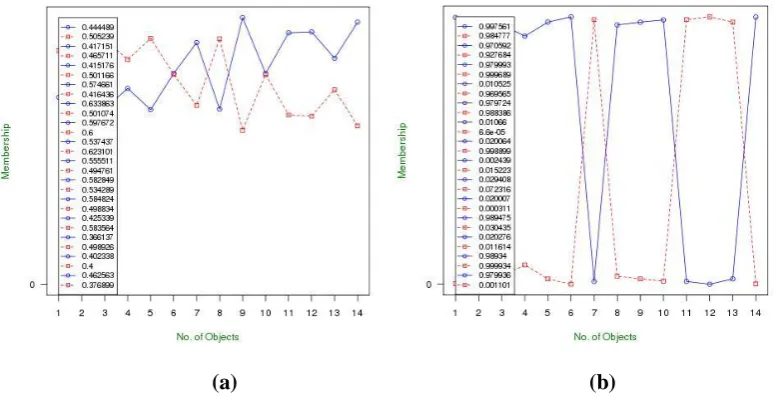
This paper has shown that the proposed methods have been converged the termination value within few
numbers of iterations, and FPCM has taken large number of iterations to converge the termination value from
Table 3. In order to evaluate the effect of membership equation of proposed method in obtaining memberships
to objects on clustering data into appropriate clusters, the resulted memberships of this experimental study on
synthetic image given in Fig. 4 (a-b). It is observed from Fig. 4(a) that there is no wide difference between the
memberships of the objects between the first and second clusters, it is because of poor distance measure of
FPCM. From Fig. 4(b) it is observed that the proposed methods have wide difference in between the
membership values for the objects for first and second clusters.
(a) (b)
Fig. 4 Comparison of membership (a) by FPCM (b) by MSFPCM
Finally Table 3 shows the comparison of the number of iteration, running time, and clustering accuracy during
the experiment of FPCM, and MSFPCM on synthetic image. The FPCM takes 14 iterations to complete the
experimental work on synthetic image for clustering it into two partitions, but the proposed method has taken
637 |
P a g e
method gives better clustering results, clustering accuracy [10], and high memberships for clustering the datainto two groups. Further the proposed methods require less running time, and less number of iterations to
complete the experimental works.
Table3. Comparison of Iteration Count, Running Time and clustering accuracy
No. of Iterations No. of clusters
Running Time
Clustering
Accuracy
FPCM
21
2
28 Seconds
57%
MSFPCM
5
2
5 Seconds
98.5%
From the results on synthetic image, this paper proves the impact of proposed method via convergence speed of
optimal centers, number of iterations, accuracy of clustering results and visual inspection of separation of
clusters by the method, that the proposed method can have more capable to cluster the similar expression of
genes in colon cancer database.
V. CONCLUSION
This paper has proposed effective clustering technique based on the membership function of fuzzy
c-means, the typicality of possibilistic c-means approaches, and normed kernel induced distance, for
finding subgroups in databases. In order to establish the effectiveness of the proposed method, this
paper demonstrated experimental works on Synthetic dataset. This paper has reported the superiority
of the proposed methods through cluster validation using silhouette accuracy, running time, number of
iterations and well separated clusters.
REFERENCES
1. Alon. U et al., Broad patterns of gene expression revealed by clustering analysis of tumor and normal colon
tissues probed by oligonucleotide arrays, Proc. Natl. Acad. Sci. USA 96 (1999) 6745–6750.
2. Bezdek J.C., Pattern Recognition with Fuzzy Objective Function Algorithms. Plenum Press, New York,
(1981).
3. Hartigan, J.A. (1975) Clustering Algorithms. Wiley, NewYork.
4. .Hui-Ling Chen, Bo Yang, Jie Liu, Da-You Liu, A support vector machine classifier with rough set-based
feature selection for breast cancer diagnosis, Expert Systems with Applications 38 (2011) 9014–9022.
5. Kanzawa, Y. Endo, Y. Miyamoto, S., Fuzzy classification function of entropy regularized fuzzy c-means algorithm for data with tolerance using kernel function, page 350-355, Granular Computing, 2008. GrC
2008, IEEE Xplore
6. Mclachlan G.J et al.,A mixture model based approach to the clustering of micro-array expression data, Bio
638 |
P a g e
7. Rasha Kashef et al., Cooperativeclustering, Pattern Recognition, Pattern Recognition 43 (2010) 2315–2329.8. Riccardo De Binet al., A novel approach to the clustering of microarray data via nonparametric density
estimation, BMC Bioinformatics 2011, doi:10.1186/1471-2105-12-49.
9. Renato Coppi et al., Fuzzy and possibilistic clustering for fuzzy data, Computational Statistics & Data
Analysis, Volume 56, Issue 4, 1 April 2012, Pages 915-927.
10. Rousseeuw PJ (1987). Silhouettes: a Graphical Aid to the Interpretation and Validation of Cluster Analysis.
Journal of Computational and Applied Mathematics, 20, 53-65.
11. Thomas, R., Thieffry, D., Kaufman, M.: Dynamical behaviour of biological regulatory networks - I. Bull.
Math. Biol. 57 (1995) 247–76 17.
12. Vanisri et al., An Efficient Fuzzy Possibilistic C-Means with Penalized and Compensated Constraints,
Volume Issue Version 1.0 March 2011, Global Journal of Computer Science and Technology
13. William-Chandra Tjhi, Lihui Chen, Possibilistic fuzzy co-clustering of large document collections Pattern
Recognition, Volume 40, Issue 12, December 2007, Pages 3452-3466
Z. Yu, H.S. Wong, H. Wang, Graph based consensus clustering for class discovery from gene expression
data, Bioinformatics 23 (21) (2007) 2888–2896