O R I G I N A L R E S E A R C H
The Relationship Between Fasting Blood Glucose
Levels and First Ischemic Stroke in Elderly
Hypertensive Patients
This article was published in the following Dove Press journal: Risk Management and Healthcare Policy
Yu-qing Huang1,* Kenneth Lo 1,* Xiao-cong Liu 1 Song-tao Tang2 Cheng Huang1 Ying-qing Feng 1
1Department of Cardiology, Guangdong
Cardiovascular Center, Guangdong Cardiovascular Institute, Guangdong Provincial People’s Hospital, Guangdong Academy of Medical Sciences, School of Medicine, South China University of Technology, Guangzhou, People’s Republic of China;2Department of Internal Medicine, Community Health Center of Liaobu County, Dongguan, People’s Republic of China
*These authors contributed equally to this work
Objective:The relationship between fasting blood glucose andfirst ischemic stroke in older adults was unclear, so we explored this association among older patients with hypertension in China.
Methods: We recruited hypertensive participants with 60 or more of age. Fasting blood glucose concentrations were categorized into quartiles. Hazard ratio (HR) and 95%
con-fidence interval (CI) for ischemic stroke were estimated using multivariate Cox regression analysis and subgroup analysis.
Results:A total of 3310 (1474 (44.53%) male) patients with mean age of 71.41±7.20 years were included. During the mean follow-up period of 5.5 years, 206 cases of ischemic stroke occurred. After adjusting for potential confounding variables, multivariate adjusted HRs for each standard deviation increment of fasting blood glucose, the risk of ischemic stroke increased by 11% (95% CI: 1.03, 1.21; P= 0.008). In addition, when using the lowest group (Q1) as reference, the multivariate adjusted HRs forfirst ischemic stroke were 1.76 (95% CI: 1.08, 2.86; P=0.023), 1.73 (95% CI: 1.06, 2.81; P=0.027) and 2.42 (95% CI: 1.49, 3.93; P<0.001) (P for trend<0.001). Subgroup analysis revealed that the association between fasting blood glucose and the risk of ischemic stroke was higher in male (HR: 1.22 vs 1.10), those with uncontrolled hypertension (HR: 1.22 vs 1.10), subjects with diabetes (HR: 1.19 vs 1.10), overweight (HR: 1.19 vs 1.09), smoking habits (HR: 1.33 vs 1.13) and those whose eGFR< 90 (HR: 1.16 vs 1.09).
Conclusion: Fasting blood glucose was an independent risk factor for thefirst ischemic stroke among older adults with hypertension. Managing fasting blood glucose may be beneficial for participants with diabetes, poorly controlled blood pressure, had smoking habits, being overweight, and with reduced renal function.
Keywords:fasting blood glucose, ischemic stroke, elderly, hypertension, community
Introduction
Stroke is the main cause of death in China,1with ischemic stroke to be the most common subtype.2Ischemic stroke is a type of arteriosclerotic disease and a hetero-geneous disease.3 Studies have shown that elevated blood pressure, age, obesity, smoking, hyperlipidemia, impaired fasting glucose, elevated fasting blood glucose (FBG), diabetes and hyperglycemia were independent risk factors for ischemic stroke.3 Although previous studies have reported significant associations between FBG and arteriosclerotic cardiovascular disease,4–7the relationship between FBG and ischemic stroke was still controversial. Some studies reported that the relationship between
Correspondence: Ying-qing Feng; Cheng Huang
Department of Cardiology, Guangdong Cardiovascular Center, Guangdong Cardiovascular Institute, Guangdong Provincial People’s Hospital, Guangdong Academy of Medical Sciences, School of Medicine, South China University of Technology, Guangzhou 510080, People’s Republic of China
Tel/Fax +86-20-83827812 Email 651792209@qq.com; linfeng7822@sina.com
Risk Management and Healthcare Policy
Dove
press
open access to scientific and medical research
Open Access Full Text Article
Risk Management and Healthcare Policy downloaded from https://www.dovepress.com/ by 118.70.13.36 on 28-Aug-2020
stroke and FBG was linear, U-shaped or J-shaped among general population,8asymptomatic adults,9patients with pre-existing atherothrombotic diseases,10 or non-diabetic population.6,11In addition, there was a study demonstrated that FBG had no null association with the risk of cardiovas-cular diseases, such as coronary heart disease and ischemic stroke in hypertensive patients.12Given the inconsistent rela-tionship between fasting blood glucose and first ischemic stroke in older adults with hypertension, we explored the association among older hypertensive patients with hyperten-sion in China.
Materials and Methods
Study Subjects
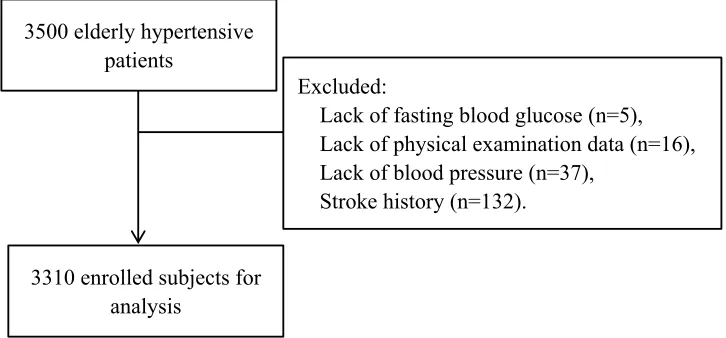
This retrospective cohort study enrolled 3500 older patients from January, 2010, to December, 2011, at Guangdong community in China. We recruited essential hypertensive patients who were at least 60 years of age. We excluded participants with missing data on blood pressure (n=37), FBG (n=5) or physical examination (n=16), and those who had a stroke history at baseline (n=132). Eventually, 3310 participants were included for data analysis (Figure 1). Informed consent was obtained from all included participants. This study was in compli-ance with the principles outlined in the Declaration of Helsinki and was approved by the institutional medical ethical committee the Guangdong Provincial People’s Hospital, Guangzhou, China.
Measurement of Indicators
Demographic information was obtained from all patients through questionnaires, including age, sex, habits on
smoking and drinking, a previous history of diseases (such as diabetes, coronary heart disease, and stroke), and com-bined medication history (such as antihypertensive drugs, hypoglycemic drugs, and lipid-lowering drugs). Parameters being measured in the physical examination and laboratory tests included height, weight, and blood pressure, urinalysis, FBG, blood lipid and creatinine after overnight fasting. Drinking status was defined as having consumed at least 50g alcohol daily in the last 30 days and smoking was defined as using at least 100 cigarettes during their lifetime in the last 30 days before the survey of the present study.13 Hypertension was defined as systolic blood pressure (SBP)
≥140 mmHg or/and diastolic blood pressure (DBP) ≥ 90 mmHg, or currently taking antihypertensive medication or self-reported.14Diabetes was defined as FBG≥11.1 mmol/ L, or currently taking hypoglycemic agents or
self-reported.-15
Body mass index (BMI) was calculated as the weight in kilograms divided by the height in meters squared. Estimate glomerularfiltration rate (eGFR) was calculated by using the simplified equation on the modification of diet.
All stroke cases were ascertained from the local med-ical insurance system of the medmed-ical insurance bureau, and patients without medical records were followed up by telephone or by face- to- face in the community until 31 December 2016. Hospitalization with a diagnosis of ischemic stroke was confirmed by computed tomography or magnetic resonance image and checked by discharge data.
Statistical Analysis
All the continuous variables were presented as mean ± stan-dard deviation, and categorical variables were presented in
3500 elderly hypertensive patients
Excluded:
Lack of fasting blood glucose (n=5), Lack of physical examination data (n=16), Lack of blood pressure (n=37),
Stroke history (n=132).
3310 enrolled subjects for analysis
Figure 1Researchflow chart.
Risk Management and Healthcare Policy downloaded from https://www.dovepress.com/ by 118.70.13.36 on 28-Aug-2020
frequency or as a percentage according to baseline FBG categories. FBG concentrations were grouped by quartiles (Q1: < 4.39mmol/l, Q2: 4.40–5.79 mmol/l, Q3: 5.80– 6.36 mmol/l, and Q4: ≥6.37 mmol/l). Subgroup differences by FBG quartiles were identified by the One-Way ANOVA, Kruskal–Wallis H-test and chi-square tests. Hazard ratios (HRs) and 95% confidence intervals (CIs) for ischemic stroke were estimated using multivariate Cox regression analysis. The Model I only included FBG. The model II was adjusted for age, sex and BMI. The model III was adjusted for sex, BMI, age, diabetes history, coronary heart disease history, antihypertensive drugs, statins, SBP, DBP, triglyceride (TG), high-density lipoprotein cholesterol (HDL-C), total cholesterol (TC), low-density lipoprotein cholesterol (LDL-C), smoking, drinking and eGFR. Subgroup analysis was conducted according to sex (male or female), age (<70, 70–80 or ≥80 years), SBP (<140 or
≥140 mm Hg), eGFR (<90 or ≥90 mL/min/1.73m2), BMI (<25 or ≥25 kg/m2), the history of diabetes (yes or no), drinking status (yes or no), smoking status (yes or no), using statins (yes or no) and taking antihypertensive drug (yes or no), and the interactions between FBG and subgroups on the association with stroke were tested. A 2-sided P<0.05 was considered statistically significant. All statistical ana-lyses were performed using R version 3.3.2 (R Foundation for Statistical Computing, Vienna, Austria).
Results
Characteristics of the Participants
After applying the inclusion and exclusion criteria, 3310 older hypertensive patients were included, 1474 (44.53%) were males. The mean age was 71.41 ± 7.20 years old. Baseline characteristics of the participants are presented in
Table 1. There were significant differences in age, BMI, SBP, DBP, triglyceride, LDL-C, HDL-C, sex, smoking status, diabetes history and taking antihypertensive drugs and statins across the quartile groups.
The Relationship Between Fasting Blood
Glucose Levels and Ischemic Stroke
As showed inTable 2, during an average follow-up of 5.5 years, 206 cases of ischemic strokes occurred. When FBG was treated as continuous variable, FBG was significantly associated with ischemic stroke in model I (HR=1.15, 95% CI: 1.08, 1.23; P<0.001). In model II, FBG was still an independent risk factor for ischemic stroke (HR=1.14, 95% CI: 1.07, 1.23; P<0.001), as well as the fully adjusted
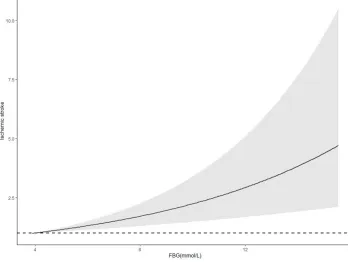
model (model III), where FBG (HR=1.11, 95% CI: 1.03, 1.21; P=0.008) was positively associated with the first occurrence of ischemic stroke (Table 2). When using the lowest quartile of FBG as reference, the HRs for ischemic stroke from Q2 to Q4 were 1.77 (95% CI: 1.10, 2.87, 1.90 (95% CI: 1.18, 3.07) and 3.08 (95% CI: 1.97, 4.83) (P for trend<0.001) in model I. In model III, the HRs for thefirst occurrence of ischemic stroke increased in parallel with the quartiles of FBG (HRs were 1.76 (95% CI: 1.08, 2.86), 1.73 (95% CI: 1.06, 2.81), and 2.42 (95% CI: 1.49, 3.93) from the second to the fourth quartiles, respectively, P for trend<0.001) (Table 2). Multivariate adjusted smoothing spline plots suggested that FBG levels have a nonlinear relationship with the first occurrence of ischemic stroke (Figure 2).
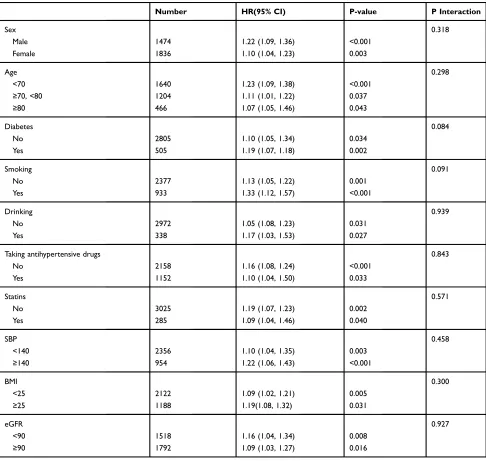
The Results of Subgroup Analyses
As shown in Table 3, subgroup analysis revealed that the association between FBG and risk of ischemic stroke was appear to be stronger in male (HR: 1.22 vs 1.10), those with uncontrolled hypertension (HR: 1.22 vs 1.10), subjects with diabetes (HR: 1.19 vs 1.10), overweight (HR: 1.19 vs 1.09), smoking habits (HR: 1.33 vs 1.13), drinking habits (HR: 1.17 vs 1.05), without using statins (HR: 1.19 vs 1.09), without taking antihypertensive drugs (HR: 1.16 vs 1.10) and those with eGFR< 90 (HR: 1.16 vs 1.09).
Discussion
In the present study, elevated FBG levels were signifi -cantly associated with increased risk for the first incident of ischemic stroke and this relationship appeared as a gradually increasing nonlinear relationship. The risk might further elevate for subjects combined with diabetes, poorly controlled blood pressure, smoking, being over-weight, and with reduced renal function.
We found that the risk forfirst ischemic stroke gradually increased with FBG concentration. The result of the present study agreed with previous cohort analyses among adults with hypertension.12,16Our study did notfind a clear thresh-old for the relationship between FBG and ischemic stroke among older adults with hypertension. Our results might suggest a J-curve nor a U-curve relationship, which was also suggested in some other studies.4,8,10,17,18In addition, a meta-analysis of 102 prospective studies demonstrated that among people without diabetes, FBG concentration had modest and non-linear relation with stroke risk.19The rea-son why our research results differ from previous may be
Risk Management and Healthcare Policy downloaded from https://www.dovepress.com/ by 118.70.13.36 on 28-Aug-2020
Table 1Baseline Characteristics of Participant Patients by Quartiles of Fasting Blood Glucose
All Q1 Q2 Q3 Q4 P-value
Number 3310 810(<4.39mmol/l) 836(4.40–5.79 mmol/l) 829(5.80–6.36 mmol/l) 835(≥6.37 mmol/l)
Age(years) 71.41 ± 7.20 72.25 ± 7.06 71.61 ± 7.01 71.40 ± 7.09 70.39 ± 7.50 <0.001
BMI(kg/m2
) 23.91 ± 3.80 23.30 ± 3.72 23.36 ± 3.44 23.94 ± 3.63 24.03 ± 4.14 <0.001
SBP(mmHg) 131.08 ± 17.23 128.47 ± 15.76 129.94 ± 16.99 132.02 ± 17.36 133.83 ± 18.23 <0.001
DBP(mmHg) 78.33 ± 9.55 77.47 ± 9.19 78.05 ± 9.53 78.58 ± 9.54 79.21 ± 9.85 0.002
TC(mg/dl) 203.07 ± 45.66 203.28 ± 47.84 204.31 ± 42.27 202.19 ± 43.43 202.50 ± 48.88 0.791
Triglyceride (mg/dl) 150.11 ± 116.12 136.15 ± 114.06 136.80 ± 95.11 147.48 ± 107.17 180.39 ± 138.77 <0.001
LDL-C(mg/dl) 103.63 ± 29.43 102.52 ± 27.95 105.04 ± 29.19 105.09 ± 29.89 101.85 ± 30.55 0.047
HDL-C(mg/dl) 50.76 ± 14.03 51.31 ± 16.71 51.51 ± 12.78 50.83 ± 13.03 49.38 ± 13.15 0.010
eGFR(mL/min/1.73m2
) 90.42 ± 34.21 91.95 ± 39.49 88.29 ± 36.65 86.60 ± 30.70 94.82 ±37.49 0.426
Sex(n, %) 0.002
Male 1474 (44.53%) 388 (47.90%) 396 (47.37%) 360 (43.43%) 330 (39.52%)
Female 1836 (55.47%) 422 (52.10%) 440 (52.63%) 469 (56.57%) 505 (60.48%)
Smoking(n, %) 0.002
No 2377 (71.81%) 552 (68.15%) 582 (69.62%) 610 (73.58%) 633 (75.81%)
Yes 933 (28.19%) 258 (31.85%) 254 (30.38%) 219 (26.42%) 202 (24.19%)
Drinking(n, %) 0.719
No 2972 (89.79%) 730 (90.12%) 742 (88.76%) 746 (89.99%) 754 (90.30%)
Yes 338 (10.21%) 80 (9.88%) 94 (11.24%) 83 (10.01%) 81 (9.70%)
Diabetes(n, %) <0.001
No 2805 (84.74%) 771 (95.19%) 781 (93.42%) 747 (90.11%) 506 (60.60%)
Yes 505 (15.26%) 39 (4.81%) 55 (6.58%) 82 (9.89%) 329 (39.40%)
CAD(n, %) 0.352
No 3276 (98.97%) 804 (99.26%) 828 (99.04%) 822 (99.16%) 822 (98.44%)
Yes 34 (1.03%) 6 (0.74%) 8 (0.96%) 7 (0.84%) 13 (1.56%)
Antihypertensive drugs(n, %) <0.001
No 2158 (65.20%) 584 (72.10%) 579 (69.26%) 531 (64.05%) 464 (55.57%)
Yes 1152 (34.80%) 226 (27.90%) 257 (30.74%) 298 (35.95%) 371 (44.43%)
Beta-blocker(n, %) <0.001
No 3155 (95.32%) 778 (96.05%) 808 (96.65%) 797 (96.14%) 772 (92.46%)
Yes 155 (4.68%) 32 (3.95%) 28 (3.35%) 32 (3.86%) 63 (7.54%)
CCB(n, %) <0.001
No 2656 (80.24%) 693 (85.56%) 692 (82.78%) 654 (78.89%) 617 (73.89%)
Yes 654 (19.76%) 117 (14.44%) 144 (17.22%) 175 (21.11%) 218 (26.11%)
ACEI(n, %) 0.006
No 3099 (93.63%) 775 (95.68%) 789 (94.38%) 769 (92.76%) 766 (91.74%)
Yes 211 (6.37%) 35 (4.32%) 47 (5.62%) 60 (7.24%) 69 (8.26%)
ARB(n, %) <0.001
No 2667 (80.57%) 676 (83.46%) 699 (83.61%) 657 (79.25%) 635 (76.05%)
Yes 643 (19.43%) 134 (16.54%) 137 (16.39%) 172 (20.75%) 200 (23.95%)
Statins(n, %) <0.001
No 3025 (91.39%) 752 (92.84%) 771 (92.22%) 771 (93.00%) 731 (87.54%)
Yes 285 (8.61%) 58 (7.16%) 65 (7.78%) 58 (7.00%) 104 (12.46%)
Abbreviations:BMI, body mass index; SBP, systolic blood pressure; DBP, diastolic blood pressure; CAD, coronary heart disease; TC, total cholesterol; HDL-C, high-density lipoprotein cholesterol; LDL-C, low-density lipoprotein cholesterol; eGFR, estimated glomerularfiltration rate; CCB, calcium channel blocker; ACEI, angiotensin-converting enzyme inhibitor; ARB, angiotensin receptor blocker.
Risk Management and Healthcare Policy downloaded from https://www.dovepress.com/ by 118.70.13.36 on 28-Aug-2020
due to the selected population and ethnicities of these stu-dies are different.
In our study, older hypertensive patients combined with diabetes, poorly controlled blood pressure, smoking, being overweight, with reduced renal function might have a higher risk for ischemic stroke. Smoking, elevated SBP, obesity and diabetes were established risk factors for ischemic stroke,3 which was likely the explanation for our findings. Our results were also consistent with pre-vious studies20–23 and current international
recommendations for stroke prevention and treatment.3,24 Individuals should stop smoking, limit or avoid alcohol, maintaining good control on weight, blood pressure, blood sugar and blood lipids for stroke prevention.25–28
However, some limitations should be taken into con-sideration in the present study. First, FBG was measured only once at baseline, so we were not able to examine the effects of FBG changes with stroke. Second, we did not adjust for several confounding factors were adjusted, such as the history of atrialfibrillation, the levels of uric acid
Table 2Relationship Between Fasting Blood Glucose Levels and the First Occurrence of Ischemic Stroke in Different Models
Model I Model II Model III
Case/Total HR(95% CI) P-value HR(95% CI) P-value HR(95% CI) P-value
FBG(per SD increased) 206/3310 1.15 (1.08, 1.23) <0.001 1.14 (1.07, 1.23) <0.001 1.11 (1.03, 1.21) 0.008
FBG (quartile)
Q1 27/810 ref ref ref
Q2 48/836 1.77 (1.10, 2.87) 0.019 1.79 (1.10, 2.90) 0.018 1.76 (1.08, 2.86) 0.023 Q3 51/829 1.90 (1.18, 3.07) 0.008 1.87 (1.16, 3.02) 0.010 1.73 (1.06, 2.81) 0.027 Q4 80/835 3.08 (1.97, 4.83) <0.001 2.89 (1.83, 4.55) <0.001 2.42 (1.49, 3.93) <0.001
P for trend <0.001 <0.001 <0.001
Notes:Model I adjust for: none. Model II adjust for: sex, BMI, age. Model III adjust for: sex, BMI, age, diabetes history, coronary heart disease history, antihypertensive drugs, statins, SBP, DBP, TC, TG, LDL-C, HDL-C, smoking, drinking and eGFR.
Abbreviations:FBG, fasting blood glucose; Q, quartile; SD, standard deviation, HR, hazard ratios; CI, confidence interval.
Figure 2The relationship between fasting blood glucose levels and thefirst occurrence of ischemic stroke.
Abbreviations:FBG, fasting blood glucose; HR, hazard ratios; CI, confidence interval.
Risk Management and Healthcare Policy downloaded from https://www.dovepress.com/ by 118.70.13.36 on 28-Aug-2020
and homocysteine. Third, the history of diabetes in this study was mainly obtained from self-reported history and we did not have the data of glycated hemoglobin. Finally, the present study did not distinguish the relationship between FBG and different subtypes of stroke.
Conclusion
In conclusion, among elderly hypertensive patients, FBG was closely related to the first occurrence of ischemic stroke. The relationship was stronger for subjects
combined with diabetes, poorly controlled blood pres-sure, smoking, being overweight, and with reduced renal function.
Abbreviations
BMI, body mass index; SBP, systolic blood pressure; DBP, diastolic blood pressure; TC, total cholesterol; HDL-C, high-density lipoprotein cholesterol; LDL-C, low-high-density lipopro-tein cholesterol; eGFR, estimated glomerularfiltration rate; Q, quartile; HR, hazard ratios; CI, confidence interval.
Table 3Effect Size of Fasting Blood Glucose Levels on the First Occurrence of Ischemic Stroke in Subgroups
Number HR(95% CI) P-value P Interaction
Sex 0.318
Male 1474 1.22 (1.09, 1.36) <0.001
Female 1836 1.10 (1.04, 1.23) 0.003
Age 0.298
<70 1640 1.23 (1.09, 1.38) <0.001
≥70, <80 1204 1.11 (1.01, 1.22) 0.037
≥80 466 1.07 (1.05, 1.46) 0.043
Diabetes 0.084
No 2805 1.10 (1.05, 1.34) 0.034
Yes 505 1.19 (1.07, 1.18) 0.002
Smoking 0.091
No 2377 1.13 (1.05, 1.22) 0.001
Yes 933 1.33 (1.12, 1.57) <0.001
Drinking 0.939
No 2972 1.05 (1.08, 1.23) 0.031
Yes 338 1.17 (1.03, 1.53) 0.027
Taking antihypertensive drugs 0.843
No 2158 1.16 (1.08, 1.24) <0.001
Yes 1152 1.10 (1.04, 1.50) 0.033
Statins 0.571
No 3025 1.19 (1.07, 1.23) 0.002
Yes 285 1.09 (1.04, 1.46) 0.040
SBP 0.458
<140 2356 1.10 (1.04, 1.35) 0.003
≥140 954 1.22 (1.06, 1.43) <0.001
BMI 0.300
<25 2122 1.09 (1.02, 1.21) 0.005
≥25 1188 1.19(1.08, 1.32) 0.031
eGFR 0.927
<90 1518 1.16 (1.04, 1.34) 0.008
≥90 1792 1.09 (1.03, 1.27) 0.016
Notes:When analysis a subgroup variable, sex, BMI, age, diabetes history, coronary heart disease history, antihypertensive drugs, statins, SBP, DBP, TC, TG, LDL-C, HDL-C, smoking, drinking and eGFR were all adjusted expect itself.
Abbreviations:BMI, body mass index; SBP, systolic blood pressure; eGFR, estimated glomerularfiltration rate; HR, hazard ratios; CI, confidence interval.
Risk Management and Healthcare Policy downloaded from https://www.dovepress.com/ by 118.70.13.36 on 28-Aug-2020
Author Contributions
All authors made substantial contributions to conception and design, acquisition of data, or analysis and interpretation of data; took part in drafting the article or revising it critically for important intellectual content; gavefinal approval of the version to be published; and agree to be accountable for all aspects of the work.
Funding
This work was supported by the Natural Science Foundation of Guangdong Province (No. 2020A1515010738), the National Nature Science Foundation of China (No. 81300230), the Science and Technology Program of Guangzhou (No.201803040012), and the National Key Research and Development Program of China (No.2017FYC1307603, No.2016YFC1301305), the Key Area R&D Program of Guangdong Province (No.2019B020227005).
Disclosure
The authors declare that they have no conflict of interest.
References
1. Li Z, Jiang Y, Li H, Xian Y, Wang Y. China’s response to the rising stroke burden.BMJ.2019;364:l879. doi:10.1136/bmj.l879
2. Wang W, Jiang B, Sun H, et al. Prevalence, Incidence, and mortality of stroke in china: results from a nationwide population-based survey of 480 687 adults. Circulation. 2017;135(8):759–771. doi:10.1161/ CIRCULATIONAHA.116.025250
3. Wein T, Lindsay MP, Cote R, et al. Canadian stroke best practice recommendations: secondary prevention of stroke, sixth edition prac-tice guidelines, update 2017. Int J Stroke. 2018;13(4):420–443. doi:10.1177/1747493017743062
4. Park C, Guallar E, Linton JA, et al. Fasting glucose level and the risk of incident atherosclerotic cardiovascular diseases. Diabetes Care.
2013;36(7):1988–1993. doi:10.2337/dc12-1577
5. Baumert J, Heidemann C, Paprott R, Du Y, Scheidt-Nave C. Association between random glucose and all-cause mortality:findings from the mortality follow-up of the German National Health Interview and Examination Survey 1998.BMC Endocr Disord.2018;18(1):95. doi:10.1186/s12902-018-0319-2
6. Lee G, Kim SM, Choi S, et al. The effect of change in fasting glucose on the risk of myocardial infarction, stroke, and all-cause mortality: a nationwide cohort study. Cardiovasc Diabetol. 2018;17(1):51. doi:10.1186/s12933-018-0694-z
7. Mongraw-Chaffin M, LaCroix AZ, Sears DD, et al. A prospective study of low fasting glucose with cardiovascular disease events and all-cause mortality: the Women’s Health Initiative. Metabolism.
2017;70:116–124. doi:10.1016/j.metabol.2017.02.010
8. Sung J, Song YM, Ebrahim S, Lawlor DA. Fasting blood glucose and the risk of stroke and myocardial infarction. Circulation. 2009;119 (6):812–819. doi:10.1161/CIRCULATIONAHA.108.776989 9. Sui X, Lavie CJ, Hooker SP, et al. A prospective study of fasting
plasma glucose and risk of stroke in asymptomatic men.Mayo Clin Proc.2011;86(11):1042–1049. doi:10.4065/mcp.2011.0267
10. Tanne D, Koren-Morag N, Goldbourt U. Fasting plasma glucose and risk of incident ischemic stroke or transient ischemic attacks: a prospective cohort study. Stroke. 2004;35(10):2351–2355. doi:10.1161/01.STR.0000140738.94047.55
11. Shaye K, Amir T, Shlomo S, Yechezkel S. Fasting glucose levels within the high normal range predict cardiovascular outcome. Am Heart J.2012;164(1):111–116. doi:10.1016/j.ahj.2012.03.023 12. Tziomalos K, Spanou M, Baltatzi M, et al. Impaired fasting glucose
in hypertensive patients: prevalence and cross-sectional analysis of associations with cardiovascular disease. Diabetes Technol Ther.
2013;15(6):475–480. doi:10.1089/dia.2012.0336
13. Zhao R, Duan X, Wu Y, Zhang Q, Chen Y. Association of exposure to Chinese famine in early life with the incidence of hypertension in adulthood: A 22-year cohort study. Nutr Metab Cardiovasc Dis.
2019;29(11):1237–1244. doi:10.1016/j.numecd.2019.07.008 14. James PA, Oparil S, Carter BL, et al. 2014 evidence-based guideline
for the management of high blood pressure in adults: report from the panel members appointed to the Eighth Joint National Committee (JNC 8). JAMA. 2014;311(5):507–520. doi:10.1001/ jama.2013.284427
15. Association AD Classification and Diagnosis of Diabetes: standards of Medical Care in Diabetes-2018.Diabetes Care.2018;41(Suppl 1): S13–S27. doi:10.2337/dc18-S002
16. Xu RB, Kong X, Xu BP, et al. Longitudinal association between fasting blood glucose concentrations andfirst stroke in hypertensive adults in China: effect of folic acid intervention.Am J Clin Nutr.
2017;105(3):564–570. doi:10.3945/ajcn.116.145656
17. Jin C, Li G, Rexrode KM, et al. Prospective study of fasting blood glucose and intracerebral hemorrhagic risk.Stroke.2018;49(1):27– 33. doi:10.1161/STROKEAHA.117.019189
18. Doi Y, Ninomiya T, Hata J, et al. Impact of glucose tolerance status on development of ischemic stroke and coronary heart disease in a general Japanese population: the Hisayama study.Stroke.2010;41 (2):203–209. doi:10.1161/STROKEAHA.109.564708
19. Sarwar N, Gao P, Seshasai SR, et al. Diabetes mellitus, fasting blood glucose concentration, and risk of vascular disease: a collaborative meta-analysis of 102 prospective studies. Lancet. 2010;375 (9733):2215–2222. doi:10.1016/S0140-6736(10)60484-9
20. Ohkubo T, Asayama K, Kikuya M, et al. Prediction of ischaemic and haemorrhagic stroke by self-measured blood pressure at home: the Ohasama study.Blood Press Monit.2004;9(6):315–320. doi:10.1097/ 00126097-200412000-00009
21. Lee JS, Chang PY, Zhang Y, et al. Triglyceride and HDL-C Dyslipidemia and Risks of Coronary Heart Disease and Ischemic Stroke by Glycemic Dysregulation Status: the Strong Heart Study. Diabetes Care.2017;40(4):529–537. doi:10.2337/dc16-1958 22. Mitchell AB, Cole JW, McArdle PF, et al. Obesity increases risk of
ischemic stroke in young adults. Stroke. 2015;46(6):1690–1692. doi:10.1161/STROKEAHA.115.008940
23. Turner GM, Calvert M, Feltham MG, et al. Under-prescribing of pre-vention drugs and primary prepre-vention of stroke and transient ischaemic attack in UK general practice: a retrospective analysis.PLoS Med.
2016;13(11):e1002169. doi:10.1371/journal.pmed.1002169
24. Meschia JF, Bushnell C, Boden-Albala B, et al. Guidelines for the primary prevention of stroke: a statement for healthcare professionals from the American Heart Association/American Stroke Association. Stroke.2014;45(12):3754–3832. doi:10.1161/STR.0000000000000046 25. Katsanos AH, Filippatou A, Manios E, et al. Blood pressure reduc-tion and secondary stroke prevenreduc-tion: a systematic review and metar-egression analysis of randomized clinical trials. Hypertension.
2017;69(1):171–179. doi:10.1161/HYPERTENSIONAHA.116.08485 26. Zhong P, Wu D, Ye X, et al. Secondary prevention of major cere-brovascular events with seven different statins: a multi-treatment meta-analysis. Drug Des Devel Ther. 2017;11:2517–2526. doi:10.2147/DDDT.S135785
Risk Management and Healthcare Policy downloaded from https://www.dovepress.com/ by 118.70.13.36 on 28-Aug-2020
27. Hankey GJ. Stroke.Lancet.2017;389(10069):641–654. doi:10.1016/ S0140-6736(16)30962-X
28. Steiger N, Cifu AS. Primary Prevention of Stroke.JAMA.2016;316 (6):658–659. doi:10.1001/jama.2016.5529
Risk Management and Healthcare Policy
Dove
press
Publish your work in this journal
Risk Management and Healthcare Policy is an international, peer-reviewed, open access journal focusing on all aspects of public health, policy, and preventative measures to promote good health and improve morbidity and mortality in the population. The journal welcomes submitted papers covering original research, basic science, clinical & epidemiological studies, reviews and evaluations,
guidelines, expert opinion and commentary, case reports and extended reports. The manuscript management system is completely online and includes a very quick and fair peer-review system, which is all easy to use. Visit http://www.dovepress.com/testimonials.php to read real quotes from published authors.
Submit your manuscript here:https://www.dovepress.com/risk-management-and-healthcare-policy-journal
Risk Management and Healthcare Policy downloaded from https://www.dovepress.com/ by 118.70.13.36 on 28-Aug-2020