University of Pennsylvania
ScholarlyCommons
Publicly Accessible Penn Dissertations
2018
A Cross-Sectional Study To Examine The Effects
Of Nurse Work Environment On Patient And
Nurse Outcomes In Nursing Homes
Elizabeth Marie White
University of Pennsylvania, [email protected]
Follow this and additional works at:https://repository.upenn.edu/edissertations
Part of theNursing Commons
Recommended Citation
White, Elizabeth Marie, "A Cross-Sectional Study To Examine The Effects Of Nurse Work Environment On Patient And Nurse Outcomes In Nursing Homes" (2018).Publicly Accessible Penn Dissertations. 2784.
A Cross-Sectional Study To Examine The Effects Of Nurse Work
Environment On Patient And Nurse Outcomes In Nursing Homes
Abstract
Background: Registered nurse (RN) turnover is a significant problem in nursing homes and has been
consistently linked to poor patient outcomes in this setting. Extensive evidence from hospitals has shown that work environment is an important predictor of patient care quality and nurse factors leading to turnover such as job dissatisfaction and burnout, but very little research has explored these same relationships in nursing homes.
Objectives: To study the empirical relationships between work environment and patient and nurse outcomes in nursing homes.
Design: Cross-sectional secondary data analysis linking 2015 RN4CAST four state nurse survey data; LTCfocus, a publically available data set from Brown University; and Nursing Home Compare from the Centers for Medicare and Medicaid Services (CMS).
Population Studied: The nursing home sample consisted of 245 CMS-certified nursing homes in California, Florida, New Jersey, and Pennsylvania. The nurse sample consisted of 692 RNs employed in those facilities.
Results: Patient outcomes: Compared to nursing homes with poor work environments, facilities with good work environments had a 3.04 higher odds of receiving an overall star rating of 4 or 5 stars versus 1 or 2 stars, 1.8% fewer high risk residents with pressure ulcers, and 0.15 fewer hospitalizations per resident year; facilities with average work environments had 2.23% fewer long-stay residents on antipsychotics. The relationships between good and poor environments for antipsychotics and 30 day readmissions were in the hypothesized direction but not statistically significant. Nurse outcomes: RNs working in nursing homes with good work environments were 89% less likely to report job dissatisfaction, 76% less likely to report intent to leave their jobs within one year, 87% less likely to experience burnout, and 73% less likely to report leaving necessary patient care undone compared to RNs working in facilities with poor work environments. RNs in good work environments were more likely to have been employed 3 years or more than RNs in poor environments, but the result was not statistically significant.
Conclusions: Nurse work environment is an important and tangible area to target for interventions to improve care quality and reduce staff turnover in nursing homes.
Degree Type Dissertation
Degree Name
Doctor of Philosophy (PhD)
First Advisor
Matthew D. McHugh
Keywords
long-term care, nursing, nursing home, work environment, workforce
A CROSS-SECTIONAL STUDY TO EXAMINE THE EFFECTS OF NURSE WORK ENVIRONMENT ON PATIENT AND NURSE OUTCOMES IN NURSING HOMES
Elizabeth M. White A DISSERTATION
in Nursing
Presented to the Faculties of the University of Pennsylvania in
Partial Fulfillment of the Requirements for the Degree of Doctor of Philosophy
2018 Supervisor of Dissertation
______________________________________________ Matthew D. McHugh, PhD, JD, MPH, RN, CRNP, FAAN
The Independence Chair for Nursing Education, Professor of Nursing
Graduate Group Chairperson
______________________________________________ Salimah H. Meghani, PhD, MBE, RN, FAAN
Term Chair of Palliative Care, Associate Professor of Nursing
Dissertation Committee
Linda H. Aiken, PhD, FAAN, FRCN
Claire M. Fagin Leadership Professor in Nursing, Professor of Sociology Kathryn H. Bowles, PhD, RN, FAAN, FACMI
A CROSS-SECTIONAL STUDY TO EXAMINE THE EFFECTS OF NURSE WORK ENVIRONMENT ON PATIENT AND NURSE OUTCOMES IN NURSING HOMES
COPYRIGHT 2018
Elizabeth Marie White
This work is licensed under the Creative Commons Attribution- NonCommercial-ShareAlike 3.0 License
To view a copy of this license, visit
ACKNOWLEDGMENT
Dissertations don’t happen in a vacuum and there are many people I would like to acknowledge for their help and support along the way.
First and foremost, thank you to my chair Matt McHugh for his consistently sound and pragmatic advice, and for helping me to sort through challenges and organize my thoughts throughout this process. Thank you to Linda Aiken, whose work I have admired for years, for her encouragement, leadership, and ability to frame questions and problems in ways I would not have otherwise considered. Thank you to Kathy Bowles for her tremendous assistance in navigating the proposal writing process and for teaching me about grantsmanship. And thank you to my readers, Margo Brooks Carthon and Pam Cacchione, for their valuable and insightful feedback on this dissertation.
Thank you to all the staff and faculty in the Center for Health Outcomes and Policy Research (CHOPR). Thank you to Andrea Barol and Irene Hung for always having the right answer to any question and for all that they do to support the work of the center. Thank you to Tim Cheney who has tolerated me flagging him down in the hallway with statistical questions way more than he needed to. Thank you to Doug Sloane and Jesse Chittams for their methodological assistance on this and other projects.
Thank you to my colleagues at Mercy LIFE West Philadelphia for their flexibility which has allowed me to stay grounded in the clinical world while in the PhD program.
Thank you to Marianne Smith who talked me into becoming a nurse 20 years ago when I came to visit Penn’s campus my senior year of high school.
Thank you to my mom and dad for going along with Marianne’s plan and for all their continued support over the years.
Thank you to the nurses who came before me in my family – my grandmother Dorothy White who cared for pediatric iron lung patients on a polio ward, and raised four kids while working night shifts; and my great-aunt Doris Donovan who was the chief nurse of an army evacuation hospital in Europe during World War II. Thank you also to my great-aunt Kay Hammerman who, though not a nurse, always followed my activities with great interest and took every opportunity to tell anyone at her assisted living facility who would listen that I was going back to school “to become a doctor”.
ABSTRACT
A CROSS-SECTIONAL STUDY TO EXAMINE THE EFFECTS OF NURSE WORK ENVIRONMENT ON PATIENT AND NURSE OUTCOMES IN NURSING HOMES
Elizabeth M. White Matthew D. McHugh
Background: Registered nurse (RN) turnover is a significant problem in nursing homes and has been consistently linked to poor patient outcomes in this setting. Extensive evidence from hospitals has shown that work environment is an important predictor of patient care quality and nurse factors leading to turnover such as job dissatisfaction and burnout, but very little research has explored these same relationships in nursing homes.
Objectives: To study the empirical relationships between work environment and patient and nurse outcomes in nursing homes.
Design: Cross-sectional secondary data analysis linking 2015 RN4CAST four state nurse survey data; LTCfocus, a publically available data set from Brown University; and Nursing Home Compare from the Centers for Medicare and Medicaid Services (CMS).
Population Studied: The nursing home sample consisted of 245 CMS-certified nursing homes in California, Florida, New Jersey, and Pennsylvania. The nurse sample consisted of 692 RNs employed in those facilities.
environments had 2.23% fewer long-stay residents on antipsychotics. The relationships between good and poor environments for antipsychotics and 30 day readmissions were in the hypothesized direction but not statistically significant. Nurse outcomes: RNs
working in nursing homes with good work environments were 89% less likely to report job dissatisfaction, 76% less likely to report intent to leave their jobs within one year, 87% less likely to experience burnout, and 73% less likely to report leaving necessary patient care undone compared to RNs working in facilities with poor work environments. RNs in good work environments were more likely to have been employed 3 years or more than RNs in poor environments, but the result was not statistically significant.
TABLE OF CONTENTS
ACKNOWLEDGMENT... iii
ABSTRACT ... v
LIST OF TABLES ... ix
LIST OF FIGURES ... xi
CHAPTER 1: INTRODUCTION ... 1
The Problem ... 1
Study Overview, Specific Aims, and Hypotheses... 4
Impact ... 5
CHAPTER 2: BACKGROUND AND SIGNIFICANCE ... 7
Introduction ... 7
Review of the Literature ... 8
Conceptual Framework ... 15
Innovation... 17
Clinical Implications ... 19
Summary ... 23
CHAPTER 3: METHODS ... 24
Design... 24
Data Sources ... 25
Sample ... 33
Major Study Variables ... 33
Analytic Approach ... 43
Power ... 48
Human Subjects... 49
Summary ... 51
CHAPTER 4: RESULTS ... 52
Introduction ... 52
Aim 1 ... 52
Analysis of Aim 1 ... 57
Aim 1 Summary... 63
Aim 2 ... 65
Nurse Sample Characteristics ... 65
Analysis of Aim 2 ... 69
Aim 2 Summary... 72
CHAPTER 5: DISCUSSION ... 75
Key Findings ... 75
Components of the Work Environment ... 77
Limitations ... 84
Implications and Potential Interventions ... 87
Future Research ... 93
Conclusions ... 95
LIST OF TABLES
Table 3.1. Variation in organizational characteristics across sample nursing homes vs. all
CMS-certified nursing homes in CA, NJ, FL and PA………..……….32
Table 3.2. Nursing home-level patient measures………..…..………...36
Table 3.3. Nurse outcome measures……….…..………...38
Table 3.4. Covariates – measurement of nursing home organizational characteristics...40
Table 3.5. Covariates – measurement of nursing home patient characteristics………...41
Table 3.6. Covariates – measurement of nurse characteristics……….……...42
Table 3.7. Summary of covariates………...………...43
Table 3.8. Intraclass correlation coefficients………..………...44
Table 4.1. Variation in nursing home organizational characteristics across different types of work environments………...………...53
Table 4.2. Variation in patient outcome measures by nursing home organizational characteristics ………55
Table 4.3. Variation in five-star ratings by nursing home organizational characteristics ………56
Table 4.4. Effects of nurse work environment on nursing home-level patient outcomes in good vs. poor work environments……….………...58
Table 4.5. Effects of nurse work environment on five-star rating in nursing homes with good vs. poor work environments……….….………62
Table 4.7. Variation in nurse outcomes across nursing homes with different work
environments………..67
Table 4.8. Effects of nurse work environment on nurse outcomes in good vs. poor work environments……….………...70
LIST OF FIGURES
Figure 2.1. Quality Health Outcomes Model………..…….…….16 Figure 3.1. Process for obtaining nursing home nurse sample from parent study………..29
Figure 4.1. Predicted hospitalizations per resident year at varying levels of Medicare census and work environment………...61
Figure 4.2. Forest plot showing odds of achieving 4/5 stars vs. 1/2 stars in nursing homes with good vs. poor work environments………...63
Figure 4.3. Forest plots showing percent change in pressure ulcers, antipsychotics, and readmissions in nursing homes with good vs. poor work environments………...64
Figure 4.4. Forest plot showing hospitalizations per resident year in nursing homes with good vs. poor work environments………...…...65
Figure 4.5. Percentage of nurses reporting various nurse outcome across nursing homes with different work environments………...………...68
Figure 4.6. Percentage of nurses reporting that necessary care tasks were left undone on last shift due to time constraints across nursing homes with different work
environments….……….….………...68
Figure 4.7. Forest plots showing odds ratios of nurse outcomes in nursing homes with good vs. poor work environments……….…..………...73
Figure 5.1. Percentage of nurses reporting dissatisfaction with various aspects of job across different work environments………...80
Figure 5.3. Variation in nursing home staffing & resource adequacy PES-NWI subscale score by number of tasks RNs left undone on last shift………...…..83
CHAPTER 1: INTRODUCTION
The Problem
Quality and safety continue to be major issues of concern in nursing homes
(Castle & Ferguson, 2010; Department of Health and Human Services Office of Inspector General, 2014; Werner & Konetzka, 2010; Wiener, Freiman, & Brown, 2007). In a 2008-2012 study, 1 in 5 Medicare beneficiaries receiving post-acute care in nursing homes were found to have experienced adverse events, resulting in an estimated $2.8 billion annual excess spending on hospital care (Department of Health and Human Services Office of Inspector General, 2014). Over two-thirds of these adverse events were classified as preventable due to failure or delay of necessary care, inadequate patient monitoring, or substandard treatment.
Smith, & Lake, 1994; Friese, Lake, Aiken, Silber, & Sochalski, 2008; Friese, Xia, Ghaferi, Birkmeyer, & Banerjee, 2015; Kutney-Lee et al., 2009; McHugh, Aiken, Eckenhoff, & Burns, 2016; McHugh et al., 2013; Silber et al., 2016). Better hospital work environments have also been linked with better nurse outcomes including lower rates of nurse burnout and job dissatisfaction (Aiken et al., 2008; Aiken, Sloane, et al., 2011; Kelly, McHugh, & Aiken, 2011; Lake, 2007; Laschinger & Leiter, 2006; McHugh et al., 2016; Van Bogaert, Kowalski, Weeks, & Clarke, 2013).
RNs in nursing homes report higher rates of job dissatisfaction and burnout than RNs working in any other setting, including hospitals (McHugh, Kutney-Lee, Cimiotti, Sloane, & Aiken, 2011). Turnover is a significant problem in nursing homes, with average annual RN turnover rates hovering around 50% for years (American Health Care Association, 2012; Castle, 2008b). RN turnover in nursing homes has been linked to higher use of restraints, catheters, and psychotropic medications; higher prevalence of contractures and pressure ulcers (Castle & Engberg, 2005); more survey deficiency citations (Castle & Engberg, 2005; Lerner, Johantgen, Trinkoff, Storr, & Han, 2014); worse pain management (Castle & Anderson, 2011); higher rates of infection and hospitalization (Zimmerman, Gruber-Baldini, Hebel, Sloane, & Magaziner, 2002); and overall worse quality (Castle, Engberg, & Men, 2007). Turnover also generates additional labor costs for training, recruitment, hiring, and productivity loss (Jones, 2008). This is particularly problematic for nursing homes which already function under tight budget constraints due to high dependence on Medicaid funding, and growing shortfalls between Medicaid reimbursement and actual costs of care (American Health Care Association, 2016).
Much is known about the adverse effects of RN turnover on patient outcomes in nursing homes, but turnover rates remain high and have failed to improve over time. Since job satisfaction and burnout are important contributors to turnover (Laschinger & Leiter, 2006; Leiter & Maslach, 2009),and since work environment has been extensively linked to both patient and nurse outcomes in hospitals, I hypothesized that work
Study Overview, Specific Aims, and Hypotheses
The purpose of this study was to examine the empirical relationship between nurse work environment and patient and nurse outcomes in nursing homes, using cross-sectional data from the 2015 RN4CAST four state nurse survey, the Centers for Medicare and Medicaid Services’ (CMS) Nursing Home Compare database, and LTCfocus, a publically available data set on nursing home care from Brown University.
The study had two aims:
Aim 1: To examine whether nurse work environment is associated with patient outcomes in nursing homes, using 2015 four state nurse survey data and five quality measures from Nursing Home Compare and LTCfocus (pressure ulcer prevalence, antipsychotic medication use, 30 day hospital readmissions, hospitalizations per resident year, and five-star rating).
Hypothesis 1a: Better work environments will be associated with better patient
outcomes, as measured at the nursing home level.
Hypothesis 1b: Better work environments will be associated with better overall
facility quality, as measured by the CMS five-star ratings.
Aim 2: To examine whether nurse work environment is associated with nurse outcomes (burnout, job satisfaction, intent to leave, retention, and missed care) in nursing homes, using 2015 four state nurse survey data.
Hypothesis 2a: RNs working in nursing homes with better work environments
will report higher rates of retention, and lower rates of job dissatisfaction,
Hypothesis 2b: RNs working in nursing homes with better work environments
will report lower rates of missed care compared to RNs in poor work
environments.
Impact
This study will be the first to use multi-state nurse survey data with the Practice Environment Scale of the Nursing Work Index (PES-NWI) (Lake, 2002), a
comprehensive National Quality Forum-endorsed measure of work environment (Lake, 2002, 2007; National Quality Forum, 2004), to examine the empirical relationship
between nurse work environment and both patient and nurse outcomes in nursing homes. Because characteristics of the work environment are modifiable, findings from this study will help inform whether interventions to improve work environments could improve the safety and quality of care in nursing homes.
Nursing home administrators will always be financially constrained in their capacity to increase staffing due to tight operating margins. While staffing adequacy is a key component of good work environments, interventions to improve other aspects of the work environment such as organizational leadership, nurse autonomy, nurse participation in organizational decisions, and nurse-physician relationships require less fiscal
investment, yet could still potentially improve care quality. Additionally, if nursing homes could achieve cost reductions from decreased turnover, they would have more to invest in staffing and other areas affecting quality. Interventions to improve work
environments reflect recommendations in the Institute of Medicine’s 2003 report Keeping
CHAPTER 2: BACKGROUND AND SIGNIFICANCE
Introduction
Registered nurses (RNs) oversee the care of nursing home patients, and thus have significant influence over safety and quality in this setting. Nursing home patients suffer a large number of preventable adverse events due to failure or delay of necessary care, inadequate patient monitoring, and substandard treatment, according to a 2008-2012 study from the Department of Health and Human Services’ Office of Inspector General (Department of Health and Human Services Office of Inspector General, 2014). These are domains which all fall under the leadership of RNs, who serve as directors of nursing, supervisors, and charge nurses. RNs in nursing homes are responsible for supervising licensed practical nurses (LPNs) and certified nursing assistants (CNAs), coordinating resident care plans, managing resources, conducting surveillance of patients’ conditions, and intervening when changes in patient condition occur. RNs also oversee wound surveillance and treatments, monitor and respond to adverse events, and direct infection control and quality improvement programs (Dever, 2018; McGilton et al., 2016;
Montayre & Montayre, 2017).
Review of the Literature
Hospital Work Environment
The impact of nurse work environment on patient outcomes has been
demonstrated extensively in hospitals. Hospitals with better work environments have been found to have lower 30 day mortality (Aiken, Cimiotti, et al., 2011; Aiken et al., 1994; Friese et al., 2008; Friese et al., 2015; McHugh et al., 2016; McHugh et al., 2013; Silber et al., 2016); lower failure-to-rescue (death following a complication) (Aiken, Cimiotti, et al., 2011; Aiken et al., 2008; Friese et al., 2008; Friese et al., 2015; McHugh et al., 2016; McHugh et al., 2013); higher patient satisfaction (Aiken et al., 2012; Kutney-Lee et al., 2009); decreased ICU use (Silber et al., 2016); and reduced length of stay (Silber et al., 2016).
RNs in hospitals with better work environments have been found to have less burnout (Aiken et al., 2008; Aiken, Sloane, et al., 2011; Kelly et al., 2011; Lake, 2007; Laschinger & Leiter, 2006; Van Bogaert et al., 2013); job dissatisfaction (Aiken et al., 2008; Aiken, Sloane, et al., 2011; Kelly et al., 2011; Lake, 2007; McHugh et al., 2016); and intention to leave their current jobs (Aiken et al., 2008; Kelly et al., 2011; Lake, 2007; McHugh et al., 2016; Van Bogaert et al., 2013). They are also more likely to give their hospitals good ratings on quality and safety compared to RNs in poor work
staffing and resource adequacy, nurse leadership, and collegial nurse-physician relationships.
Nurse Turnover in Nursing Homes
The contribution of work environment to nurse job dissatisfaction and burnout is highly relevant in nursing homes, because job dissatisfaction and burnout are important contributors to turnover (Laschinger & Leiter, 2006; Leiter & Maslach, 2009),which is a significant problem in this setting. RNs working in nursing homes report higher rates of job dissatisfaction and burnout than RNs working in any other setting, including hospitals (McHugh et al., 2011). Turnover rates for RNs in nursing homes are high, and there is significant variation across different facilities and states. Castle in 2008 found a national average annual RN turnover rate of 46.3%, however this ranged from 21% to 71% across the 50 states (Castle, 2008b). National average turnover rates for RNs have remained around 50% for years (American Health Care Association, 2012). High RN turnover has been linked to higher use of restraints, catheters, and psychotropic medications; higher prevalence of contractures and pressure ulcers (Castle & Engberg, 2005); more survey deficiency citations (Castle & Engberg, 2005; Lerner et al., 2014); worse pain
management (Castle & Anderson, 2011); higher rates of infection and hospitalization (Zimmerman et al., 2002); and overall worse quality (Castle et al., 2007).
occupancy (Castle, 2008b); higher case mix (Anderson et al., 2004; Anderson et al., 1997); higher wage competition (Anderson et al., 1997); and lower profit margin
(Anderson et al., 1997). For example, a nursing home cannot easily change its ownership structure or bed capacity. By contrast, several elements of the work environment such as organizational leadership, staff engagement, and colleague relationships are more
modifiable, and thus potential areas to target to reduce turnover and improve patient safety. Other factors that have been found to contribute to RN turnover are staffing and workload (Anderson et al., 2004; Anderson et al., 1997; Castle, 2008b; Castle &
Engberg, 2006), top management turnover (Castle, 2008b; Castle & Engberg, 2006), and director of nursing turnover and tenure (Castle, 2008b; Castle & Engberg, 2006).
Nursing Home Staffing
In contrast to the research that has been done in hospitals, nurse work
2006; Grabowski et al., 2008; Spilsbury et al., 2011); and various other measures from the Minimum Data Set such as weight loss, incontinence, and functional decline (Bostick et al., 2006; Dellefield et al., 2015; Spilsbury et al., 2011). Of five systematic reviews that have examined this body of research, all found generally positive correlations
between RN staffing and patient outcomes, with RN staffing having stronger effects than LPN and CNA staffing, however, all observed that there were many mixed results among the studies they reviewed (Bostick et al., 2006; Castle, 2008a; Dellefield et al., 2015; Grabowski et al., 2008; Spilsbury et al., 2011). An additional systematic review of only longitudinal studies found no consistent relationships between RN staffing and quality outcomes (Backhaus et al., 2014).
participation in organizational affairs, use of nursing care models, nurse leadership, and collegial nurse-physician relationships—are influencing patient outcomes.
Nursing Home Work Environment
Aside from staffing, research linking other elements of the nurse work
environment to patient outcomes in nursing homes has been much more limited. Only one other study (Flynn et al., 2010) used the full PES-NWI to examine the effects of RN work environment on patient outcomes. Flynn et al in a cross-sectional study linking Nursing Home Compare with 2006 RN4CAST survey data from 340 RNs in 63 nursing homes in New Jersey, found that nursing homes with better nurse work environments had fewer pressure ulcers and survey deficiency citations. They also found that nurse work environment fully mediated the effect of for profit status on pressure ulcer prevalence. In a related study with that same nurse sample, Choi et al. (2012) found that RNs working in nursing homes with better work environments had higher job satisfaction. These two studies are also the only two to have used a random state-wide sample of nurses, rather than surveying employees through their employers which creates the potential for response bias.
improvement over time (Anderson & McDaniel, 1999) and reduced problematic patient behaviors (Anderson et al., 2003). Anderson et al. (2003) also found that good
communication and relations between RNs and their managers were associated with fewer restraints, fractures, and complications of immobility.
Other studies on nursing home work environment have been done on nursing home workers overall, with RNs making up only small proportions of the samples (Plaku-Alakbarova, Punnett, & Gore, 2018; Greener et al., 2012; Temkin-Greener et al., 2010; Zuniga et al., 2015a; Zuniga et al., 2015b). While there are likely many overlapping features of good work environments for RNs and other staff, these broader studies are unlikely to capture elements that support RNs specifically to perform their vital clinical functions in nursing homes. Still, findings from this research have shown similar themes as has been found with RNs. Work environment elements like staffing and resource adequacy, safety climate, and teamwork have been linked with better patient outcomes (Temkin-Greener et al., 2012; Temkin-Greener et al., 2010), better worker-reported quality (Zuniga et al., 2015a) and less rationing of nursing care (Zuniga et al., 2015b). Only two of these studies looked at independently measured patient outcomes (Temkin-Greener et al., 2012; Temkin-Greener et al., 2010) and, again, all surveyed workers through their employers raising the potential for response bias.
Outcome Measures
exploration into the effects of work environment on quality and safety in nursing homes. The patient outcomes examined in this study are widely accepted measures of quality in nursing homes that have been previously linked to organizational elements of nursing such as staffing and turnover. These include: pressure ulcer prevalence (Bostick et al., 2006; Castle, 2008a; Castle & Engberg, 2005; Castle et al., 2007; Dellefield et al., 2015; Department of Health and Human Services Office of Inspector General, 2014; Spilsbury et al., 2011); antipsychotic medication use (Bostick et al., 2006; Castle & Engberg, 2005; Dellefield et al., 2015; Spilsbury et al., 2011); and two measures of hospitalization (Bostick et al., 2006; Grabowski et al., 2008; Spilsbury et al., 2011; Thomas, Mor, Tyler, & Hyer, 2012; Zimmerman et al., 2002). Additionally, I examined nursing home five-star ratings from the Centers for Medicare and Medicaid Services’ (CMS) public reporting system, which incorporates data on health inspections, staffing, and quality (Centers for Medicare and Medicaid Services, 2018). Star ratings reflect nursing home performance relative to other facilities in the same state and have been used in prior studies as a measure of overall quality (Castle & Decker, 2011; Konetzka, Grabowski, Perraillon, & Werner, 2015; Unroe, Greiner, Colón-Emeric, Peterson, & Curtis, 2012).
often been examined concurrently with turnover (Castle, 2008b; Castle & Engberg, 2006; Donoghue, 2009; Thomas et al., 2012). Missed care refers to required patient care left undone and reflects nurses’ needs to prioritize care activities due to resource availability, staffing, patient demand, and other factors (Jones, Hamilton, & Murry, 2015; Kalisch, Landstrom, & Hinshaw, 2009). Missed care has been previously linked with several patient outcomes such as falls, readmissions, and patient satisfaction (Carthon, Lasater, Sloane, & Kutney-Lee, 2015; Jones et al., 2015; Kalisch, Tschannen, & Lee, 2012; Lake, Germack, & Viscardi, 2016). In this study, however, I examine it as a nurse outcome because it has also been found to be a predictor of turnover, intent to leave one’s job, and job dissatisfaction (Jones et al., 2015; Kalisch, Tschannen, & Lee, 2011).
Conceptual Framework
The Institute of Medicine in its landmark To Err is Human report (Institute of Medicine, 2000) identified organizational environment as a key factor influencing patient safety within healthcare systems, and specifically highlighted the role of working
In this study, the interventions are patient care processes done by RNs – i.e. providing leadership, care coordination, and patient surveillance. Because these are processes that are not easily defined by a specific set of tasks or skills, the interventions themselves are not measured. What can be measured is the association of work
environment—a system characteristic—with outcomes, controlling for individual and other system characteristics. This is shown in Figure 2.1.
Figure 2.1. Quality Health Outcomes Model. Adapted from Mitchell et al. (1998)
Aim 1
For Aim 1, I was interested in the association of work environment with patient outcomes measured at the facility level, so I controlled for nursing home characteristics and patient characteristics that also influence outcomes. Since the patient outcome measures were already aggregated to the facility level, I used facility-level patient census data to control for patient characteristics where appropriate. CMS already incorporates some patient level adjustment into the two Nursing Home Compare measures (pressure ulcers and antipsychotics) prior to aggregation (RTI International, 2016) so minimal additional controls were added for those measures. The LTCfocus readmission and hospitalization per resident year measures were not adjusted, so controls were added in those models to account for a nursing home’s overall patient acuity. For Aim 2 looking at nurse outcomes, I controlled for the same nursing home characteristics, but the individual characteristics of interest were those of the nurses, not patients. These nurse characteristics were obtained from the nurse survey.
Innovation
of nursing homes across four states, in contrast to Flynn et al’s study which was limited to New Jersey. I examined a larger number of outcomes including antipsychotic use, 30 day readmission, hospitalizations per resident year, and CMS five-star ratings; and was able to incorporate a broader set of organizational characteristics than what is in Nursing Home Compare by using LTCfocus data. This included being able to look at the
relationship between Medicaid census and nurse work environment which has not been previously done. Furthermore, I completed a subscale analysis of each of the
components of the PES-NWI to determine which aspects of the work environment were most significant for each outcome. Beyond Flynn et al.’s study, other researchers have examined more limited components of the work environment (Anderson et al., 2003; Anderson & McDaniel, 1999; Temkin-Greener et al., 2012; Temkin-Greener et al., 2010; Zuniga et al., 2015a; Zuniga et al., 2015b). By using the PES-NWI, a comprehensive and well-validated National Quality Forum-endorsed measure of the work environment (Lake, 2002, 2007; National Quality Forum, 2004), this study contributes a broader, more comprehensive review of the nursing home work environment to the literature.
environment may contribute to turnover, and how turnover leads to poorer patient outcomes. By doing a subscale analysis of the PES-NWI for each of these outcomes, I was able to glean information on which areas could be best targeted for interventions to reduce turnover.
Aside from the work by Flynn et al. (2010) and Choi et al. (2012) who also used RN4CAST data, other studies of nursing home work environment have relied on surveys of nursing home leadership or samples of workers surveyed through their employers. The key problem with this approach is that it introduces response bias at the
organizational level because employers self-select into or out of the study. The RN4CAST surveys, however, use a unique sampling approach in which nurses are randomly selected based on their state licensure, then contacted directly, rather than through their employers. Nurses then report the name and address of their employer so that their responses can be aggregated to the organization level. Not only does this sampling approach significantly reduce response bias at the organizational level, but it also allows for study of a larger number of healthcare organizations because it eliminates the need to seek Institutional Review Board (IRB) approval from each individual
organization being surveyed.
Clinical Implications
The ability of nursing home operators to alter structural organizational
extensive body of research in hospitals has demonstrated that patients fare better when RNs have strong managers, input into organization affairs, opportunities for advancement and growth, respect for their knowledge and judgements at the bedside, good working relationships with physicians and other colleagues, and adequate resources. Many of these elements can be accomplished through changes in organizational culture and practices.
Nursing homes function under tight budget constraints due to heavy reliance on Medicaid, which is the primary payer of nursing home care and covers 6 out of 10 residents (Kaiser Family Foundation, 2017). The average shortfall between daily Medicaid reimbursement rates and actual cost of care has grown over time, more than doubling from $9.05 in 1999 to $22.46 in 2015 (American Health Care Association, 2016). A daily shortfall of $22.46 means that a nursing home with 100 Medicaid
residents would lose over $800,000 per year just in covering cost of care. With these tight margins, nursing homes will always be constrained in their ability to increase staffing (Harrington, Swan, & Carrillo, 2007), however they could do a much better job of
The last 15-20 years have also seen the level of acuity in nursing homes grow for both short- and long-term residents, meaning that the need for high quality care provided by RNs in this setting has become ever more important. Shortened hospital lengths of stay have created increased demand for institutional post-acute care services (Tyler et al., 2013; Werner & Konetzka, 2018). Simultaneously, less complex individuals primarily in need of long-term custodial care have increasingly sought care in the community as states have supported growth of Medicaid-reimbursed home and community-based long-term care services, leaving those who are sicker and/or have fewer social supports in the nursing home setting (Eiken, Sredl, Burwell, & Woodward, 2017). Many states have also shifted to case-mix based Medicaid reimbursement which has enabled nursing homes to take on more medically complex individuals in need of long-term care (Feng et al., 2006). Despite this growth in acuity, however, nursing homes are still largely financed and staffed as custodial facilities with federal minimum staffing requirements for RNs having remained unchanged for over 30 years (Centers for Medicare & Medicaid Services, 2016).
Program (Centers for Medicare and Medicaid Services, 2017b). This makes the almost $3 billion annual excess spending on hospital care for avoidable adverse events in nursing home patients (Department of Health and Human Services Office of Inspector General, 2014) all the more relevant. Improving nursing home safety and quality is not only essential for patient care, but also vital to ensuring the financial viability of facilities. This study examined the work environment as an area of intervention that not only directly influences patient outcomes, but also serves as an avenue to improve quality and decrease turnover costs.
The evidence around nurse work environment in hospitals (Scott, Sochalski, & Aiken, 1999) led to the development of the Magnet Recognition Program® by the
American Nurses Credentialing Center (ANCC) (American Nurses Credentialing Center, 2017b), a program that recognizes nursing excellence in hospitals. Hospitals that pursue Magnet® recognition have been found to have improvement in patient and nurse
outcomes over time (Kutney-Lee et al., 2015). Magnet® status is now also used as a key measure of hospital quality in the US News & World Report rankings, as well as the
Leapfrog Hospital Survey. A comparable recognition for non-hospital healthcare
Summary
Turnover rates for RNs in nursing homes remain high, despite considerable knowledge about how turnover adversely impacts patients and what causes it. Because elements of the work environment are more modifiable than structural organizational characteristics like ownership structure and Medicaid census, work environment may be an important and tangible area to target to reduce turnover, and improve the quality and safety of care in nursing homes. This study’s use of comprehensive survey data of nurses from four states, using the full PES-NWI and other measures, as well as multiple quality measures from Nursing Home Compare and LTCfocus,provided the unique opportunity to examine the effects of nurse work environment in nursing homes in greater depth than has been studied previously.
Nursing home patients suffer a large number of preventable adverse events due to failure or delay of necessary care, inadequate patient monitoring, or substandard
CHAPTER 3: METHODS
Design
This study was a cross-sectional secondary data analysis of the following linked datasets from 2015: (1) RN4CAST nurse survey data from California (CA), Florida (FL), New Jersey (NJ), and Pennsylvania (PA); (2) the Centers for Medicare and Medicaid Services (CMS) Nursing Home Compare; and (3) LTCfocus, a publically available dataset from the Brown University School of Public Health. The parent study for the RN4CAST nurse survey is titled Panel Study of Effects of Changes in Nursing on
Patient Outcomes (NINR R01-NR014855), and is led by Dr. Linda Aiken at the
University of Pennsylvania School of Nursing. The purpose of the parent study was to collect information on nurse staffing, education, work environment, skill mix, and other organizational factors to study the relationships of such elements to patient outcomes across a large number of health care organizations, including hospitals, nursing homes, and home health agencies. This is a replication of prior studies done in 1999 (Aiken, Clarke, Cheung, Sloane, & Silber, 2003; Aiken et al., 2008; Aiken, Clarke, Sloane, Sochalski, & Silber, 2002) and 2006 (Aiken, Cimiotti, et al., 2011; Aiken et al., 2010; McHugh et al., 2011). The four states were chosen because they are large, geographically diverse states representing over 20% of the US population.
nurse outcomes. While the unit of observation was the nurse, the unit of analysis differed by aim. In Aim 1, the unit of analysis was the nursing home because the outcomes of interest were facility-level patient outcomes. In Aim 2, the unit of analysis was the nurse because the outcomes of interest were individual nurse outcomes.
Data Sources
Patients
Nursing Home Compare. The facility-level patient data for the outcome measures in this study came from two data sources. The first was Nursing Home Compare. This is a publicly available database from CMS that contains provider
information and data on various quality measures for every CMS-certified nursing home in the US. Nursing Home Compare data are extracted from the Minimum Data Set (MDS), the Certification and Survey Provider Enhanced Reports (CASPER) system, and Medicare claims data. The MDS is a federally mandated clinical screening and
assessment tool containing information on a variety of resident characteristics, health, and functional measures that is completed on all residents in CMS-certified nursing homes on admission and then at set time intervals. CASPER contains data collected by state survey teams during nursing homes’ initial certification and annual recertification process. It replaced the Online Survey, Certification, and Reporting (OSCAR) system in 2012.
Compare: (1) MDS-based measures for short-stay residents and (2) MDS-based
measures for long-stay residents. Short-stay residents are those who are receiving short-term skilled nursing care in the nursing home under a Medicare Part A benefit following a hospitalization. Long-stay residents are those not under a Medicare Part A skilled nursing benefit who reside in the nursing home long-term. Data for these measures are extracted from MDS.
The Nursing Home Compare dataset was constructed by merging the provider information file with the MDS second quarter quality measure files. Data in the MDS files were reshaped from long to wide format to organize data at the facility level. Second quarter data were used to match with LTCfocus, which calculates its prevalence estimates based on data from the first Thursday of each April. Nursing Home Compare data were downloaded from the 2015 archived files at https://data.medicare.gov.
Compare, including measures of patient census characteristics, and hospitalization metrics for all nursing home residents, not just short-stay residents. The dataset has been used in multiple prior studies to examine care quality in nursing homes (Berridge, Tyler, & Miller, 2016; Berry et al., 2016; Leland et al., 2015; Mitchell, Mor, Gozalo, Servadio, & Teno, 2016; Rahman, McHugh, Gozalo, Ackerly, & Mor, 2017). Variables from this dataset were used for both covariates and primary outcome measures. The 2015 facility-level LTCfocus file was downloaded from http://ltcfocus.org for analysis.
Nursing Homes
Nurse Survey. Data collection for the parent study took place from January to December 2015. Using a modified Dillman (1978) protocol, Aiken and colleagues surveyed a 30% random sample of actively licensed RNs and a 50% random sample of actively licensed advanced practice nurses (APNs) in each of the four states, creating an initial sample of over 200,000 nurses. They both mailed and emailed surveys to nurses directly, using contact information on file with their state boards of nursing. Nurses were asked to provide their employer name and address in order to link their responses with their employer. The advantage of this sampling method is that it permits study of a large number of healthcare organizations, and eliminates both potential bias and logistical concerns that come with surveying nurses through their employers. Nurses had the option of returning either the paper or electronic survey, and were identified with unique research IDs to identify duplicate responses. They were sent a series of reminder
incentive for completing the survey. In September, individuals who had not yet responded were additionally offered a $10 Amazon gift card as incentive.
The final response rate for the RN survey was 26%. This reflects a growing trend in survey nonresponse (National Research Council, 2013). To evaluate for potential response bias, Aiken and colleagues completed an additional non-responder survey on a random subsample of 1,400 non-responders, achieving an 87% response rate. These individuals received a shorter survey, more intensive attempts to contact participants, more reminders, and a cash incentive. This double-sample approach is considered to be the gold standard for assessing non-response bias (Valliant, Dever, & Kreuter, 2013). There were no significant differences in the work environment measures between long-term care nurse responders and non-responders.
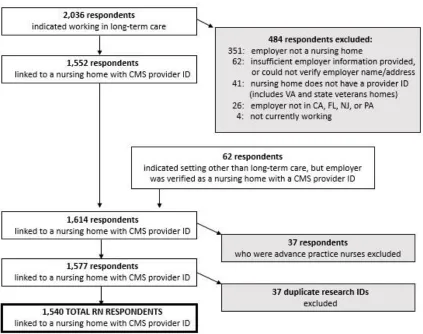
Figure 3.1. Process for obtaining nursing home nurse sample from parent study
in a setting other than long-term care, but their employer was verified to be a CMS-certified nursing home. This resulted in a total of 1,614 respondents linked to
nursing homes with CMS provider IDs. APNs were excluded from the sample because they received a different measure of the work environment than the Practice Environment Scale of the Nursing Work Index (PES-NWI). After duplicate research IDs were
supervisors, directors of nursing, and MDS coordinators (nurses who complete the MDS) have influence over direct and indirect patient care activities.
These 1,540 nursing home RNs were employed by 1,008 nursing homes across the four states, and represented 2.6% of the parent survey’s RN respondents. This is similar to the proportion of RNs who work in nursing homes across the U.S. (U.S. Department of Health and Human Services Health Resources and Services
Administration, 2010). Of the 1,008 nursing homes, 245 facilities had at least two respondents who completed the PES-NWI, and those were distributed across the four states as follows: CA 23 (9.4%), FL 40 (16.3%), NJ 35 (14.3%), PA 147 (60.0%). The large concentration of nursing homes with multiple respondents in PA is likely due to three factors. First, PA had the most respondents, which may be due to some regional association since the study was conducted out of the University of Pennsylvania. Second, nursing home RN staffing requirements vary by state, and of the four states, PA has the strictest staffing requirements, and CA the least (Harrington, 2010). Third, the size and number of nursing homes vary by state. CA has many more facilities, but they tend to be smaller, whereas NJ, PA, and FL have fewer facilities that are generally larger. So CA has the fewest RNs per nursing home employed across a larger number of facilities, whereas PA has the most RNs per nursing home, employed across a smaller number of facilities. Thus, using a state-wide random sample of nurses, one is most likely to find nursing homes with multiple respondents in PA.
home-level measure of the work environment, only nursing homes that had at least 2 respondents with complete data on the PES-NWI were used, for a total of 245 nursing homes. Respondents who did not complete the PES-NWI were slightly older, less likely to report English as their primary language, and more likely to work in a position other than staff RN or nurse manager/administrator compared to respondents who did complete the PES-NWI. No statistically significant differences in the nurse outcomes of interest were found between respondents with and without missing PES-NWI data, however. This suggests that, despite minor demographic difference between the two groups, there was no response bias to suggest that missingness was related to the primary variables of interest.
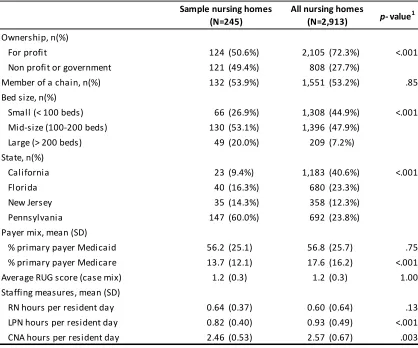
Nursing home data. Nursing home organizational characteristics were obtained from LTCfocus, which pulls data from MDS and CASPER. This included information on ownership structure, chain membership, staffing, Medicare and Medicaid census, case mix, and provided services. Table 3.1 shows a comparison of organizational
characteristics for nursing homes in the study sample compared to all CMS-certified nursing homes in the four states. Sample nursing homes tended to be larger, which was a function of larger facilities employing more nurses and therefore having a higher
no difference in average Medicaid census. There was no difference in average RN staffing, but sample nursing homes did have slightly lower staffing of licensed practical nurses (LPNs) and certified nursing assistants (CNAs). Again, this appeared to be a function of state: CA facilities on average employ the highest number of LPNs and second-to-highest number of CNAs across the four states, but are only minimally represented in the sample. When LPN and CNA staffing for sample nursing homes was
p- value1
Ownership, n(%)
For profit 124 (50.6%) 2,105 (72.3%) <.001
Non profit or government 121 (49.4%) 808 (27.7%)
Member of a chain, n(%) 132 (53.9%) 1,551 (53.2%) .85
Bed size, n(%)
Small (< 100 beds) 66 (26.9%) 1,308 (44.9%) <.001 Mid-size (100-200 beds) 130 (53.1%) 1,396 (47.9%)
Large (> 200 beds) 49 (20.0%) 209 (7.2%)
State, n(%)
California 23 (9.4%) 1,183 (40.6%) <.001
Florida 40 (16.3%) 680 (23.3%)
New Jersey 35 (14.3%) 358 (12.3%)
Pennsylvania 147 (60.0%) 692 (23.8%)
Payer mix, mean (SD)
% primary payer Medicaid 56.2 (25.1) 56.8 (25.7) .75
% primary payer Medicare 13.7 (12.1) 17.6 (16.2) <.001
Average RUG score (case mix) 1.2 (0.3) 1.2 (0.3) 1.00
Staffing measures, mean (SD)
RN hours per resident day 0.64 (0.37) 0.60 (0.64) .13
LPN hours per resident day 0.82 (0.40) 0.93 (0.49) <.001 CNA hours per resident day 2.46 (0.53) 2.57 (0.67) .003
Sample nursing homes (N=245)
All nursing homes (N=2,913)
Table 3.1. Variation in organizational characteristics across sample nursing homes vs. all CMS-certified nursing homes in CA, NJ, FL & PA
1
compared to all facilities in FL, PA, and NJ only (CA excluded), there were no statistically significant differences.
Sample
For Aim 1, the final sample consisted of 245 CMS-certified nursing homes in CA, FL, NJ, and PA. Nursing homes were included in the sample if there were at least 2 RN respondents for the facility who had completed the PES-NWI on the nurse survey. Sample size varied by outcome based on availability of reported outcomes data for facilities (pressure ulcers = 222; antipsychotics = 230; readmissions = 245;
hospitalizations per resident year = 244; five-star rating = 245).
For Aim 2, the sample included 692 RNs employed in the above 245 CMS-certified nursing homes. All RN respondents employed by the facility were included in the nurse sample, regardless of whether they completed the PES-NWI, as long as they provided data on the outcome of interest. Again, sample size varied by outcome based on availability of nurse-reported outcome & covariate data (job dissatisfaction = 656 RNs in 244 nursing homes; intent to leave = 663 RNs in 245 nursing homes; retention = 674 RNs in 245 nursing homes; burnout = 577 RNs in 245 nursing homes; missed care = 674 RNs in 245 nursing homes).
Major Study Variables
Nurse Work Environment
nurse manager ability, leadership, and support of nurses; (4) staffing and resource adequacy; and (5) collegial nurse-physician relationships. Nurses were asked to report the degree to which various organizational features were present in their work setting, using a 4 point Likert scale ranging from strongly disagree to strongly agree. Mean scores for each subscale were determined, and then these were averaged to create a composite measure. Scores ranged from 1 to 4, with higher scores indicating better work environments. Nurses’ responses on the 5 subscales were aggregated to the nursing home level to create a continuous organizational-level measure of the work environment
(Rousseau, 1985; Verran, Gerber, & Milton, 1995). The continuous measure was then transformed into a 3 category variable such that nursing homes in the bottom 25 percent were categorized as having “poor” work environments, the middle 50 percent “average” work environments, and the upper 25 percent “good” work environments.
The PES-NWI has been previously validated in the nursing home setting, with internal consistency coefficients (Cronenbach’s α) found to be highly internally
consistent for both the composite score (α = 0.95), as well as each of the 5 subscales (α = 0.83-0.89) (Flynn et al., 2010). Additionally, intraclass correlation coefficients
demonstrated good agreement among nurses within nursing homes for both the composite score (0.68) and the subscales (0.55-0.75). This validation process was
Patient Outcomes (Aim 1)
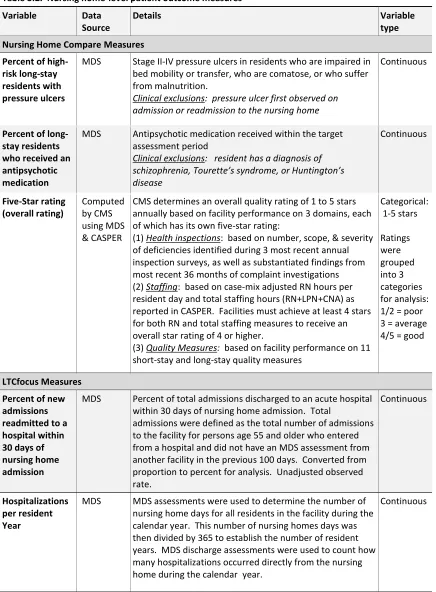
The dependent variables in Aim 1 were facility-level patient outcomes extracted from Nursing Home Compare and LTCfocus. The pressure ulcer, antipsychotic, and five-star measures came from Nursing Home Compare (Centers for Medicare and Medicaid Services, 2017a; RTI International, 2016) while the 30 day hospital readmission and hospitalizations per resident year measures came from LTCfocus (Brown University School of Public Health, 2018). CMS began reporting a 30 day hospital readmission measure in Nursing Home Compare in April 2016 (Abt Associates, 2016), but since this was after the time period in which the nurse survey was completed, I opted to use the LTCfocus readmission measure which was available for 2015. The key difference between the two hospitalization measures is that the 30 day readmission measure only captures rehospitalization for new admissions to the nursing home, whereas the hospitalizations per resident year measure captures all hospitalizations from the facility for both short- and long-stay residents. The latter gives a better indication of how the facility is able to manage acute illness for its general patient population. Table 3.2
Table 3.2. Nursing home-level patient outcome measures
Variable Data
Source
Details Variable
type
Nursing Home Compare Measures
Percent of high-risk long-stay residents with pressure ulcers
MDS Stage II-IV pressure ulcers in residents who are impaired in bed mobility or transfer, who are comatose, or who suffer from malnutrition.
Clinical exclusions: pressure ulcer first observed on admission or readmission to the nursing home
Continuous
Percent of long-stay residents who received an antipsychotic medication
MDS Antipsychotic medication received within the target assessment period
Clinical exclusions: resident has a diagnosis of schizophrenia, Tourette’s syndrome, or Huntington’s disease Continuous Five-Star rating (overall rating) Computed by CMS using MDS & CASPER
CMS determines an overall quality rating of 1 to 5 stars annually based on facility performance on 3 domains, each of which has its own five-star rating:
(1) Health inspections: based on number, scope, & severity of deficiencies identified during 3 most recent annual inspection surveys, as well as substantiated findings from most recent 36 months of complaint investigations (2) Staffing: based on case-mix adjusted RN hours per resident day and total staffing hours (RN+LPN+CNA) as reported in CASPER. Facilities must achieve at least 4 stars for both RN and total staffing measures to receive an overall star rating of 4 or higher.
(3) Quality Measures: based on facility performance on 11 short-stay and long-stay quality measures
Categorical: 1-5 stars Ratings were grouped into 3 categories for analysis: 1/2 = poor 3 = average 4/5 = good
LTCfocus Measures
Percent of new admissions readmitted to a hospital within 30 days of nursing home admission
MDS Percent of total admissions discharged to an acute hospital within 30 days of nursing home admission. Total
admissions were defined as the total number of admissions to the facility for persons age 55 and older who entered from a hospital and did not have an MDS assessment from another facility in the previous 100 days. Converted from proportion to percent for analysis. Unadjusted observed rate.
Continuous
Hospitalizations per resident Year
MDS MDS assessments were used to determine the number of nursing home days for all residents in the facility during the calendar year. This number of nursing homes days was then divided by 365 to establish the number of resident years. MDS discharge assessments were used to count how many hospitalizations occurred directly from the nursing home during the calendar year.
The above MDS measures are all unadjusted, meaning that they reflect the
facility-level observed outcome rate without any adjustment with patient-level covariates. CMS has built a limited number of clinical exclusions into the pressure ulcer and
antipsychotic measures so that nursing homes are not held accountable for outcomes that are out of their control (e.g. outcomes that are present on admission to the facility or clinically unavoidable). These exclusions are detailed in the table above. CMS also excludes residents who have missing data on any of MDS items used to construct the measures (RTI International, 2016).
The methodology used by CMS to determine five-star ratings does incorporate risk adjustment within the 3 domains used to calculate the overall rating. Health
inspection scores are based on relative performance of facilities within a state, such that nursing homes with the top 10 percent scores receive 5 stars, the middle 70 percent receive 2, 3, or 4 stars with an equal number in each category, and the bottom 20 percent receive 1 star. The staffing score is based on case-mix adjusted staffing ratios where
Hours adjusted = (Hours reported / Hours expected) * Hours national average
The quality measure score is based on several quality measures that are similarly adjusted by the national average so that:
Rate adjusted = (Rate observed / Rate expected) * Rate national average
own metric, but also a national average. This approach assumes that all facilities are similar with the same average performance (Mukamel, Glance, Dick, & Osler, 2010), but what has been found is that adjusted rates for providers with small volumes of patients have disproportionate shrinkage to the national average, and significantly underestimate observed rates in these instances (Mukamel et al., 2010; Silber et al., 2010). That is, for small volume providers, the adjusted rate becomes more a function of the national
average than the provider’s own performance. With these limitations known, the five-star rating system is still the best global measure available currently to measure overall quality in nursing homes (Castle & Ferguson, 2010).
Nurse outcomes (Aim 2)
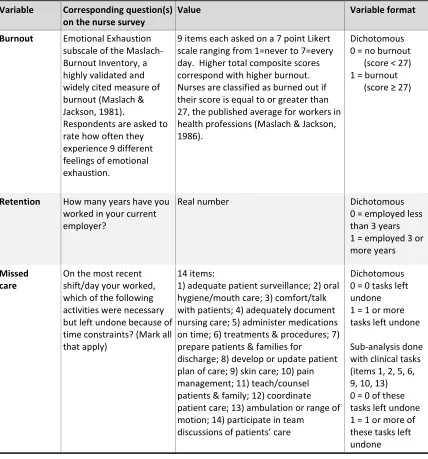
The dependent variables in Aim 2 were individually reported nurse outcomes from the nurse survey. Table 3.3 shows each of the nurse outcomes with the
corresponding question(s) on the survey. Nurse outcomes were determined from all nurses employed in sample nursing homes who responded to the corresponding question, regardless of whether they completed the PES-NWI.
Table 3.3. Nurse outcome measures
Variable Corresponding question(s) on the nurse survey
Value Variable format
Job
dissatisfaction
How satisfied are you with your primary job?
4 point Likert scale ranging from 1=very satisfied to 4=very dissatisfied
Dichotomous 0 = satisfied (1 or 2) 1 = dissatisfied (3 or 4)
Intent to leave
Do you plan to be with your current employer one year from now?
Yes/No Dichotomous
Table 3.3. Nurse outcome measures (continued)
Variable Corresponding question(s) on the nurse survey
Value Variable format
Burnout Emotional Exhaustion subscale of the Maslach-Burnout Inventory, a highly validated and widely cited measure of burnout (Maslach & Jackson, 1981).
Respondents are asked to rate how often they experience 9 different feelings of emotional exhaustion.
9 items each asked on a 7 point Likert scale ranging from 1=never to 7=every day. Higher total composite scores correspond with higher burnout. Nurses are classified as burned out if their score is equal to or greater than 27, the published average for workers in health professions (Maslach & Jackson, 1986).
Dichotomous 0 = no burnout (score < 27) 1 = burnout (score ≥ 27)
Retention How many years have you worked in your current employer?
Real number Dichotomous
0 = employed less than 3 years 1 = employed 3 or more years
Missed care
On the most recent shift/day your worked, which of the following activities were necessary but left undone because of time constraints? (Mark all that apply)
14 items:
1) adequate patient surveillance; 2) oral hygiene/mouth care; 3) comfort/talk with patients; 4) adequately document nursing care; 5) administer medications on time; 6) treatments & procedures; 7) prepare patients & families for
discharge; 8) develop or update patient plan of care; 9) skin care; 10) pain management; 11) teach/counsel patients & family; 12) coordinate patient care; 13) ambulation or range of motion; 14) participate in team
discussions of patients’ care
Dichotomous 0 = 0 tasks left undone 1 = 1 or more tasks left undone
Sub-analysis done with clinical tasks (items 1, 2, 5, 6, 9, 10, 13) 0 = 0 of these tasks left undone 1 = 1 or more of these tasks left undone
Covariates
Table 3.4. Covariates – measurement of nursing home organizational characteristics Variable Data Source Description
Covariates for all regression models For profit
status
CASPER Dichotomous variable indicating whether the nursing home was for profit where 0 = not for profit or government and 1 = for profit
Chain membership
CASPER Dichotomous variable indicating whether the nursing home was owned or leased by a multi-facility (chain) organization, where 0 = not part of a chain and 1 = part of a chain
Medicaid census
CASPER Continuous variable indicating the proportion of facility residents whose primary support was Medicaid at the time of annual survey
Medicare census
CASPER Continuous variable indicating the proportion of facility residents whose primary support was Medicare at the time of annual survey
RN skill mix CASPER Continuous variable indicating the ratio of the number of RN full time equivalents (FTEs) divided by the number of RN FTEs plus LPN FTEs. Data are cleaned in LTCfocus when the reported FTEs are implausible, and verified against facility data from prior years.
Additional covariate used for pressure ulcers, antipsychotics, and five-star rating
CNA staffing CASPER Continuous variable indicating CNA hours per resident day. LTCfocus computes this by converting FTEs into hours, and then dividing the total number of CNA hours by the number of residents in the facility. Data are cleaned in LTCfocus when the reported FTEs are implausible, and verified against facility data from prior years.
conceptually, CNAs play significant roles in pressure ulcer prevention and behavior management in nursing homes. In the analysis, however, CNA staffing showed poor correlation with both outcomes (r < 0.1), though it was significantly associated with antipsychotics in the bivariate regressions. CNA staffing was also controlled for in the five-star rating models because that measure is used along with RN and LPN staffing to compute the five-star staffing subscale, which factors into the overall rating for a nursing home.
Nursing home patient characteristics (Aim 1). In addition to the structural organizational characteristics above, additional covariates reflecting patient census characteristics were incorporated into models for three outcomes. These variables are summarized in Table 3.5. The pressure ulcer measure was already restricted by CMS to high risk residents with no wound present on admission to the facility, so no further nursing home level adjustment was made for that outcome. The antipsychotic measure
Table 3.5. Covariates – measurement of nursing home patient characteristics Variable Data Source Description
Five-star rating & pressure ulcers
No patient characteristics added
Antipsychotics Presence of Alzheimer’s unit
CASPER Dichotomous variable indicating whether the nursing home had an Alzheimer’s special care unit where 0 = no unit and 1 = unit
Hospital readmissions & hospitalizations per resident year Case mix
index
MDS Continuous variable representing the average Resource Utilization Group Nursing Case Mix Index, (a measure of the relative intensity of care of different nursing home populations) for all residents present on the 1st Thursday in April.
Accepts ventilator-dependent residents
MDS Dichotomous variable indicating whether the nursing home had any residents present on the 1st Thursday in April who were on a ventilator,
was similarly limited by CMS to a select population of residents without schizophrenia, Tourette’s syndrome, or Huntington’s disease, however I did add an additional covariate in that model indicating whether the facility had an Alzheimer’s special care unit. This was to account for the fact that nursing homes with these units are likely to accept
individuals with dementia who have more severe symptoms of psychosis. For both of the hospitalization measures, I incorporated two covariates to control for overall facility patient acuity. These covariates were overall case-mix using the average Resource Utilization Group Nursing Case Mix Index (RUGS NCMI), and an indicator of whether the facility accepted ventilator-dependent patients.
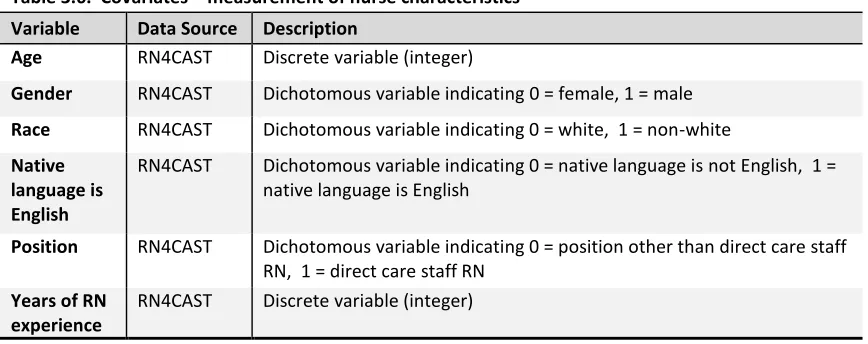
Nurse characteristics (Aim 2). Nurse characteristics came from the nurse survey and are summarized in Table 3.6. Again, these were chosen based on a review of the literature and were determined through examination of correlations and bivariate regressions to be related to the independent and dependent variables of interest.
Table 3.6. Covariates – measurement of nurse characteristics Variable Data Source Description
Age RN4CAST Discrete variable (integer)
Gender RN4CAST Dichotomous variable indicating 0 = female, 1 = male
Race RN4CAST Dichotomous variable indicating 0 = white, 1 = non-white
Native language is English
RN4CAST Dichotomous variable indicating 0 = native language is not English, 1 = native language is English
Position RN4CAST Dichotomous variable indicating 0 = position other than direct care staff RN, 1 = direct care staff RN
Years of RN experience
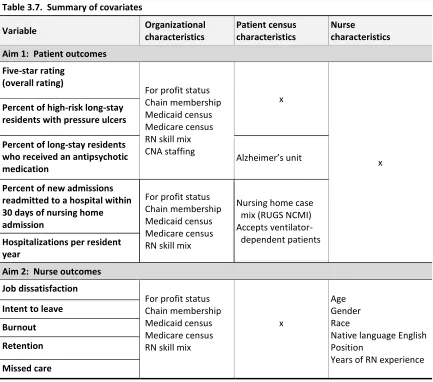
Summary. A summary of all covariates for the five patient outcomes and five nurse outcomes is shown in Table 3.7.
Table 3.7. Summary of covariates
Variable Organizational
characteristics
Patient census characteristics
Nurse
characteristics
Aim 1: Patient outcomes
Five-star rating (overall rating)
For profit status Chain membership Medicaid census Medicare census RN skill mix CNA staffing
x
x
Percent of high-risk long-stay residents with pressure ulcers
Percent of long-stay residents who received an antipsychotic medication
Alzheimer’s unit
Percent of new admissions readmitted to a hospital within 30 days of nursing home admission
For profit status Chain membership Medicaid census Medicare census RN skill mix
Nursing home case mix (RUGS NCMI) Accepts ventilator- dependent patients
Hospitalizations per resident year
Aim 2: Nurse outcomes
Job dissatisfaction
For profit status Chain membership Medicaid census Medicare census RN skill mix
x
Age Gender Race
Native language English Position
Years of RN experience
Intent to leave
Burnout
Retention
Missed care
Analytic Approach
Aim 1