Iran J Public Health, Vol. 47, No.6, Jun 2018, pp.893-900
Original Article
Socio-demographic Determinants of Household Food Insecurity
among Iranian: A Population-based Study from Northwest of
Iran
Jafar Sadegh TABRIZI
1, Leila NIKNIAZ
2, Homayoun SADEGHI-BAZARGANI
3,
Mostafa FARAHBAKHSH
4, *Zeinab NIKNIAZ
51. Tabriz Health Services Management Research Center, Faculty of Management and Medical Informatics, Tabriz University of Medical Sciences, Tabriz, Iran
2. Tabriz Health Services Management Research Center, Tabriz University of Medical Sciences, Tabriz, Iran
3. Road and Traffic Injury Research Center, Dept. of Statistics and Epidemiology, Faculty of Health, Tabriz University of Medical Sciences, Tabriz, Iran
4. Research Center of Psychiatry and Behavioral Sciences, Tabriz University of Medical Sciences, Tabriz, Iran 5. Liver and Gastrointestinal Diseases Research Center, Tabriz University of Medical Sciences, Tabriz, Iran
*Corresponding Author: Email: znikniaz@hotmail.com
(Received 04 Mar 2017; accepted 19 Aug 2017)
Introduction
Food insecurity is a serious public health problem because individuals’ health, well-being, and quality of life are linked to their household food security. Adults in food-insecure households have higher
rates of chronic illnesses such as obesity, depres-sion, diabetes, and heart disease (1-3). Further-more, in the context of food insecurity the man-agement of chronic diseases is also compromised (4, 5).
Abstract
Background: We aimed to evaluate the household food security status and associated factors in East-Azerbaijan, Iran (urban and regional areas).
Methods: Data (n=1385) as a part of the major lifestyle promotion project conducted in northwest of Iran were collected in 2015, by short form of the Household Food Security Scale consisting six questions. The Chi-square and Logistic regression were used to for statistical analysis.
Results: The prevalence of food insecurity was 58.4%. The rate of food insecurity in the residents of capital city (59.7%) was higher than those of residents of regional cities (57.18%), however, this difference was not statistically significant (P=0.36). The respondents with family size more than 3 (P=0.01), unemployed (0.001) and married (0.01) respondents and the ones with lower education levels (P<0.001) were significantly more food insecure than other respondents. After adjusting for depending factors, the marital status, household size, educational level and the employment status of the head of the family had significant association with food security.
Conclusion: Family size, employment status and educational level of the head of the family were significant predictors of food insecurity. Policymakers should focus on increasing minimum education levels and employ-ment situations to decrease food insecurity.
Food insecurity is a frequent problem in both de-veloped and developing countries (6-8). World-wide, owing to various social, economic and envi-ronmental disparities, more than 850 million peo-ple face food insecurity (9). While in the USA, 85.7% of American households were food secure throughout the entire year in 2013 (10), in South Africa only 48% of South African were food se-cure (11). Moreover, the correlates of food insecu-rity were investigated in different courtiers. In ru-ral areas of Malaysia, household food insecurity was significantly correlated with household size, educational level and employment status (12). In Uganda, household size, educational level, and employment status were the main determinants of food insecurity (13).
In Iran, there have been major improvements over the last three decades in reducing food insecurity and Iran has had the greatest reduction in global hunger index (GHI) ranking in the Middle East. However, there were limited up-to-date studies in Iran, which tackle the issue of food security. In Tehran, about 16% of had low and very low food security status (14). In Ray City, Iran, the house-hold food insecurity prevalence was 55% (15), in Yazd, 33% (16), Asadabadi region of Tabriz (North-west of Tabriz), 36.3% (8), and Arak, 73.4%, which had significant association with age, sex, educational level of the head of the family and the socioeconomic status of the family (17). Most of the studies regarding prevalence of food insecurity were conducted in central cities of Iran and also limited data is available about the deter-minant of food insecurity in Iran. According to the importance of the effect of food security on health and quality of life, this study was conducted with the aim of determining the prevalence of food in-security in East-Azerbaijan (north-west of Iran) and also investigating its association with various social-demographic characteristics.
Materials and Methods
Research designData were collected in 2015 as a part of the major lifestyle promotion project (LPP) conducted in the districts of East Azerbaijan (urban and regional
parts), one of the largest provinces of Iran. This study was conducted by probability proportional to size (PPS) multistage stratified cluster sampling through which 150 clusters selected. In PPS sam-pling, the selection probability for each element was set to be proportional to its size measure. The sampling frame was based on the postal code frame of the national post office, updated yearly. The clusters were selected in this system based on postal code. Each address in this system was sum-marized in a 10-digit postal code number. In urban areas, clusters comprise one to several blocks or parts of blocks. Blocks were usually attached buildings.
For sample size calculation, based on predicted prevalence rates of 26% (8), confidence interval of 95%, study power of 80%, attrition rate of 20%, sample size was calculated to be 1320. However, 1500 people involved because of the variety of the measured variables.
After determining the cluster start point, enroll-ment and data collection was started. In each clus-ter, 10 participants were enrolled (1500 partici-pants). This began from the household at the clus-ter start point and continued toward the other households until the required number of partici-pants enrolled. Consecutive households were se-lected based on the geographical location of build-ings to the right-hand side of each building. Re-search survey and examination teams visited households, according to previously arranged ap-pointments.
Exclusion of incomplete questionnaire yielded 1385 final sample, subjected to statistical analysis. The final sample consisted of 656 the capital city (Tabriz) residents and 717 regional (cities and rural areas) [including Marand, Mianeh, Varzegan, Khodafarin, Bonab, Osku and Ilkhichi] residents. All procedures performed in this study were in ac-cordance with the ethical standards of the Ethics Committee of Tabriz University of Medical Sci-ence (registration number: 1394.383) and with the 1964 Helsinki declaration and its later amend-ments or comparable ethical standards. Moreover, informed consent was obtained from all individual participants included in the study.
The research data were collected through two questionnaires through face-to-face interviews. The first questionnaire included questions regard-ing the socio-demographic characteristics, includ-ing age, gender, educational level, marriage status and residential area. The second questionnaire was the short form of the Household Food Security Scale consisting six questions (Table 1). This ques-tionnaire was validated internationally (18, 19) in the local language previously (8). Responses of
“often” or “sometimes” on questions Q5 and Q6, “yes” on Q1, Q3 and Q4 are coded as affirmative (yes). Responses of “almost every month” and “some months but not every month” on Q2 are coded as affirmative (yes). The sum of affirmative responses to the six questions in the module is the household’s raw score on the scale if the partici-pants affirmed the two or more of the six items, they were considered food insecure.
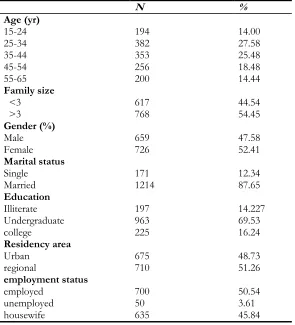
Table 1: Demographic characteristics of the participants (n=1385)
N %
Age (yr) 15-24 25-34 35-44 45-54 55-65
194 382 353 256 200
14.00 27.58 25.48 18.48 14.44 Family size
<3
>3 617 768 44.54 54.45
Gender (%) Male
Female 659 726 47.58 52.41
Marital status Single
Married 171 1214 12.34 87.65
Education Illiterate Undergraduate college
197 963 225
14.227 69.53 16.24 Residency area
Urban regional
employment status employed
unemployed housewife
675 710
700 50 635
48.73 51.26
50.54 3.61 45.84
Data Collection
Data was collected based on interviews by a team of trained health professionals. Research survey and examination teams visited households accord-ing to previously arranged appointments. All par-ticipants were interviewed to obtain socio-demo-graphic characteristics and the food security ques-tions.
Statistical analysis
Results
Mean age of the participants was 39.47±13.05 years. Approximately, 52% of the participants were female, 16.24% of them had a college degree, 87.65% of them were married and 50.54% of them were employed. About 48.73 % of participant lived in the capital city (Tabriz) (Table 1).
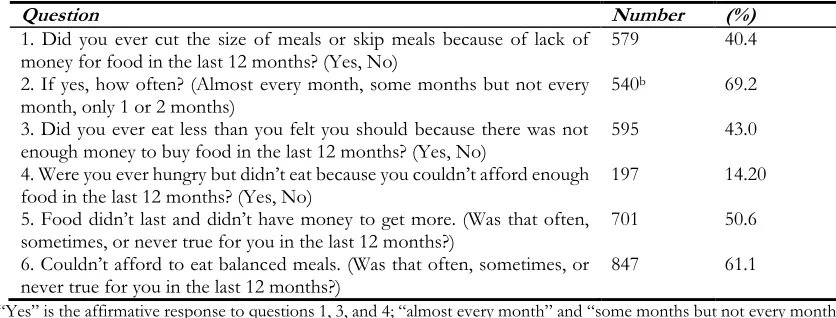
Generally, 58.4% (809) of participants were food insecure and 41.6% (576) of them were food se-cure. About 61% of respondent could not afford to eat balanced diet (consists of all major food groups). Moreover, 50% of them affirmed that the food did not last and often did not have money to get more foods. About 40% of participants cut the size of meal or skip meals because of the lack of money for the food in the last 12 months. About 43% of the participants affirmed that they eat less than their felt because of the lack of money (Table 2).
Table 2: Affirmative responses to individual items on the short food security questionnaire a
Question Number (%)
1. Did you ever cut the size of meals or skip meals because of lack of
money for food in the last 12 months? (Yes, No) 579 40.4
2. If yes, how often? (Almost every month, some months but not every
month, only 1 or 2 months) 540
b 69.2
3. Did you ever eat less than you felt you should because there was not
enough money to buy food in the last 12 months? (Yes, No) 595 43.0
4. Were you ever hungry but didn’t eat because you couldn’t afford enough
food in the last 12 months? (Yes, No) 197 14.20
5. Food didn’t last and didn’t have money to get more. (Was that often,
sometimes, or never true for you in the last 12 months?) 701 50.6
6. Couldn’t afford to eat balanced meals. (Was that often, sometimes, or
never true for you in the last 12 months?) 847 61.1
a. “Yes” is the affirmative response to questions 1, 3, and 4; “almost every month” and “some months but not every month” are affirm-ative responses to question 2; “often” and “sometimes” are affirmaffirm-ative responses to questions 5 and 6. Two or more affirmaffirm-ative responses to the questions indicate food insecurity
b. total samples size for this item is 579 (responders who had affirmation response to item 1)
The food security status of respondents according to their socio-demographic status shows in Table 1. The 45-54 yr old responders, females, respond-ents with the family size more than 3, residrespond-ents of the capital city, unemployed respondents and the ones with lower education levels were more food insecure than other respondents. The Chi-square test showed the significant differences in insecu-rity status of females (versus males), married (ver-sus singles), respondents with household size >3 (versus household size<3), unemployed respond-ents (versus employed ones) and low educated re-spondents (versus higher educated ones).
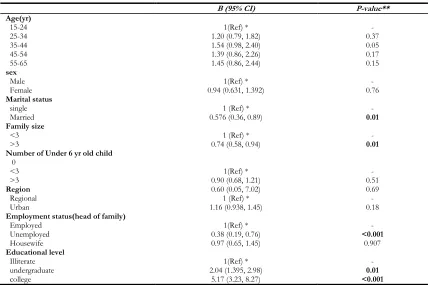
Table 3 presents the logistic regression coefficient for the association between food security status and demographic factors. It is apparent from this table that after adjusting for depending factors, the
Table 3: Food security status of participant according to their socio-demographic status
Food security status Food secure
NO (%) Food Insecure NO (%) P-value*
Total 576 (41.6) 810 (58.4) -
Age (yr) 15-24 25-34 35-44 45-54 55-65 84 (43.29) 163(42.68) 152 (43.05) 99 (38.67) 78 (39) 110 (56.70) 219 (57.32) 201 (56.93) 157 (61.32) 122(61) 0.20 Family size <3
>3 280 (45.38) 296 (38.54) 337 (54.61) 472 (61.45) 0.01
Gender (%)
Male
Female 291 (42.23) 285 (39.25) 368 (57.76) 441 (60.74) 0.06
Marital status
Single
Married 490 (40.36) 86 (50.29) 724 (59.63) 85 (49.70) 0.01
Residency area
Urban regional
employment status
employed or self-employed unemployed housewife Education Illiterate Undergraduate college 272 (40.29) 304 (42.81) 321 (45.80) 13 (26) 242 (38.11) 50 (25.38) 383 (39.77) 143 (63.55) 403 (59.70) 406 (57.18) 379 (54.14) 37 (74) 393 (61.88) 147 (74.61) 580 (60.22) 82 (36.44) 0.36 0.001 <0.001
*P-value of chi-square // P-value<0.05 is considered as a significance level
Table 4: Logistic Regression coefficient for the association between food security and demographic factors
B (95% CI) P-value**
Age(yr)
15-24 1(Ref) * -
25-34 35-44 45-54 55-65
1.20 (0.79, 1.82) 1.54 (0.98, 2.40) 1.39 (0.86, 2.26) 1.45 (0.86, 2.44)
0.37 0.05 0.17 0.15
sex
Male 1(Ref) * -
Female 0.94 (0.631, 1.392) 0.76
Marital status
single 1 (Ref) * -
Married 0.576 (0.36, 0.89) 0.01
Family size
<3 1 (Ref) * -
>3 0.74 (0.58, 0.94) 0.01
Number of Under 6 yr old child 0
<3 >3
Region
1(Ref) * 0.90 (0.68, 1.21) 0.60 (0.05, 7.02)
- 0.51 0.69
Regional 1 (Ref) * -
Urban
Employment status(head of family)
Employed Unemployed Housewife Educational level Illiterate undergraduate college
1.16 (0.938, 1.45)
1(Ref) * 0.38 (0.19, 0.76) 0.97 (0.65, 1.45)
1(Ref) * 2.04 (1.395, 2.98)
5.17 (3.23, 8.27)
0.18 - <0.001 0.907 - 0.01 <0.001
Discussion
According to the importance of food security in health and quality of life, the present study was de-signed to determine the prevalence and associated factors of food security status in East-Azerbaijan, Iran. Generally, of 1385 responders, about 58.3% (810) were food insecure. The prior study in one distinct of Tabriz, Iran reported the prevalence of food insecurity about 36.3% (8). The observed dis-crepancy between these results may be due to the timing of studies and differences in study popula-tion. The food security status of only one distinct of Tabriz was studied (Asadabadi Medical Centre) however; we included a large sample of the capital city and regional cities population of East-Azer-baijan province.
57.18% of surveyed regional households and 59.70% of capital city households were food inse-cure. A study on 7158 households (2496 rural and 4662 urban) in Iran observed 87% of rural houholds and 71% of urban househouholds were food se-cure (20). In another study, 40.4% of studied rural households were food secure and 59.6% of them were food insecure in northwest of Iran (21). In northeast of Iran, 40.9% of surveyed rural house-holds were food secure (22). Food insecurity in Tabriz City was higher than regional areas which may be due to high rate of immigration from rural areas to urban areas. This group may experi-ence increasing rates of unemployment and poverty, disease, inadequate educational re-sources, and declining availability and/or acces-sibility to adequate health andsocial services In the present study, food insecurity was associ-ated with the number of household members, which is consistent with the results of other stud-ies (13, 23, 24). The observed relationship between the household size and food insecurity is may be due to the fact that in situations, such as rise in the price of food or temporary joblessness, the bigger the household is the lower the amount of food each household member consumes.
In the term of the association between educational level and food security status, this study produced results which corroborate the findings of other
studies in this field (24). The observed relationship between education level and food insecurity may be attributed to the fact that people with higher education have higher income and therefore can provide enough food much more easily than oth-ers.
Confirming those of another study in Tabriz (24), the result of the present study showed that food insecurity is negatively associated with the employ-ment status of the head of the family. The em-ployed head of the family can provide enough food for their family members much more easily than others. However; being a housewife was not a significant factor associated with household food insecurity. Contrary to this result, being a wife was a significant factor associated with house-hold food insecurity in Malaysia (12).
The main strength of the present study was a large sample size from different urban and regional ar-eas that serve quite different populations. Besides, a validated questionnaire was used for measuring food security status. One of the main limitations of the present study that might influence the find-ings is the cross-sectional design of the study, which implies that no causal inferences could be made about the demographic determinants of food insecurity.
Conclusion
Ethical considerations
Ethical issues (Including plagiarism, informed consent, misconduct, data fabrication and/or fal-sification, double publication and/or submission, redundancy, etc.) have been completely observed by the authors.
Acknowledegements
The authors wish to thank the East Azerbaijan Provincial Health Center, Tabriz Health Services Management Research Center at Tabriz University of Medical Sciences and Eastern Azerbaijan Gov-ernor General for financial support.
Conflict of interest
The authors declare that there is no conflict of in-terests.
References
1. McLeod L, Veall M (2006). The dynamics of food insecurity and overall health: evidence from the Canadian National Population Health Sur-vey. Appl Econ, 38: 2131-2146.
2. Fuller-Thomson E, Nimigon J (2008). Factors associated with depression among individuals with chronic fatigue syndrome: findings from a nationally representative survey. Fam Pract, 25:414-22.
3. Gucciardi E, Vogt JA, DeMelo M et al (2009). An exploration of the relationship between household food insecurity and diabetes mellitus in Canada. Diabetes Care, 32:2218– 2224.
4. Anema A, Vogenthaler N, Frongillo EA et al (2009). Food insecurity and HIV/AIDS: current knowledge, gaps, and research priorities. Curr HIV/AIDS Rep, 6: 224-231. 5. Marjerrison S, Cummings EA, Glanville NT et al
(2011). Prevalance and associations of food insecurity in children with diabetes mellitus. J Pediatr, 158:607-611.
6. Qasemi H (1998). Food security programme in Islamic Republic of Iran. Tehran: Institute of Food and Nutrition Research.
7. Carlson SJ, Andrews MS, Bickel GW (1999). Measuring food insecurity and hunger in the United States: development of a national benchmark measure and prevalence estimates. J Nutr, 129(2S Suppl):510S-516S. 8. Dastgiri S, Tutunchi H, Ostadrahimi
A, Mahboob S (2007). Sensitivity and specificity of a short questionnaire for food insecurity surveillance in Iran. Food Nutr Bull, 28:55-58.
9. Food Agriculture Organization (2001). The state of food insecurity in the world. http://www.fao.org/docrep/003/y1500e/y1 500e00.htm
10. Coleman-Jensen A, Gregory C, Singh A (2014). Household food security in the United States in 2013. USDA-ERS Economic Research Report. https://www.ers.usda.gov/webdocs/publicat ions/45265/48787_err173.pdf?v=42265 11. Sorsdahl K, Slopen N, Siefert K et al (2011).
Household food insufficiency and mental health in South Africa. J Epidemiol Community Health, 65:426-431.s
12. Shariff ZM, Khor GL (2008). Household food insecurity and coping strategies in a poor rural community in Malaysia. Nutr Res Pract, 2:26-34. 13. Chaput J-P, Gilbert J-A, Tremblay A (2007). Relationship between food insecurity and body composition in Ugandans living in urban Kampala. J Am Diet Assoc, 107:1978-1982. 14. Hasan-Ghomi M, Mirmiran P, Asghari G et al
(2015). Food security is associated with dietary diversity: Tehran Lipid and Glucose Study. Nutr Food Sci Res, 2:11-18.
15. Payab M, Motlagh A-rD, Eshraghian M et al (2014). The association of family food security and depression in mothers having primary school children in Ray-Iran. J Diabetes Metab Disord, 13:65.
16. Eshraghian M, Siassi F, Jazayeri G (2007). Obesity and food security in Yazd primary school students. Tehran Univ Med J, 65:68-76.
17. Najafianzadeh M, Mobarak-Abadi A, Ranjbaran M et al (2015). Relationship between the prevalence of food insecurity and some socioeconomic and demographic factors in the rural households of Arak, 2014. Iran J Nutr Sci food Tech, 9:35-44.(In Persian)
household food security scale in a Caribbean community. BMC Public Health, 4:22.
19. Marques ES, Reichenheim ME, de Moraes CL et al (2015). Household food insecurity: a systematic review of the measuring instruments used in epidemiological studies. Public Health Nutr, 18:877-892.
20. Mohammadi F, Omidvar N, Houshiar-Rad A et al (2012). Validity of an adapted Household Food Insecurity Access Scale in urban households in Iran. Public Health Nutr, 15: 149-157.
21. Sharafkhani R, Dastgiri S, Gharaaghaji R et al (2010). The role of household structure on the
prevalence of food insecurity. Eur J Gen Med, 7:385-388.
22. Gholami A, Foroozanfar Z (2015). Household food security status in the Northeast of Iran: a cross-sectional study. Med J Islam Repub Iran, 29:227.
23. Townsend MS, Peerson J, Love B et al (2001). Food insecurity is positively related to overweight in women. J Nutr, 131:1738-45. 24. Dastgiri S, Mahdavi R, TuTunchi H et al (2006).