ESTIMATION OF OPTICAL ACCESS NETWORK BANDWIDTH
DEMAND USING MONTE CARLO SIMULATION
Branka Mikavica1, Valentina Radojičić2, Aleksandra Kostić-Ljubisavljević3
1, 2, 3 University of Belgrade, Faculty of Transport and Traffic Engineering, Vojvode Stepe 305, 11000 Belgrade, Serbia
Received 23 October 2015; accepted 30 November 2015
Abstract: Continuous forecast of bandwidth demand in order to achieve a proper network planning and dimensioning is one of the key challenges that network operators need to deal with. The importance of this issue is highlighted with the necessity of proper decision making regarding capital investments and the permanent increase in traffic volume. Under-investing in network resources lead to low network performances and hence dissatisfied customers, while over-investing may cause over-dimensioned capacities which leads to lower resource utilization and opportunity losses. In that perspective, it is essential to determine whether current network capacities satisfy bandwidth requirements. If it does, determining relevant time period is of great significance. As the bandwidth demand increases by the development of new services, the existing broadband networks need to be upgraded. The growing bottleneck can be solved rolling out optical access network. These networks are characterized by greater bandwidth supply enhancement compared to bandwidth demand. That fact emphasizes the need of appropriate bandwidth forecast. This paper presents model for in optical access networks future bandwidth demand and network resource utilisation estimation. In order to appropriately address valid demand of all households in a given area, Monte Carlo simulation is applied.
Keywords:optical access network, bandwidth, demand, estimation, Monte Carlo simulation.
1. Introduction
The permanent growth of customers’ traffic, caused by emerging rich-content high-rate and bursty applications, such as video on demand, HDTV (High Definition Television), real time video, online gaming, file sharing and cloud computing, is supported by bandwidth improvement of broadband access networks. It is expected that traffic will not only increase in volume, but will also manifest high bustiness, resulting in large variations over time and direction by Kretsis et al. (2014). These phenomena can only be managed with the abundant capacity provided by optical networks. In particular,
and operational expenditures. Thus, the upgrade plan indicates what investments are needed at each point in time. Capital expenditures needed to upgrade the network from one migration step to another as well as estimation of annual operational expenditures are part of the solution. The best deployment plan should minimize the total costs and maintain optimal technical performances.
In order to properly obtain optical access network deployment plan, several aspects need to be analysed. Some of them are: type of premises, type of environment (city, open residential, rural, single households or multi-dwelling units), appropriate network design (Greenfield, Brownfield and Overbuild), network architecture and dimensioning, costs of infrastructure deployment and costs for the network operation and maintenance.
Premise is a household or business residence. In a multi-dwelling unit each household refers to one premise. Customer is a premise connected to a network and uses at least one service on this connection under a commercial contract according to FTTH Council - Definition of Terms (2015). System bringing optical fibre close to the customer premises refers as FTTP (Fibre to the Premises). FTTP is a generic term where optical fibre replaces copper in the access network. The deployment of fibre closer to the customer may require the fibre infrastructure located on public or private properties. Physical environment, country conditions, nature of the site and current telecommunication technology are key factors in deciding the most appropriate network design and architecture. Possible scenarios are Greenfield, Brownfield and Overbuild. Greenfield refers to the situation where network infrastructure is simultaneously designed and deployed with
buildings construction. When buildings are already in place but the existing infrastructure is low quality, Brownfield model is deployed. Another possible solution is Overbuild which means upgrading of the existing infrastructure. The choice of deployment method for optical access network is determined with capital and operational costs and reliability of the network. Major functional requirements which optical access network need to satisfy are provision of high-bandwidth services and content to each customer, a flexible network architecture design capable to meet future demand and to support future network upgrades. Optical access network constitutes a fibre-based access network, connecting numerous customers to an access node or point of presence (POP). Each access node contains the necessary active equipment. Different network architectures are possible depending on the number of customers, position of splitters and aggregation points. Variations of FTTP solutions include Fibre to the Home (FTTH), Fibre to the Building (FTTB), Fibre to the Curb (FTTC) and Fibre to the Distribution Point FTTDp.
optical access network architecture where the final connection to the customer’s premises is a physical medium other than fibre. The communications path is terminated within the building for the purpose of provisioning services for a single building with potentially multiple customers. In order to be classified as FTTB, optical access network need to satisfy these requirements: the fibre must enter the building, or terminate either on an external wall of the building or no more than two meters from an external wall of the building according to FTTH Council - Definition of Terms (2015). Another solution allows that fibre enter at least at one building within a cluster of buildings on the same property, or terminate on an external wall of one building within a cluster of buildings or no more than two meters from an external wall of one building within a cluster of buildings on the same property. Each optical termination box is connected by a dedicated fibre to a port in the equipment in the POP, to an optical splitter which uses shared feeder fibre to the POP. In order to utilize existing fibres deployed in particular topologies, switches are, in some cases placed in the building and they are interconnected (not individually connected to the POP). FTTC imply that each switch/or DSLAM (Digital Subscriber Line Access Multiplexer) is connected to the POP via a single fibre or a pair of fibres. This architecture is often referred as Active Ethernet, since it requires active network elements in the field. FTTDp is the solution with connection of the POP to the Distribution Point via optical cable and then from the Distribution Point to the customer’s premises via existing copper infrastructure. Due to virtually unlimited scalability, FTTH deployments are considered as target architectures in long term by Tahon et al. (2014). Thus, all further considerations given in this paper refer to FTTH.
Network planning and design are of great importance from technical and business perspective. In order to minimize financial risk, large investments in appropriate planning are required. Improved network planning is a key for investment optimization and enhancement of profits. Thus, careful network planning improves business case and leads to a cost efficient, scalable network that can be effectively realized, managed and maintained.
Network design addresses appropriate selection of nodes which are going to be included in the network, topology of the connections between these nodes, determination of transmission and switching systems to deploy and equipment at a particular node. Network planning addresses traffic balancing, including selection how particular traffic flow should be routed, protected, groomed, and what wavelength in the system spectrum should be assigned to carry it. Network planning is being performed in two time-scales: long-term and real-time network planning according to Simmons (2014). The long-term planning as a rule occurs before a network is deployed and it consists of a large set of requirements processing simultaneously. In the case of real-time network planning, time interval between planning and provisioning is short and requirements are processed one at a time. It is assumed that traffic flows must be accommodated using available equipment currently deployed in the network.
refers to structural decisions for a particular geographic planning. These decisions include the placement of network functions and a preliminary cost of materials, including the installation lengths of cables and ducts as well as quantities for the various types of hardware. The goal is to adopt the lowest cost network plan within the boundaries established by the strategic planning. Detailed network planning includes network documentation preparation that can be passed to engineering departments or construction companies by Bauschert et al. (2014). The planning of a communication network depends on the quality of the planning tool and the demand forecasting. Network design and its routing policies are based on the traffic volume estimation that might be routed through the network in the future. Considering all difficulties related to adequate forecasting the traffic volume, one of the greatest challenges in network planning is dealing with traffic uncertainty by Song and Kuipers (2014). If this issue is not addressed appropriately, the network operator is often exposed to overprovisioning and underutilization, resulting in higher costs. Also, any mechanism that can lead to higher utilization without effect on reliability and quality of service will result in higher revenues. One of the approaches toward better network utilization is introducing flexibility into the network. However, regardless of the level of network flexibility, traffic is generally stochastic in nature. This is especially notable in large networks, where an accurate view of link parameters such as bandwidth utilization or latency is difficult to obtain.
In order to properly perform network dimensioning and thus make correct investment decisions, considering permanent increase in traffic volume, operators must continuously forecast growth of bandwidth demand, according to Harstead and Sharpe
(2015). Often cited sources for bandwidth demand forecasting are Jacob Nielsen’s Law of Internet Bandwidth (2014) and Cisco Visual Networking Index (2015). Nielsen’s Law indicates a 50 percent year-over-year growth in a customers’ connection speed. However, this does not describe bandwidth demanded, but peak demanded offered according to Harstead and Sharpe (2015). Cisco Virtual Networking Index forecasts that overall IP traffic will grow at a compound annual growth rate of 23 percent from 2014 to 2019. Nevertheless, it is useful for traffic growth rates, but it measures only regional demand, not at the customer or access level and without distinction between downstream and upstream traffic according to Harstead and Sharpe (2015).
In this paper, bandwidth demand in Greenfield network model is analysed applying Monte Carlo simulation. The aim of our research is to focus on available contents and their minimal required bandwidth, which enables maintenance of customers’ satisfaction. Relevant parameter in the analysis is content popularity factor, indicating customers’ preferences and probability of access to a specific content. Obtained results show that this model can be a basis for appropriate network dimensioning and planning. From business perspective, this model offers insight in operator’s compromises regarding decisions in network investment.
application and discussion of obtained results. Concluding remarks are given in Section 6.
2. Content Provisioning in Optical Access
Networks
Optical Access Network enables provisioning of a number of different layers, as shown in
Fig. 1: the passive infrastructure involving ducts, fibres, enclosures, outside plants, the active network using electrical equipment, the retail services providing connectivity and managed services, and customers. Additional layer located above the retail services layer and the customers is content layer. This can be exploited by content providers.
Passive infrastructure (trenches, ducts and fibre)
Active network (network equipment, business and operation support)
Retail services (residential, public and business) Customers
Fig. 1.
Optical Network Layers
Source: FTTH Council - Handbook (2014)
The technological structure described above has implications on FTTH network organization and operation. Passive infrastructure involves physical elements required to build the optical network. It includes fibre, trenches, ducts and poles on which it is deployed, fibre enclosures, optical distribution frames, patch panels and splicing shelves. Activities on this layer also include network route planning, right-of-way negotiations as well as civil works used to install the fibre. Active network refers to electronic network equipment and operational support systems required to
the owner of the active equipment. Retail services are provided by ISP (Internet Service Providers).
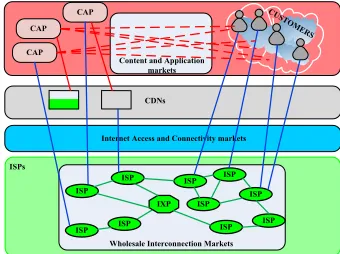
Players on the content layer can be distinguished according to a specific functionalities on Content and Application Prov iders (CA Ps) and Content and Application Customers, different types of Internet Service Providers (ISPs) as well as Content Delivery Networks (CDN) according to BER EC Report BoR (12) 130 (2012). Usually, these players perform different combinations of functionalities. In that sense, content and application customers may provide content and applications at the same time, depending on whether or to what degree an operator’s business model implies vertical integration. Contractual relations between these players on Content layer of an optical network are illustrated in the Fig. 2. Both CAPs and customers interact as producers on the content and applications market, as shown by the red lines on the Fig. 2. ISPs enable access to the CAPs and to the customers (blue lines on the Fig. 2). Interconnection between ISPs is enabled on the wholesale level (green area in the Fig. 2).
Generally, Internet consists of interconnected networks, known as AS (Autonomous Systems), forming a common network layer for traffic exchange between CAPs and customers. This distinction of application and network layers is essential and has recently been termed “over the top” provision. Hence, mutual interactions of CAPs and customers are carried out at the application layer. CAPs create and aggregate content including web pages, blogs, movies, photos, and/or applications including search engines, messaging applications. In order to provide content to the customers, interconnection between CAPs and ISPs is necessary. Hosting services may also be needed by CAPs. CAPs main functionality is content creation and aggregation. Also, they can establish their own hosting capabilities or deploy their own network infrastructure. CAPs encompass numerous different players such as: platforms enabling transactions (e.g. Amazon, eBay, etc.), social platforms (e.g. Facebook), search engines (e.g. Google, Bing), live and on-demand radio and video services (e.g. broadcasters), entertainment services (e.g. Youtube, Dailymotion, etc.), application providers (e.g. Skype), video on demand (e.g. Netflix).
ISP CAP
CAP
CUSTOMERS
Internet Access and Connectivity markets
Wholesale Interconnection Markets ISPs
Content and Application markets
ISP
ISP
ISP ISP ISP ISP ISP
ISP ISP IXP
CDNs CAP
Fig. 2.
Term content customer refers to both residential and business customers of a broadband access in their function of passively consuming content. Generally, Content and Application customers form downstream traffic volume in consuming the content provided by the CAPs. This can be provided by over-the-top providers or by the ISPs of the Content and Application customers. Overlapping between Content and Application customers and CAPs is possible. Players that predominantly act as customers may, in certain situations, act as CAPs and provide content and services or applications, e.g. Youtube videos, Internet blogs, etc. Customers can generate revenues using their connections for actions on different product markets, such as selling on eBay. Also, government agencies provide services over the Internet, e-Government. These different types of customers provide their services and products over-the-top, as this is done independently from the connectivity functionality provided by ISPs. Retail Content and Application customers are private households whereas business users may range from small to large business and industry customers.
Generally, term ISP is related to operators selling broadband access and connectivity to the Internet at the retail level and at the wholesale level through transit and other forms of interconnection. They provide connectivity for different types of customers, whether it is Content Application Customer or CAPs. In accordance to the main customer group, ISPs can be classified as: Eyeball ISPs, Backbone ISPs and other ISPs.
Eyeball ISPs predominantly enable connectivity to Content and Application customers on the retail broadband and Internet access market as core functionality.
Additional functionalities include enabling connectivity to CAPs and providing services over the customers’ broadband connection bundled with the Internet access that competes with over-the-top providers. One of the goals of the provisioning of these additional services can be enhancement of customers’ loyalty. Also, ISPs may provide their own over-the-top content and applications.
Backbone ISPs provide transit services for other ISPs. Mainly, they provide wholesale services for third parties. However, vertical interconnection in order to provide connectivity to large customers is also possible.
Other ISPs primarily provide connectivity to CAPs. They generate revenues from the provision of connectivity to CAPs. In order to enable content provisioning to the customers, these ISPs need to unsure upstream capacity through transit or peering arrangements. This function is similar to functions of Eyeball ISPs.
CDNs’ servers are placed at various locations at the network edges in order to enable efficient access from any customers’ location. Thus, better performances are assured by replicating content over the mirrored servers with the aim of dealing with irregularities in content requests. Thus, stored content is protected from unauthorised modification. Customers are being redirected to the servers nearest to them. This approach reduces network impact on the response time of customers’ requests. Customers’ perceived service quality, e.g. when web browsing videos, is enhanced by the reduced networks’ impact on the end-to-end quality of service. Different services provided by CDNs are targeted at the different types of content, such as video services, game services, software distribution updates, which content providers distribute. Each type of content has its own characteristics, such as data volume, upstream and or downstream traffic, peak traffic, for which different CDNs can provide added value. There is a wide variety of CDN providers, ranging from CDNs providing only core functionalities, via providers operating as a network, network providers and ISPs, CAPs, to equipment and solution vendors that are also positioning in the market.
3. Review of Monte Carlo Simulation
Application in Optical Networks
Monte Carlo simulation is a numerical stochastic process, a sequence of random events. Generally, the outcome of a random event can be mapped into a numerical value. Monte Carlo simulation involves deliberate usage of random numbers in a calculation that has the structure of a stochastic process, which comprises a sequence of states whose evolution is determined by random events according to Kalos and Whitlock (2008).
The application of Monte Carlo simulation is widespread in many scientific areas.
Expansion of bandwidth demanding services and applications have led to exponential growth of Internet traffic. Uncertainty in predicting the sources of this traffic is increased due to ever changing models of content providers over the Internet. To properly address this challenge, Elastic Optical Networks (EON) may be a solution. These are flexible and adaptive networks equipped with flexible transceivers and network elements that can adapt to the actual traffic needs by Gerstel et al. (2012). Bandwidth fragmentation is one of the essential issues in EONs. The effect of bandwidth fragmentation on the blocking probability in EONs is addressed by Weiran et al. (2013). Their theoretical model forecasts trend of blocking probability changes with bandwidth fragmentation and it reveals the relation among the blocking probability, bandwidth fragmentation, requested bandwidth distribution and spectrum utilization. In order to verify the theoretical analysis, Monte Carlo simulations are performed.
In order to evaluate the availability of complex network structures with possible dependent failures Monte Carlo simulation can be used according to Wosinska et al. (2009). Optical transport network represents backbone of modern communication systems. Due to their ubiquitous deployment, these networks are disposed to failures. The availability of optical transport networks using Monte Carlo sampling techniques is analysed by Booker et al. (2008).
common resource can cause multiple failures. Failure of common resource usually occurs due to physical force and causes failures of multiple links. The impact of physical length of previously mentioned group of links on network availability can be evaluated using Monte Carlo simulation. This issue is considered by Miletic et al. (2013).
Different technology options are available to operators for FTTH network deployment strategy decisions. There are numerous technical, economic and business drivers that affect the right choice for each specific network situation. Determination of key parameters that are critical to the decision making in modelling network economics is often challenging, especially in a network model with a large number of parameters. Operator must take a risk of choosing an incorrect technology if any of key parameters are not identified and cost optimized. In order to obtain so far as possible accurate results, cost parameters can be analysed using Monte Carlo simulations, as suggested by Kulkarni et al. (2010).
Although FTTH introduction has many benefits, many operators are reluctant to roll out FTTH infrastructure due to its high investment costs. A possible solution may be involvement of local community in FTTH deployment. A detailed techno-economic study with cost/benefit analysis is necessary. As the introduction of a new technology involves a lot of uncertainties, determination of the most inf luencing parameters is essential. In order to obtain general forecast of the outcome, Monte Carlo simulation is used by Lannoo et al. (2008).
Optical wireless communication refers to transmission in unguided propagation media through the use of optical carriers,
in visible, infrared and ultraviolet bands. These are widely referred to as free space optical (FSO) communication. FSO systems enable high bit rate communication between two fixed points over distances up to several kilometres. Despite the major advantages of FSO technology and variety of its application areas, its widespread use is restricted by its low link reliability particularly in long ranges due to atmospheric turbulence-induced fading and sensitivity to weather conditions. However, the channel delay spread as a result of beam scattering due to fog or rain is shown as insignificant by Grabner and Kvicera (2014), who used Monte Carlo simulations to quantify delay spread.
Investment potential and risk analysis of FTTH deployment is considered and compared with FSO by Rokkas et al. (2014). The tariffs, broadband penetration, price of FSO components and network operation cost where identified as parameters with the greatest impact to the project. For each of the selected parameter, the default value, the upper and lower limits, the optimistic, the pessimistic value and the confidence interval are determined. The distribution of these parameters was the input for Monte Carlo simulations.
Bandwidth demand forecasting using Monte Carlo simulations is observed by Harstead and Sharpe (2015) in order to quantify the number of concurrent video streams, the shifting mix of standard definition, high definition, and ultra-high definition resolutions, multicast gain, and the trend from multicast to unicast delivery of these streams. However, this research neglects other content types and its inf luence on overall bandwidth demand. Also, the probability of access to these contents has not been considered. The aim of this paper is to obtain realistic results for total bandwidth demand in content provisioning with consideration of content popularity.
4. Problem Statement
In this paper we propose algorithm for bandwidth demand estimation. We assume optical access network deployment in a certain geographic area. Estimation of total bandwidth demand necessary for delivering available contents in the periods of high and normal traffic load is performed applying Monte Carlo simulation. Greenfield scenario of network deployment is assumed. The total number of customer premises on a given territory is denoted by N. Under-investing in network resources lead to low network performances, while over-investing cause low resource utilization. Thus, network planning and dimensioning must be appropriately determined in order to enable efficient network resource utilization. In order to appropriately estimate bandwidth demand and obtain essential data for network planning and dimensioning, provisioning of contents with high bandwidth requirements is considered. Mostly, these are video contents, participating with 80-90% of global Internet traffic, according to Cisco
(2015). Let us assume a set of contents available to the customers by C = {c1, c2, ... cm}. Each content ci, ii∈ (1,
( )
,1mm) requires acertain minimal bandwidth denoted with di, which assures that customers’ experience in content provisioning is satisfactory. One of the most important parameter related to content provisioning demand is content’s popularity. Estimation of content popularity is very helpful for provider’s business processes. There are numerous different patterns for content popularity evolution, making its prediction difficult according to Jiqiang et al. (2014). Before customer makes decision to access to certain content, there is an underlying process to disseminate all available information about that content. Also, availability of some form of recommendation, whether it is via direct marketing, customer-target marketing or word-of-mouth via social networking is used in forming that decision. Once a customer becomes aware of the content availability, he/ she makes an independent decision about the access to certain content, based on interest level and other factors such as availability of other choices. This represents the customer reaction process. These processes establish certain content’s popularity. In this paper, we introduce the content ci, popularity factor denoted by qi. It is assumed that 1
1 =
∑ =
m
i qi in order to indicate the probability that customers will require access to certain content.
Fig. 3.
Number of Simultaneous Requests for Content Provisioning per Premise in Normal Traffic Load Period Accordingly, the number of simultaneous
requests for a content provisioning for each premise in normal traffic load period is determined by Poisson distribution with the parameter λ= ,12, as described in the
analysis of Harstead and Sharpe (2015). The resulting probability distribution for normal traffic load is shown in Fig. 4.
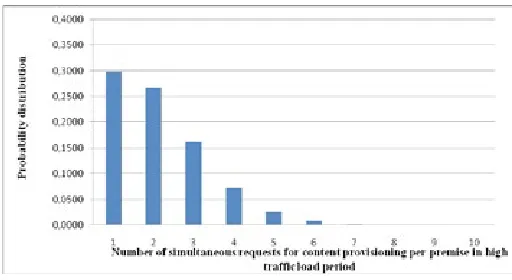
For eac h pre m i se, t he nu mber of simultaneous requests in the period of high traffic load is randomly selected according to the probability distribution shown in Fig. 3. In the case of normal traffic load, the number of simultaneous requests per premise is randomly selected according to the probability distribution shown in Fig. 4.
Fig. 4.
Number of Simultaneous Requests for Content Provisioning per Premise in High Traffic Load Period The next step is to determine which request
refers to which content applying Monte Carlo simulation. The discrete distribution determining the type of the content is function of the content popularity factor
content is obtained multiplying minimal required bandwidth for a given content with total number of simultaneous requests for that content provisioning. The total bandwidth demand is obtained as a sum
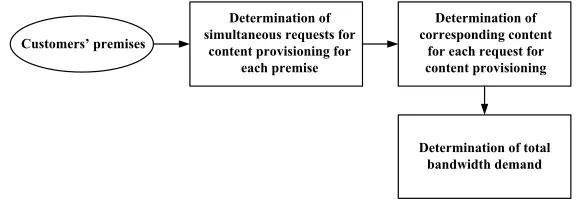
of all bandwidth demands for all content types. The algorithm for determination of total bandwidth demand in certain area we propose in our research is schematically given in the Fig. 5.
5. Numerical Example
We assumed that observed geographical area consists of N = 50 premises. This assumption can represent either residential area or small enterprises with N different premises included in it. Residential area can
be observed as the suburb area with separated households, or as a single multi-dwelling unit. Greenfield scenario is assumed. We also assumed that there are five content types available to the customers i = 1, 2,..., 5. Minimal required bandwidth corresponding to the certain content i is given in Table 1.
Table 1
Assumed Minimal Required Bandwidths Corresponding to the Contents
Content i 1 2 3 4 5
Minimal required bandwidth
for content i (Mb/s) 2,2 1,3 3,2 0,8 4,7
Discrete distribution of the content popularity factor is assumed to be as shown in (1):
1, 0
5 3 , 0
4 3 , 0
3 2 , 0
2 1, 0
1
(1)
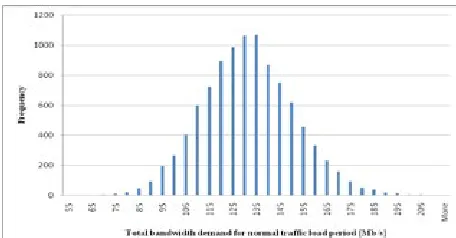
Bandwidth demand is estimated using Monte Carlo simulations, applying 10 000 iterations for both normal and high traffic load period. Fig. 6 shows total bandwidth demand in
the period of normal traffic load. These results present frequency of estimated total bandwidth appearance in 10 000 iterations. For the assumed values of minimal required bandwidth corresponding to the contents, it can be noted that maximal frequency of bandwidth demand is around 135 Mb/s. Extreme values for total bandwidth demand have low frequency. Hence, these data can be essential for network planning and dimensioning since network utilization can be estimated.
Customers’ premises
Determination of simultaneous requests for
content provisioning for each premise
Determination of corresponding content
for each request for content provisioning
Determination of total bandwidth demand
Fig. 5.
Fig. 6.
Total Bandwidth Demand for Normal Traffic Load Period
Total bandwidth demand for the period of high traffic load is shown in Fig. 7. Comparing obtained results with the results obtained for period of normal traffic load, the
total bandwidth demand has higher values, as expected to be. The most frequently requested bandwidth is approximately 195 Mb/s.
Fig. 7.
Total Bandwidth Demand for High Traffic Load Period
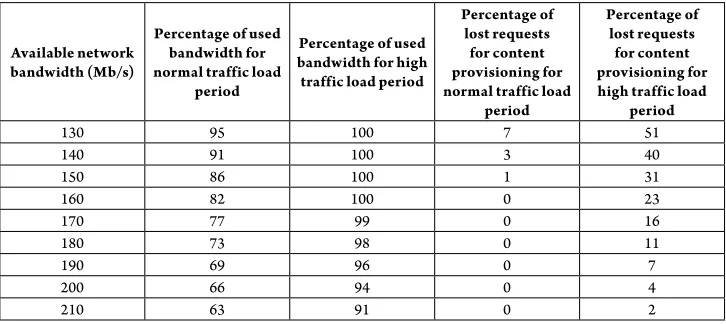
According to the assumed minimal required bandwidth for corresponding content and estimated bandwidth demand using proposed algorithm, network resource utilization is shown in Table 2.
Network resource utilization as a function of assumed network capacity in the periods of normal and high traffic load is presented. This table also shows percentage of lost requests for content provisioning in observed
network according to simulation results obtained in our numerical example.
Table 2
Analysis of Network Resource Utilization According to Monte Carlo Simulation
Available network bandwidth (Mb/s)
Percentage of used bandwidth for normal traffic load
period
Percentage of used bandwidth for high traffic load period
Percentage of lost requests
for content provisioning for normal traffic load
period
Percentage of lost requests for content provisioning for high traffic load
period
130 95 100 7 51
140 91 100 3 40
150 86 100 1 31
160 82 100 0 23
170 77 99 0 16
180 73 98 0 11
190 69 96 0 7
200 66 94 0 4
210 63 91 0 2
Insufficient network capacity leads to high percentage of lost requests for content provisioning. That situation increases costs in the form of penalties for noncompliance of network requirements. However, high network capacity leads to over-provisioning and low resource utilization. In the numerical example given in this paper, optimal network capacity would be 200 Mb/s. This value provides enough resources to satisfy customers’ requirements even in the period of high traffic load period. Also, it has acceptably low percentage of lost requests for content provisioning.
6. Conclusion
Continuous growth of bandwidth demand in telecommunication networks is supported by improvement of broadband access and emerging services. Previous estimations for traffic volume are exceeded. This challenge requires solutions enable to satisfy future bandwidth demands. Considering advantages of optical access networks over other access solutions regarding bandwidth supply, these networks are seen as long-term solution.
However, deployment of optical networks requires high investments. Network planning and dimensioning are of great importance for investment optimization. Operators need realistic data of bandwidth demand in order to avoid under-provisioning and over-provisioning. Both situations increase costs and lead to inefficient resource utilization.
This paper presents model for bandwidth demand estimation in optical access network. Residential area with Greenfield network deployment is observed. Content popularity factor is introduced as a relevant parameter in content provisioning analysis. This factor enables an insight in customers’ preferences and its impact in bandwidth demand. In order to obtain realistic bandwidth demand, Monte Carlo simulation is used. Model proposed in this paper is convenient for estimation of network resource utilization in the periods of normal and high traffic load periods.
operators need to accomplish in order to create network capable to meet bandwidth demand and profitability of such network will be the subject for future work.
Acknowledgements
This work is partially supported by Ministry of Education, Science and Technological Development of the Republic of Serbia under No. 32025.
References
Bauschert, T.; Büsing, C.; D’Andreagiovanni, F.; Koster, A.C.A.; Kutschka, M.; Steglich, U. 2014. Network Planning under Demand Uncertainty with Robust Optimization, IEEE Communications Magazine. DOI: http://dx.doi.org/10.1109/MCOM.2014.6736760, 52(2): 178-185.
BEREC Report BoR (12) 130. 2012. Available from Internet: <http://berec.europa.eu/eng/document_ register/subject_ matter/berec/reports/1130-an- assessment-of-ip-interconnection-in-the-context-of-net-neutrality>.
Booker, G.; Sprintson, A.; Singh, C.; Guikema, S. 2008. Efficient availability evaluation for transport backbone networks. In Proceedings of International Conference on Optical Network Design and Modeling (ONDM). DOI: http:// dx.doi.org/10.1109/ONDM.2008.4578386, 1-6.
Cisco Visual Networking Index. 2015. Available from Internet: <http://www.cisco.com/c/en/us/solutions/ collateral /service-provider/ip-ngn-ip-next-generation-network/white_paper_c11-481360.pdf>.
FTTH Council - Definition of Terms. 2015. Available from Internet: <http://www.ftthcouncil.eu/documents/ Publications/ FTTH _ Def inition_of_Terms-Revision_2015-Final.pdf>.
FTTH Council - Handbook. 2014. Available from Internet: <http://www.ftthcouncil.eu/documents/ Publications/FTTH-Handbook_2014-V6.0.pdf>.
Gerstel, O.; Cisco, I.; Jinno, M.; Lord, A.; Yoo, S.J.B. 2012. Elastic Optical Networking: A New Dawn for the Optical Layer?, IEEE Communications Magazine. DOI: http://dx.doi.org/10.1109/MCOM.2012.6146481, 50(2): 12-20.
Grabner, M.; Kvicera, V. 2014. Multiple scattering in rain and fog on free-space optical links, IEEE/OSA Journal of Lightwave Technology. DOI: http://dx.doi.org/10.1109/ JLT.2013.2294356, 32(3): 513-520.
Harstead, E.; Sharpe, R. 2015. Forecasting of Access Network Bandwidth Demands for Aggregated Subscribers Using Monte Carlo Methods, IEEE Communications Magazine. DOI: http://dx.doi. org/10.1109/MCOM.2015.7060505, 53(3): 199-207.
Jiqiang, W.; Yipeng, Z.; Dah Ming, C.; Youwei H.; Zirong Z. 2014. Modeling Dynamics of Online Video Popularity. Available from Internet: <http://arxiv.org/ pdf /1412.2326.pdf>.
Kalos, M.H.; Whitlock, P.A. 2008. Monte Carlo Methods, Wiley Black Well. 217 p.
Kretsis, A.; Christodoulopoulos, K.; Kokkinos, P.; Varvarigos, E. 2014. Planning and Operating Flexible Optical Networks: Algorithmic Issues and Tools,
IEEE Communications Magazine. DOI: http://dx.doi. org/10.1109/MCOM.2014.6710065, 52(1): 61-69.
Kulkarni, S.; El-Sayed, M.; Gagen, P.; Polonsky, B. 2010. FTTH network economics: Key parameters impacting technology decisions. In Proceedings of the 13th International
Lannoo, B.; Casier, K.; Van Ooteghem, J.; Wouters, B.; Verbrugge, S.; Colle, D.; Pickavet, M.; Demeester, P. 2008. Economic Benefits of a Community Driven Fiber to the Home Rollout. In Proceedings of the 5th International
Conference on Broadband Communications, Networks and Systems (BROADNETS). 436-443.
Miletic, V.; Mikac, B.; Dzanko, M. 2013. Impact Evaluation of Physical Length of Shared Risk Link Groups on Optical Network Availability Using Monte Carlo Simulation. In Proceedings of European Conference on Optical Cabling and Infrastructure (OC&I). 249-256.
Nielsen’s Law of Internet Bandwidth. 2014. Available from Internet: <http://www.nngroup.com/articles/ law-of-bandwidth>.
Reyes, R.; Rong, Z.; Mas Machuca, C. 2014. Advanced Dynamic Migration Planning toward FTTH, IEEE Communications Magazine. DOI: http://dx.doi. org/10.1109/MCOM.2014.6710067, 52(1): 77-83.
Rokkas, T.; Katsianis, D.; Kamalakis, T.; Varoutas, D.; Sphicopoulos, T. 2014. Evaluation of FSO and FTTH technologies using techno-economic a nd r isk a na lysis, Info. DOI: ht t p://d x .doi. org/10.1108/14636690910955006, 11(3): 87-96.
Serena, P.; Rossi, N.; Bertolini, M.; Bononi, A. 2009. Stratified Sampling Monte Carlo Algorithm for Efficient BER Estimation in Long-Haul Optical Transmission Systems, Journal of Lightwave Technology. DOI: http:// dx.doi.org/10.1109/JLT.2008.2010560, 27(13): 2404-2411.
Simmons, J.M. 2014. Optical Network Design and Planning. Springer, Inc. USA. 529 p.
Song, Y.; Kuipers, F.A. 2014. Traffic Uncertainty Models in Network Planning, IEEE Communications Magazine. DOI: http://dx.doi.org/10.1109/MCOM.2014.6736759, 52(2):172-177.
Tahon, M.; Ooteghem, J-V.; Casier, K.; Verbrugge, S.; Colle, D.; Pickavet, M.; Demeester, P. 2014. Improving the FTTH business case – A joint telco-utility network rollout model, Telecommunications Policy. DOI: http:// dx.doi.org/10.1016/j.telpol.2013.01.004, 38(5-6): 426-437.
Weiran, S.; Zuqing, Z.; Mingyang, Z.; Ansari, N. 2013. On the Effect of Bandwidth Fragmentation on Blocking Probability in Elastic Optical Networks, IEEE Transactions on Communications. DOI: http://dx.doi. org/10.1109/TCOMM.2013.053013.120853, 61(7): 2970-2978.