Evolving Water Resources Systems: Understanding, Predicting and Managing Water–Society Interactions Proceedings of ICWRS2014, Bologna, Italy, June 2014 (IAHS Publ. 364, 2014).
345
Characterization of sub-daily rainfall properties in three
raingauges located in northeast Brazil
J. V. COUTINHO, CRISTIANO DAS N. ALMEIDA, ANGELO M. F. LEAL &
LUIS R. BARBOSA
Federal University of Paraíba, Av. Cap. João Freire, 620, CEP: 58.041-060 – João Pessoa, PB, Brazil
almeida74br@yahoo.com.br
Abstract This paper aims to evaluate the characteristics of rainfall events of three experimental basins located in northeast Brazil. The study areas are located, one in Ceará State and two in Paraíba State. Thus, the definition of rainfall events was based on two characteristics: minimum inter-event time and minimum event depth. Then, they were classified according to the shape of the hyetograph: to the left rectangular, triangular, and triangular with peak, and to the right, bimodal and unshaped. Evaluation of the percentages of each type of hyetograph and the main characteristics of rainfall events (peak, duration and intensity) was carried out. The results shows that the two experimental basins located in the semi-arid region have similar characteristics, and shapeless events have significant accumulated rainfall.
Key words rainfall events; hyetograph; classification
INTRODUCTION
According to Dunkerley (2008a), in order to better understand the rainfall, in terms of hydrology and geomorphology, less attention has been paid to rain event properties such as duration, mean and peak rain rate than to rain properties such as drop size or kinetic energy. For this reason, the rainfall simulation is often based on high rainfall rates, and many of the rates employed (in several instances exceeding 150 mm h-1) appear to have limited relevance to ordinary field conditions. Dunkerley
(2008a) considers that the definition and analysis of the properties of rainfall events and its spatiotemporal variability are essential for the development of a correct interpretation of the different rainfall types in different geographic regions (e.g. tropical convective rain, dryland thunderstorm rain) and their impacts on environmental processes.
As support for this understanding, Dunkerley (2008b) carried out an analysis of the minimum inter-event time (MIT), in order to check the influence of this variable on the definition of rainfall events and their consequent influence on the average rainfall rate. A 5-year pluviograph record located in an arid area was analysed, and MIT ranged from 15 minutes to 24 hours. Thus, the number of rain events ranged from 550 to 118, and the mean rainfall rate declined from 2.04 mm h-1 to 0.94
mm h-1. Then, the study points out to the importance of the definition of MIT, so that different studies
carried out by different researchers in different areas can be compared.
In order to analyse the spatiotemporal patterns of precipitation, Haile et al. (2011) evaluated the variability of five precipitation properties: rain event depth, event duration, mean event rain rate, peak rain rate and the time span between two consecutive rain events, which is referred to as inter-event time (IET). They assessed how rainfall event properties change when the period over which rainfall data is aggregated changes from 1 to 6 min, and when the minimum inter-event time (MIT) changes from 30 min to 8 h. This assessment allowed the observation of the effect of altitude on the spatial distribution of rain depth, event duration and mean event rain rate. Furthermore, they observed a direct relationship between altitude and event duration, rain event depth and IET. In the same study, the number of recorded events was inversely related to the altitude.
The spatiotemporal patterns of precipitation were also investigated by Coscarelli and Caloiero (2012) using two indicators CI (Concentration Index) and PCI (Precipitation Concentration Index). These indices measure the variation of the weight of rainfall in a short range of events in the yearly rainfall and relative distribution of rainfall patterns in the estimation of seasonal rainfall. They were calculated using homogenized daily rainfall data of 129 gauges. It was observed that areas with higher values of CI were those that showed the lowest yearly rainfall and rainy days in the year. In relation to PCI, 95 raingauges showed a significant negative trend; it revealed a trend towards a more uniform distribution of monthly rainfall during the year.
Characterization of sub-daily rainfall properties in three raingauges located in northeast Brazil
Climatic interference was studied by Lenderink et al. (2011); they showed that rainfall events in an hourly scale have a standard climate dependency, as the results of research made in Hong Kong and the Netherlands were similar. For the analysis of the relationship between the moisture near the surface (measured by the dew point temperature) and extreme rainfall data in the two countries; it was noted that even for different climates, the dependence between hourly rainfall and temperature follows a rate of 14% per °C between 12 and 22°C.
In this context, the aim of this study is to investigate the distribution patterns of rainfall events on three experimental basins located in northeastern Brazil, using the MIT criteria and minimum rainfall depth. The rainfall events were classified into hyetograph shapes. This type of study in Brazil is still important to understand the role of rainfall (and its characteristics) on the water balance of watersheds. This study is part of a network project based on hydrological monitoring in experimental watersheds.
STUDY AREA
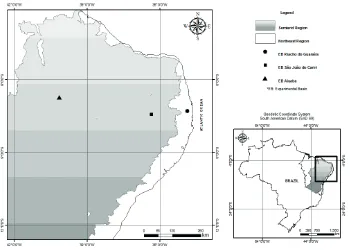
The study area is made up of three experimental basins (EB) in Brazil, two located in a semi-arid region and one in a coastal region (Fig. 1). They were chosen due to the different climate conditions (semi-arid and rainy areas) and because they belong to REHISA (Network for Hydrology of Semiarid Regions), a network created in 2003 to study experimental basins.
Brazil has six climatic zones and the semi-arid is one of them. It is characterized by irregular and scarce rainfall; most of it located in the northeast region of the country. The characteristics of the semi-arid region are tropical climate, large areas of land with shallow topsoil and rocky basement, low soil permeability; Caatinga as the predominant vegetation; temperatures ranges from 22 to 28°C with few spatial and temporal variation, very high insolation, high actual evapotranspiration, rainfall concentrated in 3–4 months, irregular distribution and value less than 800 mm year-1 (Pereira Jr. 2007).
Fig. 1 Location of three experimental basins, where two of them are located to semi-arid region of Brazil.
Table 1 Main characteristics of three experimental basins.
Aiuaba EB Riacho do Guaraíra EB São João do Cariri EB
Location Ceará State Paraíba State Paraíba State
Raingauge code G1 G2 G102
Time resolution (minute) 15 1 1
Area (km²) 11.50 5.84 13.78
Climate Semiarid Rainy tropical Semiarid
Mean yearly rainfall 850 mm 1400–1800 mm 503 mm
Wet period January–April March–July January–May
Annual mean temperature 26°C 26°C 26.2°C
METHODOLOGY
For this study sub-daily rainfall data were used. For this purpose, measured data were filtered considering a rainfall event if minimum event depth was higher than 1.016 mm (equivalent to four tilted at the Tipping Bucket) and the MIT was longer than 30 minutes, similar to the study carried out by Haile et al. (2011). This is also in accordance with Dunkerley (2008a,b), whose research shows the ranges variation from 3 min to 24 h for MIT, while the minimum measurable event depth varies from 0.2 mm to 13.0 mm.
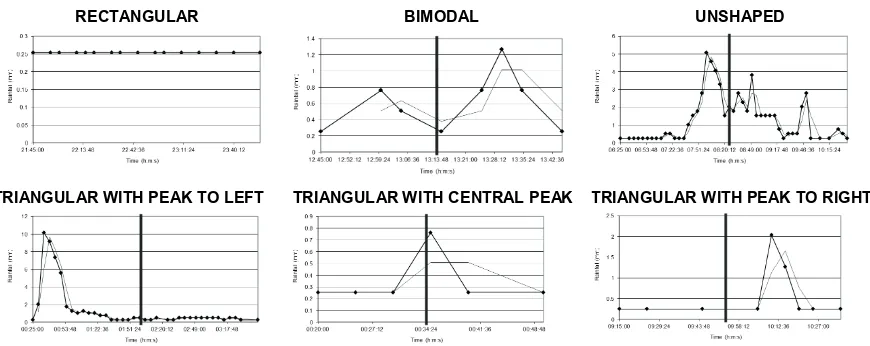
After the rainfall events selection, they were classified according to six possible shapes, as can be seen in Fig. 2. These events are called synthetic hyetograph, and each of them can be defined as follows: (i) Rectangular (R) – this class has an apparent constancy on the values of the rain rates, i.e. there are no relevant sharp peaks; (ii) Triangular (U) – it is the class where the presence of a characteristic peak on the hyetograph is visible, which can be centred (UC) with peak to the left (UE) or with peak to the right (UD); (iii) Bimodal (B) – it is the class where the hyetograph has two peaks clearly highlighted compared to the smaller adjacent peaks; and (iv) Shapeless (NC): in this class the behaviour of the hyetograph does not present any similarity to the previous ones, since the profile of this graph is sometimes alternated between constant stretches and remarkable peaks. The identification of the synthetic shape is done by an operator based on the peak’s position on the rainfall event. Then, a statistical analysis was carried out considering the shape of the synthetic hyetograph, peak, duration, intensity and total rainfall.
Fig. 2 Hyetograph shapes used to the classification.
RESULTS
In this study, 1386 rainfall events were identified, 67% occurred in the Riacho do Guaraíra EB (G2), where the climate is rainy tropical and the yearly rainfall is higher than the two other experimental basins. Moreover, it is clear that the amount of rainfall events of EB semiarid (G1 and G102) contributed similarly to total recorded (17% relative of total) (Table 2).
RECTANGULAR BIMODAL UNSHAPED
Characterization of sub-daily rainfall properties in three raingauges located in northeast Brazil
Table 2 Distribution of rainfall events.
Raingauge Total of classified rainfall events % relative of total
G1 228 16%
G2 927 67%
G102 231 17%
Total 1386 100%
Table 3 Distribution of rainfall event shapes.
Synthetic hyetograph R UC UD UE B NC
Number of events 749 39 71 335 108 84
% of each event of the total 54.04% 2.81% 5.12% 24.17% 7.79% 6.06%
Fig. 3 Classification of rainfall events peak.
Table 3 shows the distribution of rainfall events according to the synthetic hyetograph. It can be seen that the rectangular profile is predominant (54.04%), and the minority are: UC (2.81%); UD (5.12%); B (7.79%) and UC (6.06%).
The following figures show the contribution of each rainfall event profile at determined ranges, i.e. how big a percentage one synthetic hyetograph has for each interval. For rain event peak analyses there are five classes with an interval of 0.253 mm. The duration range is 10 min and three classes were determined for intensity rainfall (less than 2 mm.h-1, between 2 and 10 mm h-1 and greater than
10 mm h-1). For a better analysis, only the graphs of the main classes are illustrated.
Figure 3 shows the relative distribution of synthetic hyetographs considering the rainfall peak; there is predominance of rectangular events when just a pulse is considered (0.254 mm). This behaviour is modified with the increase in the number of pulses in every experimental basin. It is more significantly in G1 in which more than 50% of the events NC, UC, UD, EU and B have rainfall peaks exceeding 1.5 mm, highlighting the NC (90%).
It can also be observed that in the Riacho Guaraíra EB less than 40% of their events had rainfall peak greater than 1.5 mm and less than presented in Aiuaba EB and São João do Cariri EB. This may point out the tendency of rain events in semi-arid zones: heavy rainfall in a short time.
The duration of rainfall events was also analysed (Fig. 4). Among the defined ranges of relative frequencies a standard behaviour from one class to another did not exist (Fig. 4). However, it can be seen that in most ranges rain events of gauges G1 and G102 were distributed similarly. For example, in both gauges, approximately 30% of the events were classified as UD for the range from 20 to 30 minutes (Fig. 4(b)), while in range 60 to 80 min (Fig. 4(c)), rainfall event type UC also had the same value for both gauges (about 25%).
Fig. 4 Rainfall events duration classification distributed to four ranges.
Fig. 5 Rainfall event intensity classification distributed to two ranges.
The rainfall intensity was also analysed, which comes indirectly from a relationship between the previous parameters (Fig. 5). In particular, the more intense rainfall events in all gauges are not rectangular. Therefore, lower intensities are concentrated in rectangular events, since they have a distribution of rainfall predominantly constant during the time.
NC events in the Riacho Guaraíra EB had a highest intensity, while in the Aiuaba EB the predominated type is UC. In São João do Cariri EB, all the NC and UC events have an intensity exceeding 10 mm.h-1. The concentration of the NC type events in the class with intensity greater
than 10 mm.h-1, combined with a long duration (longer than 120 min) indicates that rainfall in all
experimental basins have a large volume of water.
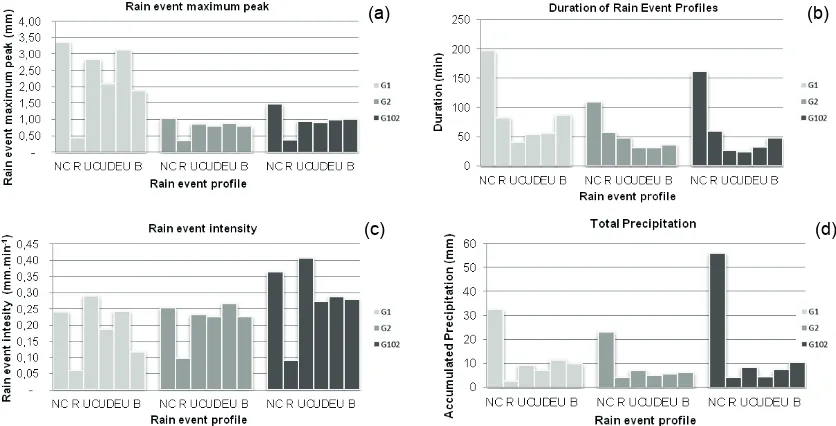
The following figure (Fig. 6) shows the results of all rainfall events for the three experimental basins, where the analyses performed previously by classes are confirmed, such as: (i) NC rainfall events have higher peaks and longer durations, being relatively more significant in the semi-arid experimental basins; (ii) Rectangular (R) rainfall events have low intensities; and (iii) gauge 102 comes up with NC and UC rainfall events with highest intensities.
Other additional information is related to the total rainfall (Fig. 6(d)), once again, NC events are responsible for the highest values of total rainfall, even with low participation in the total number of rainfall events. This great contribution was expected due to the characteristics of this type of rainfall event with long duration and high intensity.
(a) (b)
(c) (d)
Characterization of sub-daily rainfall properties in three raingauges located in northeast Brazil
Fig. 6 Intergauge analysis of main characteristic of total rain event profiles.
CONCLUSIONS
In this paper, the main characteristics of rainfall events were analysed (peak, duration, total precipitation and intensity) at three experimental basins, two of them located in the Brazilian semi-arid region.
It is evident that there is a similar distribution of rainfall events among the basins located in the semi-arid region. There are two main reasons to explain this distribution. The first is due to the equal proportional contribution of the total number of events (16% and 17%). The second is the similar behaviour of the event distribution in each of the analysed characteristics (mainly the duration). Regarding synthetic hyetographs, rainfall event NC type stood out for having the highest peak values, duration and intensity in all gauges, even with a low percentage in the total number events.
REFERENCES
Coscarelli, R. and Caloiero, T. (2012) Analysis of daily and monthly rainfall concentration in Southern Italy (Calabria region).
Journal of Hydrology 416, 145–156.
Dunkerley, D. (2008a) Rain event properties in nature and in rainfall simulation experiments: a comparative review with recommendations for increasingly systematic study and reporting. Hydrological Processes 22(22), 4415–4435.
Dunkerley, D. (2008b) Identifying individual rain events from pluviograph records: a review with analysis of data from an Australian dryland site. Hydrological Processes 22(26), 5024–5036.
Haile, A. T. et al. (2011) Rain event properties at the source of the Blue Nile River. Hydrology and Earth System Sciences 15(4), 1023–1034.
Lenderink, G., et al. (2011) Scaling and trends of hourly precipitation extremes in two different climate zones–Hong Kong and the Netherlands. Hydrology and Earth System Sciences 15(9), 3033–3041.
Pereira Jr., J. S. (2007) Nova delimitação do semi-árido brasileiro, Câmara de Deputados do Brasil.
a)
(a) (b)