Sediment Dynamics from the Summit to the Sea
(Proceedings of a symposium held in New Orleans, Louisiana, USA, 11–14 December 2014) (IAHS Publ. 367, 2014).
207
Simulation and control of morphological changes due to dam
removal in the Sandy River, Oregon, USA
YAN DING & MUSTAFA S. ALTINAKAR
National Center for Computational Hydroscience and Engineering, The University of Mississippi, Mississippi 38677−1848, USA
Abstract A one-dimensional channel evolution simulation model (CCHE1D) is applied to assess morphological changes in a reach of the Sandy River, Oregon, USA, due to the Marmot Dam removal in 2007. Sediment transport model parameters (e.g. sediment transport capacity, bed roughness coefficient) were calibrated using observed bed changes after the dam removal. The validated model is then applied to assess long-term morphological changes in response to a 10-year hydrograph selected from historical storm water records. The long-term assessment of sedimentation gives a reasonable prediction of morphological changes, expanding erosion in reservoir and growing deposition immediately downstream of the dam site. This prediction result can be used for managing and planning river sedimentation after dam removal. A simulation-based optimization model is also applied to determine the optimal sediment release rates during dam-removal that will minimize the morphological changes in the downstream reaches.
Key words sediment transport; dam removal; numerical modelling; sediment control; optimization
INTRODUCTION
Dam removal projects in the United States are becoming increasingly common for river restoration purposes. For reservoirs with large sediment deposits, released sediments may significantly change the river morphology in both the reservoir and the downstream channels (e.g. Cui & Wilcox, 2008). If reservoir sediment deposits contain contaminants, sediment release may further exacerbate environmental hazards downstream (e.g. Doyle & Stanley, 2005). Therefore, the
downstream impact of sediments released from the reservoir afterdam removal is a major concern.
Prior to decommissioning dams, studies of sediment transport and their related morphological changes upstream and downstream of the dam site are necessary to optimize sediment management and minimize downstream morphological changes in rivers.
Sediment transport processes following dam removal are complicated due to the non-uniform spatial distribution of sediment in reservoirs and downstream, and the nonlinear dynamics of river flows and sediment transport in space and time (e.g. Stillwater Sciences, 2000). Quick release of reservoir sediments by a complete dam removal (i.e. without control of the removal schedule and sediment release rate) may result in supercritical flow in the river reach near the knickpoint, or immediately downstream of the dam. Eroded sediments from the reservoir usually deposit immediately downstream of the knickpoint. The rates of erosion inside the reservoir and the deposition downstream vary with time. A headcut may be triggered and migrate upstream through
delta deposits if reservoir bed materials are cohesive (e.g. Langendoen et al., 2005). As a result,
bank erosion and channel widening are important adjustment processes. Even if the dam removal process is gradual, river floodwaters can entrain large amounts of deposited sediment and transport it over the low-head dam (Cui & Wilcox, 2008). Furthermore, the bio-geomorphic impact of dam removal on the riverine environment is long-term and long-range both upstream and downstream (Doyle and Stanley, 2005). Thus, the assessment of potential impacts of dam removal on river hydrological and geomorphological environments requires integrated model capabilities to simulate multi-scale processes in river flow, morphology and ecosystem services.
Engineering planning related to dam removal relies heavily on predictive simulation results to assess environmental impacts due to releases of sediment and water from reservoirs. A key challenge in modelling conditions during dam removal is to simultaneously simulate flow and sediment transport in reservoir and downstream reaches over very steep bed slopes. These conditions can be expected at the downstream portion of the reservoir sediment wedge immediately following dam removal. Transient/transcritical flow conditions may be generated, resulting in numerical instability.
Many studies of riverine environmental impacts due to dam removal projects employ one-dimensional (1-D) integrated hydrodynamic and morphodynamic models to predict sediment
transport and morphological changes. Ding et al. (2013a) applied a 1-D river flow and sediment
transport model, CCHE1D, to assess morphological changes in a reach of the Sandy River, Oregon, USA due to the removal of the Marmot Dam in October 2007. This 1-D model was validated by simulating sedimentation processes during drawdown of the reservoir. CCHE1D (Center for Computational Hydroscience and Engineering) is an integrated flow and morpho-dynamic model developed by the National Center for Computational Hydroscience and
Engineering (NCCHE) at The University of Mississippi (Wu & Vieira, 2002; Wu et al., 2004).
The model simulates non-uniform sediment transport, bed aggradation and degradation, bed material composition (hydraulic sorting and armouring), and bank erosion. CCHE1D is particularly effective in the estimation of long-term sediment loads and morphological changes in channel networks, evaluation of the effects of erosion control and channel remediation measures on sediment yield, and analysis of the influence of land-use changes and agricultural management practices on sedimentation. The CCHE1D model simulates flows that must be primarily subcritical in all reaches of the channel network. However, it can handle local supercritical and subcritical flows without hydraulic jumps in cross-sections by incorporating a hybrid dynamic/diffusive wave model. The diffusive wave model is used for cases with high Froude numbers (near critical and supercritical flow conditions). The hybrid dynamic-diffusive wave model reduces numerical instability of the dynamic wave model in the transcritical flow regions.
In this paper, the CCHE1D model is used to assess morphological changes resulting from the Marmot Dam removal in a reach of the Sandy River, Oregon. The model is calibrated and applied to assess long-term morphological changes in response to a 10-year record of historical river flow.
A simulation-based optimization tool (Ding et al., 2013) is used to search for optimal control of
sediment releases to minimize morphological changes in the Sandy River after dam removal. Optimized sediment release during dam removal can provide engineering management guidance to plan a better scheduled dam decommissioning if releasing reservoir deposits can be operated.
DESCRIPTION OF SIMULATION MODEL: CCHE1D
The CCHE1D model is an integrated 1-D channel network model with a landscape analysis tool TOPAZ (Topographic PArametriZation) and watershed models AGNPS (Agricultural Non-Point
Source Pollution Model) (Young et al., 1987), AnnAGNPS (Bingner & Theurer, 2009) and SWAT
(Soil and Water Assessment Tool) (Arnold et al., 1993). The models are managed through a
graphical user interface based on ArcGIS and/or ArcView (Wu & Vieira, 2002). CCHE1D can simulate unsteady flow and sediment transport processes in single channels or dendritic channel networks using either the diffusive wave model or the dynamic wave model. It takes into account the difference between flows in the main channel and floodplains of a compound channel, and the influence of hydraulic structures. For local supercritical and transcritical flows (without hydraulic jumps), the hybrid dynamic/diffusive wave model is applied.
In terms of the non-equilibrium transport modelling, the CCHE1D sediment transport model simulates non-uniform sediment transport, bed aggradation and degradation, bed material composition (hydraulic sorting and armouring) and bank erosion. Multiple options for sediment-related parameters have been implemented in the model. Four sediment transport capacity
formulae in the model include the SEDTRA model (Garbrecht et al., 1995), Wu-Wang-Jia (2000),
Simulation and control of morphological changes due to dam removal
IMPACT ASSESSMENT OF THE MARMOT DAM REMOVAL IN THE SANDY RIVER
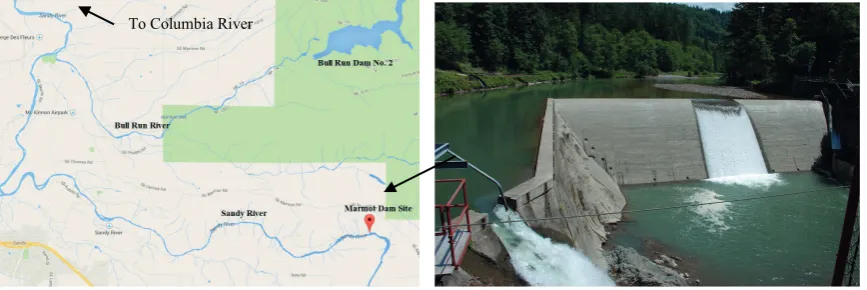
The Marmot Dam was the only dam on the main-stem of the Sandy River, Oregon (Fig. 1). This river extends approximately 89 km from its headwater to its confluence with the Columbia River. The dam was located downstream of the Salmon River confluence but upstream of the Bull Run River confluence and 2 km upstream of the entrance to the Sandy River gorge. The Bull Run River is the largest tributary of the Sandy River. Marmot Dam, a 14.3-metre-high 105-metre-long roller-compacted concrete dam, was built in 1989 to replace an earlier timber structure originally constructed in 1913. Portland General Electric (PGE), the owner and operator of the dam, decided to build a temporary cofferdam upstream of Marmot Dam to facilitate the removal of the dam body and prevent the disturbance of the sediment deposited behind the dam. After the dam was removed, the cofferdam was breached to allow the 80-km-long Sandy River to flow freely from Mount Hood, Oregon, to its confluence with the Columbia River. Breaching of the cofferdam was scheduled for 19 October 2007, between seasonal fish runs, to minimize adverse impacts to resident and migratory fish.
Fig. 1 Sandy River basin and Marmot Dam before removal (Keller 2010).
Sediment deposition and sorting formed a two layer structure in the reservoir (Squier Associates, 2000). These layers primarily consist of a surface gravel layer (Unit 1), a sand layer underneath (Unit 2), and the pre-dam channel bed (Unit 3). The size distribution of the reservoir sediments for the top two layers is presented in Fig. 2. The uppermost unit (Unit 1) ranged from approx. 2 to 5.5 m in thickness and was composed of sandy gravel with a small amount of cobbles and boulders, becoming thicker toward the dam. Unit 2 is predominantly fine sediment (silty sand to sand with a small amount of gravel, ranging from 4 to 11 m in thickness). The pre-dam deposit, Unit 3, consists primarily of coarse sediment and ranging from 0.8 to 3 m in depth. Prior to
decommissioning the dam, the reservoir contained approximately 750 000 m3 of sand and gravel.
The sediment transport rate was about 250 000 ton/year at the Marmot Dam, of which the majority was fine sediment (Stillwater Sciences, 2000).
Cross-section survey data provided by PGE (Stillwater Sciences, 2000) was used to generate cross-sections for the numerical simulation of hydrodynamic and morphodynamic processes in the river. The study reach (i.e. computational domain) extends 2.5 km upstream and 18.0 km down-stream of the dam. Several cross-sections were linearly interpolated or extrapolated in several sub-reaches to improve simulation results. The spacing between cross-sections varied from 12 m to 325 m and a total of 126 cross-sections were used in the model.
Discharge data from the USGS gauging station (14137000) was used as a boundary condition at the inlet of the study reach. In the first year after dam removal (19 Oct. 2007–30 Sept. 2008), the
maximum average daily discharge in the river was 180 m3/s. Water depth data from the USGS
gauging station (14142500) located downstream of the dam was used as the downstream water depth boundary condition in the model. Water depths at the station were calculated assuming a
state of uniform flow at a cross-section. An initial flow condition of 5.0 m3/s was assumed.
Fig. 2 Particle size distribution of the two uppermost sediment layers in the Marmot Dam.
To model non-uniform sediment transport, the particle size distributions of sediment layers (Unit 1 and Unit 2, Fig. 2) were used for sediment in the reach behind the dam. Unit 1 is assumed to be the bed composition (i.e. sandy gravel with some cobbles and boulders) in the cross-sections downstream from the dam site. The graded sediments in the model are divided into 12 size classes which vary in size from 0.09 mm to 188.34 mm.
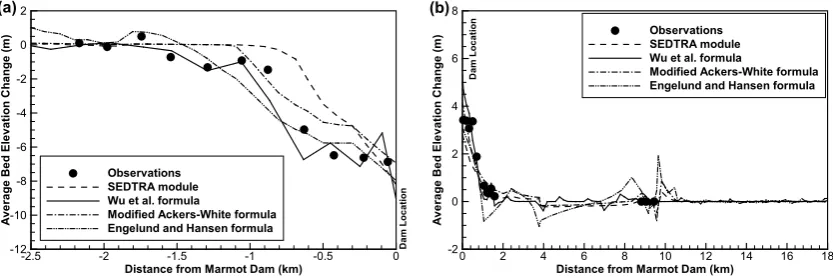
Calibration of model parameters was carried out by simulating flow and sediment transport from 19 Oct. 2007 to 30 Sept. 2008. To investigate the performance of the sediment transport capacity formulae, all the four available formulae in the model were examined by computing the first year morphodynamic processes. The average bed elevation changes after the one year computed by the four formulae are compared in Fig. 3. The averaged bed changes after one year of dam removal were measured by PGE in the summer of 2008, and survey results were reported (Stillwater Sciences, 2009). All the capacity formulae give reasonable bed change patterns in comparison with the observed bed changes after the first one-year natural flush of reservoir sediments: the erosion before the knickpoint and the deposition downstream are well simulated. By evaluating the bed changes in both the upstream and downstream, the data show that Engelund and Hansen’s formula produced a slower erosion rate in the reservoir, but it overestimated the change in the downstream reaches. The Wu-Wang-Jia formula provided better morphological changes over the entire study reach. Accordingly, the Wu-Wang-Jia formula was used for model validation and the long-term assessment of morphological changes in the Sandy River.
Bed roughness coefficients along the study reach were evaluated (Fig. 4) using a range of roughness value from 0.03 to 0.06 that vary from upstream to downstream. Figure 4 shows that bed changes downstream are more sensitive to the roughness coefficient. The large roughness value is appropriate to the downstream reach because the bed surface pre dam removal was
Fig. 3 Comparison of 1-year bed changes using four sediment transport rate formulae. Grain Size (mm)
Pe rc en tF in er (% )
10-2 10-1 100 101 102 103
0 20 40 60 80 100 Unit 1 Unit 2
Distance from Marmot Dam (km)
Av er ag e B ed El ev at io n C ha ng e (m )
-2.5 -2 -1.5 -1 -0.5 0
-12 -10 -8 -6 -4 -2 0 2 Observations SEDTRA module Wu et al. formula
Modified Ackers-White formula Engelund and Hansen formula
D am Lo ca tio n (a)
Distance from Marmot Dam (km)
Av er ag e B ed El ev at io n C ha ng e (m )
0 2 4 6 8 10 12 14 16 18
-2 0 2 4 6 8 Observations SEDTRA module Wu et al. formula
Modified Ackers-White formula Engelund and Hansen formula
Simulation and control of morphological changes due to dam removal
Fig. 4 Comparisons of 1-year bed changes using different roughness coefficients.
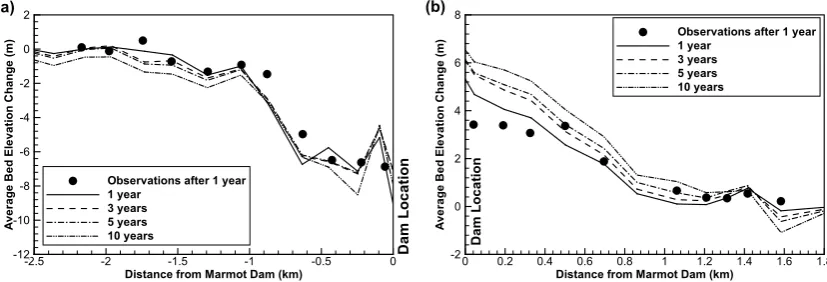
Fig. 5 Long-term bed change evolutions computed by using calibrated model parameters.
armoured and consisted mainly of cobbles and boulders and the morphology downstream is more complex.
A 10-year impact assessment of morphological changes in the Sandy River after the Marmot Dam removal was performed using the calibrated model parameters and the selected sediment transport capacity formula (i.e. Wu-Wang-Jia’s formula). By means of an approach similar to that adopted by Cui and Wilcox (2008), a 10-year-long hydrograph measured in the river was selected for the long-term assessment, in which each yearly hydrograph was picked up from a yearly data record. For example, the time series of discharge in 2008 was used as the input hydrograph of the first year. For the rest of the nine year hydrograph, we adopted the selected discharge data records from 1932 to 1997 by Stillwater Science (2000) and Cui & Wilcox (2008). The peak discharge
varied from 180.4 m3/s in the first year to 390.8 m3/s in the 10th year post dam removal.
Simulations of 10-year average bed level changes show that there is increasing erosion upstream (Fig. 5(a)) and continuing aggradation in the area immediately downstream of the dam (Fig. 5(b)); and the travelling wave of the eroded sediments from the reservoir causes these morphological changes. The rate of bed erosion upstream seems slightly slower than that of deposition downstream. One of reasons is that the downstream cross-sections are narrower than upstream inside the reservoir. Because erosion rates are related to the size distribution of the initial bed material size, it is expected that following dam removal, the slope of the riverbed would gradually return to the pre-dam condition. The simulation results show that the bed changes from year 5 to year 10 are much greater than those from year 3 to year 5. This is because the peak discharge in the second five years is significantly greater than that in the first five years. And the variation in suspended sediment concentration can also greatly influence river morphology. The model shows an increase in erosion at a reach 1.4–1.8 km below the dam that is related to a decrease in cross-section width in this reach. The computed trend of the bed changes depends on the hydrological conditions of the selected water years. If more cycles of simulations of the 10
Distance From Marmot Dam (km)
Av er ag e B ed El ev at io n C ha ng e (m )
-2.5 -2 -1.5 -1 -0.5 0
-12 -10 -8 -6 -4 -2 0 2
Observations after 1 year
n = 0.06-0.03 upstream & 0.04 downstream n = 0.04 upstream & 0.04 downstream n = 0.04 upstream & 0.06 downstream
D am Lo ca tio n (a)
Distance From Marmot Dam (km)
Av er ag e B ed El ev at io n C ha ng e (m )
0 2 4 6 8 10 12 14 16 18
-4 -2 0 2 4 6 8 10
Observations after 1 year
n = 0.06-0.03 upstream & 0.04 downstream n = 0.04 upstream & 0.04 downstream n = 0.04 upstream & 0.06 downstream
D am Lo ca tio n (b)
Distance from Marmot Dam (km)
Av er ag e B ed El ev at io n C ha ng e (m )
-2.5 -2 -1.5 -1 -0.5 0
-12 -10 -8 -6 -4 -2 0 2
Observations after 1 year 1 year 3 years 5 years 10 years D am Lo ca tio n (a)
Distance from Marmot Dam (km)
Av er ag e B ed El ev at io n C ha ng e (m )
0 0.2 0.4 0.6 0.8 1 1.2 1.4 1.6 1.8 -2 0 2 4 6 8
water years can be repeated, an equilibrium state of morphology may be found, which remains as a future topic of this study.
OPTIMIZATION OF SEDIMENT RELEASE
Most dam removal practices result in a natural flush of reservoir sediment to downstream reaches. A concern for the natural flush sediment routing is the significant impact of sedimentation downstream in a relatively short period after dam removal (e.g. Cui & Wilcox, 2008). For better sedimentation management, it should be best to find an improved way to minimize this kind of
geomorphic impact, which could be the control of sediment routing at the dam site. Ding et al.
(2013b) developed a simulation-based optimization model to find the optimal sediment release schedule so that the morphological changes in the downstream reaches would be minimized. The simulation model is based on the sediment transport model and the flow model of CCHE1D. The optimization technique was developed based on the variational adjoint sensitivity approach which is an efficient and effective nonlinear optimization method to determine the optimal control action, such as the time-varying sediment release rate (i.e. the release schedule).
To apply this innovative optimization model to control the downstream deposition due to the flushing of reservoir sediments, it is assumed that certain engineering approaches (e.g. dredging or pumping) can be regulated by diverting extra sediment at the dam site. The model determines the best diverting schedule for reservoir sediments so that morphological changes downstream are minimized.
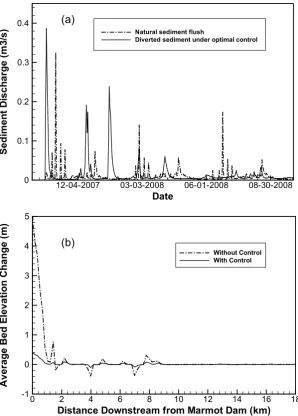
The optimal control duration for the Marmot Dam removal was started immediately after the dam removal and lasted one year. Figure 6 presents the optimal sediment control results and comparisons with the bed changes without control (natural flush). Figure 6(a) shows two sediment release rate curves from the reservoir based on natural flushing and the optimal control. The controlled release peaks of the sediments (solid line) correspond roughly to the storm peaks of the river flows. Figure 6(b) presents the comparisons of morphological changes resulting from the natural flush (without sediment release control) and control sediment routing. The morphological changes shown in Fig. 6(b) indicate that the controlled sediment release could give the best performance to significantly reduce sedimentation downstream, if the reservoir sediments can be diverted from the river by following the optimal release schedule.
CONCLUDING REMARKS
A one-dimensional river flow and sediment transport model (CCHE1D), was applied to simulate morphological changes in a reach of the Sandy River, Oregon, resulting from removal of the Marmot Dam in 2007. After calibration, the model was applied to assess long-term morphological changes in response to 10 years of selected flow data. The long-term assessment results of sedimentation give a reasonable prediction of morphological changes, expanding erosion in the reservoir and growing deposition at immediately downstream of the dam site. This prediction result can be used for managing and planning river sedimentation after dam removal. The optimal sediment transport rate found by the simulation-based model can minimize the deposition in the downstream. It can be used as an engineering management guidance to plan better-scheduled dam decommissioning if the release of reservoir deposits can be controlled.
Simulation and control of morphological changes due to dam removal
Fig. 6 Results of sediment control optimization: (a) Release rate from reservoir based on natural flush (dash-dot line) and the optimal control (solid line); (b) Morphological changes through the natural flush (without sediment release control) and the controlled sediment routing (solid line)
REFERENCES
Arnold, J.G., Allen, P.M. & Bernhardt, G. (1993) A comprehensive surface-groundwater flow model. J. Hydrol. 142, 47–69. Bingner, R. L. & Theurer, F.D. (2009) AGNPS Web Site. http://www.ars.usda.gov/Research/docs.htm?docid=5199.
Cui, Y., Parker, G., Braudrick, C., Dietrich, W.E. & Cluer, B. (2006a) Dam removal express assessment models (DREAM), 1: Model development and validation. J. Hydraulic. Res. 44(3), 291–307.
Cui, Y., Braudrick, C., Dietrich, W.E., Cluer, B. & Parker, G. (2006b) Dam removal express assessment models (DREAM), 2: Sample runs sensitivity tests. J. Hydraulic Res. 44(3), 308–323.
Cui, Y. & Wilcox, A. (2008) Development and application of numerical modeling of sediment transport associated with dam removal. In Sedimentation Engineering: Processes, Measurements, Modeling, and Practice, ASCE Manual 110, Editor: Garcia, M.H., American Society of Civil Engineers, Reston, Virginia, 995–1020.
Ding, Y., Elgohry, M., Altinakar, M. S. & Wang, S. S. Y. (2013a) Simulation of morphological changes due to dam removal – Chapter 7, In: Sediment Transport: Monitoring, Modeling and Management, ed. by Abdul Khan et al., Nova Science Publishers, New York, 213–238.
Ding, Y., Elgohry, M., Altinakar, M. S. & Wang, S. S. Y. (2013b) Optimal control of flow and sediment in river and watershed, In: Proceedings of 2013 IAHR Congress, Tsinghua University Press, Chengdu, China, 8–13 Sept., 2013, 13p.
Doyle, M.W. & Stanley, E.H., (2005) Stream ecosystem response to experimental dam removals. In: Managing Watersheds for Human and Natural Impacts: Engineering, Ecological, and Economic Challenges (Proc. 2005 Watershed Management Conference, 19–22 July 2005, Williamsburg, VA), ed. by G.E. Moglen, (http://dx.doi.org/10.1061/40763(178)20).
Date
Se
di
m
en
tD
is
ch
ar
ge
(m
3/
s)
12-04-2007 03-03-2008 06-01-2008 08-30-2008 0
0.1 0.2 0.3 0.4
Natural sediment flush
Diverted sediment under optimal control
Distance Downstream from Marmot Dam (km)
A
ve
ra
ge
B
ed
El
ev
at
io
n
C
ha
ng
e
(m
)
0 2 4 6 8 10 12 14 16 18
-1 0 1 2 3 4 5
Without Control With Control
(a)
Engelund, F. & Hansen, E. (1967) A monograph on sediment transport in alluvial streams. Teknisk Vorlag, Copenhagen, Denmark.
Garbrecht, J. & Martz, L.W. (1995) An automated digital landscape analysis tool for topographic evaluation, drainage identification, watershed segmentation and subcatchment parameterization. Report No. NAWQL 95-1, National Agricultural Water Quality Laboratory, USDA, Agricultural Research Service, Durant, Oklahoma.
Keller, T. (2010) What PGE learned while removing Marmot Dam. Daily Journal of Commerce, 28 October 2010. available at http://www.djc.com/news/ae/12023010.html
Konrad, C.P, (2009) Simulating the recovery of suspended sediment transport and river-bed stability in response to dam removal on the Elwha River, Washington. Ecological Engineering 35(7), 1104–1115.
Langendoen, E.J., Wells, R.R. & Simon, A. (2005). Numerical simulation of post dam removal sediment dynamics along the Kalamazoo River between Otsego and Plainwell, Michigan. In: Managing Watersheds for Human and Natural Impacts: Engineering, Ecological, and Economic Challenges (Proc. 2005 Watershed Management Conference, 19–22 July 2005, Williamsburg, VA), ed. by G.E. Moglen.
Proffit, G.T. & Sutherland, A.J. (1983) Transport of nonuniform sediment. J. Hydraulic Res., 21(1), 33–43.
Squier Associates (2000) Sandy River sediment study, Bull Run hydroelectric project. Draft report prepared for Portland General Electric. January 2000.
Stillwater Sciences (2000) Numerical modeling of sediment transport in the Sandy River, OR following removal of Marmot Dam. Technical report prepared for Portland General Electric, Portland, Oregon.
Stillwater Sciences (2009) Post-dam-removal channel complexity monitoring survey data analysis, Sandy River, Oregon, 1st year following dam removal. Technical memorandum, prepared for Portland General Electric, Portland, Oregon.
Wu, W., Wang, S.S.Y. & Jia, Y. (2000) Nonuniform sediment transport in alluvial rivers. J. Hydraulic Res. 38(6), 427–434. Wu, W. & Vieira, D.A. (2002) One-dimensional channel network model CCHE1D 3.0. Technical Report No.
NCCHE-TR-2002-01, National Center for Computational Hydroscience and Engineering, University of Mississippi, University, MS. Wu, W., Vieira, D. & Wang, S.S.Y. (2004) One-dimensional numerical model for nonuniform sediment transport under
unsteady flows in channel networks. J. Hydraulic Engng 130(9), 914–923.