Sediment Dynamics from the Summit to the Sea
(Proceedings of a symposium held in New Orleans, Louisiana, USA, 11–14 December 2014) (IAHS Publ. 367, 2014).
43
Simulation of rainfall effects on sediment transport on steep
slopes in an Alpine catchment
A. KAISER
1, F. NEUGIRG
2, M. SCHINDEWOLF
1, F. HAAS
2& J. SCHMIDT
1 1 Soil and Water Conservation Unit, Technical University Freiberg, D-09599 Freiberg, Germanyandreas.kaiser@tbt.tu-freiberg.de
2 Department of Physical Geography, Catholic University of Eichstätt-Ingolstadt, D-85072 Eichstätt, Germany
Abstract The Alps represent a young, high mountain range which displays strong geomorphological activity. As the major source area in Central Europe, they deliver large quantities of sediment to the lowlands. However, our knowledge on process differentiation is still not sufficient to distinguish between the summer and winter periods of denudation. To increase our understanding of soil detachment, artificial rainfall experiments were carried out to generate data for the physically-based soil erosion model EROSION 2D/3D. Additionally, state-of-the-art, close-range remote sensing methods were applied to validate the results. The first rainfall simulations showed promising results for predicting denudation during the summer period, thus indicating the applicability of this experimental approach. However, further research is required for seasonal dynamics during other times of the year.
Key words erosion; rainfall simulation; steep slopes; soil erosion modelling; structure from motion; close-range photogrammetry; EROSION 3D
INTRODUCTION
As a major sediment source area, unvegetated steep mountains often represent the ideal location to investigate complex mechanisms in surface erosion and sediment dynamics. In the densely populated Alps in particular, natural hill slope processes and infrastructure frequently result in a costly “interaction.” However, data availability on slope denudation remains limited when compared with data on the lowlands. This imbalance between high dynamics and little knowledge versus slower dynamics and numerous studies leaves many questions open (e.g. for process distinction). For agricultural sites especially, much data is available on soil erosion in various climatic conditions (Ries 2010; Schindewolf et al. 2012; Ghahramani & Ishikawa 2013). While these studies discuss dominant processes such as splash, rill and interrill erosion, erosion on steep alpine slopes needs to take additional processes into account, such as gravity and frequent freeze/thaw cycles. As a function of soil moisture, the latter can increase erosion considerably (Ferrick & Gatto 2005).
Rainfall simulators have been widely used in surface runoff studies. However, this approach has not often been applied to steep, mountainous terrains due to their inaccessibility and the generally heavy equipment. Thus, rainfall simulators for steep terrain conditions have been specifically developed (Wilcox et al. 1986; Markart et al. 2010).
The EROSION 3D model has been applied and validated on various agricultural sites and compared to other established erosion models (Starkloff & Stolte 2014). Results proved to be promising in regard to the ability to reproduce runoff events and erosion damage. So far, there has been neither data for nor applications of EROSION 3D on steep hillslopes outside agricultural areas. While erosion modelling has been successfully conducted for the area’s summer period
(Schindewolf et al. 2014), many unknowns remain regarding slope denudation processes in a
seasonal setting. Nevertheless, the initial obstacles of the first application of the rainfall simulator were manageable and consistent data were produced.
STUDY AREA
The Lainbach catchment is located near the town of Benediktbeuern in Bavaria, Germany (Fig. 1). The torrent Lainbach is a 7 km-long tributary of the Loisach River that flows into the Isar and the Danube. The upper right frame shows aerial imagery of the slope failure “Melcherreiße” and bare soils. The drainage is directed to the north. The rainfall simulation site was located on a freshly eroded area which is still vegetated in the image. For the most part, the steeply inclined slopes (>43°) are stretched and heavily dissected.
Fig. 1 Location of the study area, model research area (Schindewolf 2014) and rainfall simulation site (source: Google Earth).
The elevation in the catchment varies from about 700 m at the river’s outlet to approx. 1800 m at the summit of the Benediktenwand. The experimental site is situated at an elevation of 1020 m in an area underlain by limestone and mudstone. The central part of the catchment is filled with unconsolidated Pleistocene basal moraine sediments. This is identified as material from a lateral of the Isar/Loisach Glacier. A detailed description of the glacio-lacustrine and moraine sediments, as well as their genesis is given by Becht 1989.
Frequent runoff events resulting from high annual precipitation (2120 mm) and the low hydraulic conductivity of the shallow soil leave apparent signs of erosion features on site. Accordingly, previous studies also indicate little to no temporal delay of discharge between vegetated and bare slopes in the catchment (Wetzel 2003). Check dams were installed in gaining streams of the Lainbach to reduce the flow velocity and encourage sedimentation. This would, in turn, decelerate backward erosion. Additional riverbed controlling infrastructure was introduced further downstream due to the relatively high relief intensity. A heavy flooding event in 1990 produced distinct river channel adjustment and damage to infrastructure (Schmidt 1994).
METHODS
To maintain comparability with previously existing databases for lowlands, the use of a comparable system is recommended. Therefore, a rainfall simulator, which constitutes one segment of a larger, 3 m² unit, was erected in the study area to investigate sediment/soil detachment and transport. In addition, particle sizes, bulk densities and soil moisture were determined to produce data for the physical soil erosion model EROSION 2D/3D. Multi-temporal terrestrial laser scans were carried out to first generate digital surface models for the erosion model, and second to monitor changes to validate the modelling.
Rainfall simulator
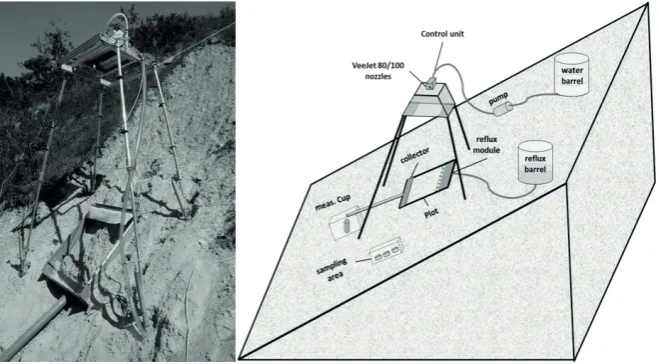
Fig. 2 Freiberg rainfall simulator and the experimental set-up.
Because its drop size distribution and drop velocities are comparable to those of natural, heavy rainstorms, the VeeJet 80/100 nozzle represents a quasi-standard in rainfall simulations (Kainz et al. 1992; Hassel & Richter 1992). By varying the nozzle pressure, the drop size distribution and fall velocities can be altered to a certain degree. The best conformity to natural rainstorms was attained when using a nozzle pressure of 0.5 bar and a rainfall intensity of >30 mm/h, while the mean drop diameter was 0.7 mm and the mean fall velocity was 6.8 m/s.
The experimental plot was bordered by metal plates and a collection funnel at the lower end. A pipe was attached to this funnel to allow for the sampling of drained surface runoff and suspended sediments. Sediment-loaded runoff was stored in a designated reflux barrel next to the funnel.
In order to simulate large slope lengths despite the limited plot length, a runoff reflux module was installed at the upper end of the plot. This was introduced by Schmidt (1991) and validated by (Schindewolf 2012). Due to the technical challenges in steep slope environments, this device was manually fed with sediment-loaded runoff from the barrel. The amount of sediment-loaded water fed back into the plot was controlled based on the runoff that was measured during the rainfall experiment.
Rainfall experiments
Due to the high inclination of the plot and vertical rainfall, a rainfall intensity set to 0.5 mm/min. as previously described, needed to be adjusted from a 1 m² plot to the 0.65 m² area. The rainfall experiment lasted 74 minutes in total and was followed by another six minutes of rainfall and additionally introduced runoff.
As a result of its limited size (1 × 1 m), the plot had to be carefully located by determining a representative area. Then the frame and the rainfall simulator were installed. Due to the steepness of the investigated slope, ropes were attached from the simulator to trees above it to fasten equipment and secure the work area. Prior to initiating the experiment, the nozzle pressure was checked directly on the nozzle using a manometer. The pressure on the pipe system was increased by 0.1 bar in order to compensate for the higher altitude and, thus, generate conditions comparable to those in lowland experiments.
Parameter identification for EROSION 2D/3D
The EROSION 2D/3D model requires certain parameters of relief, rainfall, soil and land use. Soil parameters can be grouped as either basic soil structural parameters or parameters which can only be derived from rainfall and/or flow experiments (Table 1). For parameter identification based on artificial rainfall simulations, the virtual slope length must be known. Virtual slope length is defined as:
𝐿𝐿
𝑣𝑣=
𝑄𝑄𝑟𝑟 𝐿𝐿
𝑄𝑄𝑖𝑖
(1)
𝐿𝐿 represents the original plot length, while 𝐿𝐿𝑣𝑣 represents the length of the virtually enlarged slope (m), 𝑄𝑄𝑟𝑟 represents runoff during the reflux experiment according to the runoff during the final minute of the infiltration (rainfall simulation) experiment 𝑄𝑄𝑖𝑖.
Average flow velocity is measured by installing a video camera (®GoPro) and a colour tracer (Vitasyn ® Blue AE 85). Based on these measurements, surface roughness can be calculated by re-arranging Manning’s equation,
𝑉𝑉𝑞𝑞 =1𝑛𝑛∗ 𝑅𝑅 2
3∗ 𝑆𝑆12 (2)
in which 𝑉𝑉𝑞𝑞 is the runoff velocity (m/s), 𝑛𝑛 is the roughness (s m-1/3), 𝑅𝑅 is the hydraulic radius (m) and 𝑆𝑆 represents the slope (m/m). Particle sizes were determined through the sieve sedimentation analysis. They play a major role in infiltration behaviour and soil stability and, thus, in the soil’s reaction to surface runoff, e.g. high contents of small grain sizes of the clay fraction tend to increase soil cementation and, thus, stability. Bulk densities were analysed using core sampling cylinders. Challenges had to be overcome during the sampling and laboratory analysis, as the high skeletal content needed to be taken into account during the weighing. This was done by separating >2 mm grain sizes from the fine material and determining the volume and weight. The tedious sampling process resulted in a total of six replicates from the simulated rainfall site.
Table 1 Determination of EROSION 2D/3D input parameters using rainfall simulations. Parameter type Input parameter Unit Method
Relief Slope Slope length [m/m] [m] water-level and inclinometer calculation as equation (1)
Rainfall Rainfall intensity Rainfall duration [mm*min^-1] measurement [min] measurement
Soil Soil cover Grain size distribution [%] [%] photo method ultrasonic dispersion, sieve-sedimentation Bulk density [kg*m^-3] gravitational measurement (105°C)
SOC [%] Multi-EA ® Jena Analytik
Initial soil moisture [Vol.%] gravitational measurement (105°C) Hydraulic roughness 𝑛𝑛° [s m-1/3] determined via flow velocity, equation (2)
Skinfactor° [-] model calibration
Soil resistance 𝜑𝜑𝑐𝑐𝑟𝑟𝑖𝑖𝑐𝑐° [N*m^-2] model calibration
°parameter derived from rainfall simulation
Structure from motion
As an increasingly accepted method in close-range photogrammetry, structure from motion algorithms represent a cost-effective tool in high-resolution 3D surface reconstruction. Especially in geomorphology, a wide range of employments is possible and a boom in studies has been observed during the last few years (Westoby et al. 2012). The applicability of the method ranges
from large scale aerial surveys (Niethammer et al. 2011) and archaeological site mapping
rainfall experiment. The models were produced using ®Agisoft’s Photoscan and referenced in Meshlab by setting eight visually unchanged ground control points along the plot’s border and two in the plot’s centre on immobile rocks.
RESULTS
Rainfall simulation
During the simulated rain events, the study site showed a high infiltration rate in the first 5–10 minutes, followed by a rapid decrease in infiltration capacity. Figure 2 shows the overall erratic behaviour of infiltration which hinders the occurrence of steady state infiltration. The dotted line displays the results modelled from the described parameters combined with the Green-Ampt infiltration concept. The odd fluctuations in the graph can be explained by minor leakages in the plot border and ponding on the plot. An example of low and then increasing infiltration at around minute 40 is attributed to two small-scale debris flows which blocked the outlet of the plot. The maximum values between minutes 50 and 63 are due to a minor leakage in the plot boundary where a trapped stone eroded and, thus, left a gap. Figure 4 shows the measured sediment concentration throughout the experiments. A substantial rise in sediment during the added runoff experiment can be seen with concentrations of up to 22.1 g/100 ml.
Fig. 3 Comparison of measured infiltration during the rainfall experiment and EROSION 2D modelling.
Fig. 4 Sediment concentrations resulting from the rainfall simulation and the reflux experiment.
Parameter identification
Particle size distribution The grain size distribution analysis resulted in a silty loam with consists of 30.3% in the clay fraction, 52.1% of silt and 17.6% of fine sand.
Soil resistance The large sediment yields of 197 g L-1 indicate the low erosion resistance of
0.0008 N m-2.
Skinfactor With a value of 0.82, Skinfactor showed the best comparisons with the infiltration acquired by the rainfall simulation (Fig. 3). A detailed description of the Skinfactor is given in Weigert & Schmidt (2005).
Hydraulic roughness The reflux experiment with an additional runoff of 0.007 𝑚𝑚 ∗ 𝑚𝑚𝑖𝑖𝑛𝑛𝑚𝑚3 followed the rainfall on wet conditions. The analysis of the flow velocity measurements resulted in roughness values of 0.01 s m-1/3, as most rocks are embedded in the soil matrix and no vegetation
cover is present.
Structure from motion
As a result of the close-range photogrammetry, two high resolution surface models of the rainfall plots were produced, both before and after the experiment. Figure5 shows the initial situation on the left and changes in the surface on the right as produced using CloudCompare (Girardeau-Montaut 2014).
Fig. 5 Results from two structure from motion models of the rainfall plot. The image on the left shows the original plot before the experiments. The image to the right demonstrates changes caused by rainfall. Scale on the right in cm.
Fig. 6 Difference image after the added surface runoff. Scale on the right in cm.
An area on the slightly uneven slope in the upper centre of the plot and the adjacent runoff area to the left of the slope were primarily affected. As shown on the histogram to the right of the color scale, the maximum changes reach 1.41 cm, while most of the changes are within the range of 0–0.5 cm. The highest differences occurred after small quantities of gravel detachment in the remaining sinks. A different image can be seen after additional runoff is introduced to the plot
(Fig. 6). The greyscale on the right has different proportions to the one above. Two rills formed on the left side of the plot as most of the surface runoff was diverted by the small hill in the centre of the plot. The rill’s incision depth of 3.64 cm is, again, concentrated on removed gravel and not on pure sediment detachment. Nevertheless, mean erosion rates increased from 27 g L-1 to 197 g L-1
as a response to the increased runoff. Slight changes occurred on the areas of the plot outside of the rills.
DISCUSSION
As one result of the field campaign, it is important to note that erecting the rainfall simulator and handling its water supply on strongly inclined slopes is a long procedure which can be further improved. Further field work has been planned and will contribute to improving the procedure and structural issues involved with the set-up. Nevertheless, surface runoff processes were reproduced and suitable data for erosion modelling were generated, although it required further adaption to alpine conditions.
The soil’s low erosion resistance of 0.0008 N m-2 can be attributed to low Corg contents.
Furthermore, the resistance values can be compared to those of sealed tramlines under cropland conditions (Michael 2000). For the latter, the Skinfactor ranges from 0.1–1.2. Thus, a measured Skinfactor of 0.82 in the Lainbach catchment is plausible. With regard to roughness, results needed to be adjusted to a smaller flow width. Although the diameter of the erosion plot was limited to 1 m, flow concentration was observed during the reflux experiment in two major rills corresponding to the micromorphology. This is important as flow width is a factor in Manning’s equation as described above. In most cases, this procedure can be skipped in lowland conditions. However, slope can accelerate flow accumulation and, thus, needs to be taken into account. Rill incision initiates additional erosion processes that also need to be considered during simulation. Furthermore, bulk density measurements in soils with a high skeletal content are challenging using core sampling rings.
The 3D surface reconstruction via structure from motion shows a precise and detailed depiction of the plot. The changes displayed can be explained and allow for assumptions regarding dominant erosion processes. During the rainfall experiment, a clear majority of sediment was mobilized by sheet wash, presumably through splash effects while the additional runoff simulation clearly showed concentrated erosion in two rills (Fig. 6). On larger areas in the catchment erosion processes are influenced by curvature of the slope and concavities in the interrill areas.
CONCLUSION
As the paper presents a first application of the described rainfall simulator in difficult terrain there is still room for improvement in the experimental set-up. Nevertheless, obtaining adequate data in a plausible data region was well worth the effort. Results for the sediment concentration prove to be valuable for the modelling approach, especially when considering that this was the first application of the rainfall simulator under alpine conditions. Structure from motion proves to be an adequate tool for surface reconstruction, even on the plot scale. Considering the bulk density measurements, other methods will be used in future field campaigns, such as soil excavation and volume determination. Furthermore, efficiency in workflow during the preparation of the field experiments needs to be improved in order to accelerate data acquisition.
REFERENCES
.
Becht, M. (1989) Neue Erkenntnisse zur Entstehung pleistozäner Talverfüllungen. In: Eiszeitalter und Gegenwart (39). Ferrick, M. G. & Gatto, L. W. (2005) Quantifying the effect of a freeze-thaw cycle on soil erosion: laboratory experiments.
Earth Surf. Process. Landforms 30(10), 1305–1326.
Ghahramani, A. & Ishikawa, Y. (2013) Water flux and sediment transport within a forested landscape: the role of connectivity, subsurface flow, and slope length scale on transport mechanism. Hydrol. Processes 27, 4091–4102.
Girardeau-Montaut, D. (2014) CloudCompare (version 2.4) [GPL software]. EDF R&D, Telecom ParisTech.
Kainz, M., Auerswald, K. & Vöhringer, R. (1992) Comparison of German and Swiss rainfall simulators - utility, labour demands and costs. Journal of Plant Nutrition and Soil Science 155, 7–11.
Kaiser, A., et al. (2014) Small-scale surface reconstruction and volume calculation of soil erosion in complex Moroccan gully morphology using structure from motion. Remote Sensing 6, 7050–7080.
Markart, G. et al. (2010) Simulation of torrential rain as a means for assessment of surface runoff coefficients and calculation of recurrent design events in alpine catchments. EGU. Vienna, 2010.
Michael, A. (2000) Anwendung des physikalisch begründeten Erosionsprognosemodells EROSION 2D/3D – Empirische Ansätze zur Ableitung der Modellparameter. Dissertation, Technical University Freiberg, Germany.
Niethammer, U., et al. (2011) Open source image-processing tools for low-cost UAV-based landslide investigations.
Ries, J. B. (2010): Methodologies for soil erosion and land degradation assessment in mediterranean-type ecosystems. Land Degrad. Dev. 21 (2), 171–187.
Schindewolf, M. et al. (2014) Seasonal erosion patterns under alpine conditions: benefits and challenges of a novel approach in physically based soil erosion modeling. Zeitschrift fur Gemorphologie, Supp. (Submitted).
Schindewolf, M., Schmidt, J. & Werner, M.v. (2012) Modeling Soil Erosion and resulting Sediment Transport into Surface Water Courses on Regional Scale. Zeitschrift für Geomorphologie, Supplementary Issues 57(1), 157–175.
Schindewolf, M.S (2012) Parameterization of the EROSION 2D/3D soil erosion model using a small-scale rainfall simulator and upstream runoff simulation. Catena 91, 47–55.
Schmidt, J. (1991) A mathematical model to simulate rainfall erosion. In: Erosion, Transport and Deposition Processes - Theories and Models. Catena Supplement 19, 101–109.
Schmidt, K. H. (1994) River channel adjustment and sediment budget in response to a catastrophic flood event (Lainbach catchment, Southern Bavaria). Lecture Notes in Earth Sciences (52).
Starkloff, T. & Stolte, J. (2014) Applied comparison of the erosion risk models EROSION 3D and LISEM for a small catchment in Norway. Catena 118, 154–167.
Verhoeven, G. et al. (2012) Mapping by matching: a computer vision-based approach to fast and accurate georeferencing of archaeological aerial photographs. Journal of Archaeological Science 39(7), 2060–2070.
Weigert, A. & Schmidt, J. (2005) Water transport under winter conditions. Catena 64(2-3), 193–208.
Westoby, M. J. et al. (2012) ‘Structure-from-Motion’ photogrammetry: A low-cost, effective tool for geoscience applications.
Geomorphology 179, 300–314.
Wetzel, K.F. (2003) Runoff production processes in small alpine catchments within the unconsolidated Pleistocene sediments of the Lainbach area (Upper Bavaria). Hydrol. Processes 17(12), 2463–2483.