DOI No. 10.5958/2321-5771.2014.00013.1
Working and earning status versus
domestic responsibilities:
A reverse ratio for women
Nikhila Bhagwat1 and Hemant Rajguru21S.M.R.K. - B.K. - A.K. Mahila Mahavidyalaya, Nashik, India. 2Academic Services Division, Y.C.M.O.U., Nashik, India.
Corresponding author: nikhilabhagwat@gmail.com ABSTRACT
The present study examines the impact of the working and earning status of women on their everyday domestic responsibilities from the experiences of a sample of 112 working women from Nashik city ranging in 23 to 56 years of age. A questionnaire with the basic demographic information, some close ended questions and a checklist of forty-two family chores were administered to the sample as research tools. Main findings reveal that in spite of the working and earning status of women the everyday domestic responsibilities of family living are not shared on fair basis by men and women. Some of the backbreaking ‘everyday family chores’ are not at all done by men in the sample population. This inequality in work distribution and shouldering responsibility could be an outcome of the prevalent patriarchal or male dominant family system in India. Nashik being a religious town seems to follow the traditional role-patterns of women and men even though due to the economic reasons women have taken up the additional function of earning for the family. The data were analyzed and mean, standard deviation and t-value were estimated. The present study was confined to the urban working women in the city of Nashik in Maharashtra, India.
Keywords: Working women, Earning status, Family chores, Domestic
responsibility
Introduction
face challenging responsibilities to work as well as to look after the family. And it is a very difficult task to completely satisfy these twin demands. Blom (2011) reported that women had higher general life stress than men.
‘It’s an accepted and a natural way of life for the Indian working women to do housework. From the time they are born, the conditioning starts. House work first starts like a game with dolls and toys that consist of a set of pressure cooker, gas-stove, mixer etc. As she grows up, her gradual initiation into household chores is a natural progression. The middle and lower class working women, it’s a daily, non-stop 5 am- 11pm routine for most part of their lives…with no domestic help either in the form of maids or in-laws at home.’ (Iyengar, 2013)
Significance of the study
We have around 50% women in Indian democracy. Education and employment is increasingly becoming a common course of life for women in India. These recent sociological developments have brought with it many changes. Change in socio-economic and educational status of women, her responsibilities, her roles, comforts in life-style, causing a plethora of demands that strain human body and mind. Today, women face competing obligations to work and to look after the family. Working Woman is the one, who is employed for a salary, fees or wages and producing or generating any income for herself and her family.
It is a general observation that in spite of the working status of women they have to carry out most of the household responsibilities in the family. While working men can relax and recoup their energies at home, women shift from completing their responsibilities at work from undertaking their duties at home. The present effort would give headway to many other relevant issues concerning working women such as status of working women in Indian families, burden of domestic responsibilities on working women, causes of stress creation and its management by working women, health concerns of working women, harassment of working women at home and at workplace, etc. to bring due realization of factual situation.
Review of related studies
that women would not achieve equal opportunities at work until their men-folk contributed more to looking after the home. Sifferlin’s (2014) reveals that on an average day, 83% of women and 65% of men spent some time doing household activities such as housework, cooking, lawn care, or financial and other household management. On an average day, 19% of men did housework–such as cleaning or doing laundry–compared with 49% of women. 42% of men did food preparation or cleanup, compared with 68% of women. On an average day, among adults living in households with children under age 6, women spent 1 hour providing physical care (such as bathing or feeding a child) to household children; by contrast, men spent 26 minutes providing physical care. Strasser (2012) reiterated that in spite of 59.4% of working-age women are currently in the American workforce and with 80% of women are the primary or co-bread winner for their household; most women are still left doing the majority of the house work. This disproportionate burden of housework on women shows that a ‘second shift’ still exists for those women who work.
Methodology
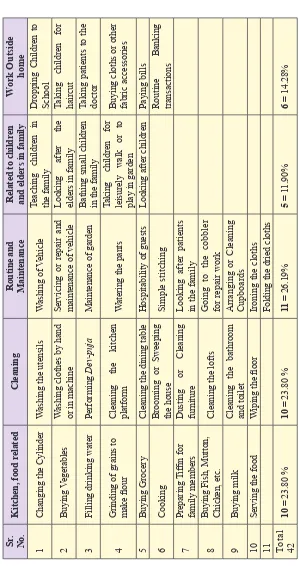
Data for the present study were collected by employing ‘Descriptive Survey Method’. ‘Descriptive research is devoted to the gathering of information about prevailing conditions or situations for the purpose of description and interpretation. (Salaria, 2012) A questionnaire with the basic demographic information and a checklist of forty-two family chores were administered to the sample. Sampling was done using stratified purposive sampling technique. (Cohen, 2006) The sample included 112 working women from Nashik city, aging from 23 to 56 years. The forty two ‘Everyday Family Chores’ listed in the checklist were sub divided into five categories namely, Kitchen and food related Chores, cleaning related chores, chores related to daily routine and maintenance, chores concerning children and elders in family and finally, work outside home.
Findings
Table 1. Categories of Everyday Family Chor
es:
Sr
.
No.
Kitchen, food r
elated
Cleaning
Routine and Maintenance
Related to childr
en
and elders in family
W
ork Outside home
1
Changing the Cylinder
W
ashing the utensils
W ashing of V ehicle Teaching childre n in the family Dropping Children to School 2 Buying V egetables W ashing clothes by hand
or in machine
Servicing
or
repair
and
maintenance of vehicle
Looking after
the
elders in family
Taking
children
for
haircut
3
Filling drinking water
Performing
Dev-puja
Maintenance of garden
Bathing small children in the family
Taking patients to the doctor 4
Grinding of grains to make flour
Cleaning
the
kitchen
platform
W
atering the pants
Taking children
for
leisurely walk or to play in garden Buying cloths or other fabric accessories
5
Buying Grocery
Cleaning
the dining table
Hospitability of guests
Looking after children
Paying bills
6
Cooking
Brooming or Sweeping the house
Simple stitching Routine Banking transactions 7 Preparing Tiffin for family members
Dusting or Cleaning furniture
Looking
after
patients
in the family
8
Buying Fish, Mutton, Chicken, etc.
Cleaning the lofts
Going to
the
cobbler
for repair work
9
Buying milk
Cleaning the bathroom and toilet
Arranging or Cleaning Cupboards
10
Serving the food
W
iping the floor
Ironing the cloths
11
Folding the dried cloths
Table 2. Per
centage r
elated to Everyday Family Chor
es
Sr
.
No.
Total family chor
es
Usually done by Male
Usually done by
Female
Responsibility
of Male
Responsibility of Female
Responsibility
of Both
1
Changing the Cylinder
26= 23.21% 86= 76.78% 8= 7.14% 88= 78.57 16= 14.28% 2 Buying V egetables 31= 27.67% 81= 72.32% 13= 11.60% 67= 59.82% 32= 28.57% 3
Filling drinking water
8= 7.14% 100= 89.28% 4= 3.57% 90= 80.35% 18= 16.07% 4
Grinding of grains to make flour
19= 16.96% 56= 50.00% 16= 14.28% 83= 74.10% 13= 11.60% 5 Buying Grocery 21= 18.75% 91= 81.25% 5= 4.46% 68= 60.71% 39= 34.82% 6 Cooking 2= 1.78% 110= 98.21% 0= 00.00% 100= 89.28% 12= 10.71% 7 Preparing Tiffin for family membe rs 1= 0.89% 111 = 99.10% 0= 00.00% 103= 91.96% 9= 8.03% 8
Buying Fish, Mutton, Chicken, etc.
36= 32.14% 47= 41.96% 65= 50.03% 5= 4.46% 13= 11.60% 9 Buying milk 11 = 9.82% 20= 17.85% 16= 14.28% 12= 10.71% 3= 2.67% 10
Serving the food
2= 1.78% 77= 68.75% 3= 2.67% 102= 91.07% 7= 6.25% 11
Folding the dried cloths
16= 14.28% 96= 85.71% 2= 1.78% 110= 98.21% 0= 00.00% 12
Teaching children in the family
12= 10.71% 34= 30.35% 12= 10.71% 20= 17.85% 14= 12.5% 13
Looking after the elders in family
14
Bathing small children in the fami
ly 0= 00.00% 56= 50.00% 0= 00.00% 50= 44.64% 6= 5.35% 15
Taking children for leisurely walk or to play in garden
12= 10.71% 29= 25.89% 11 = 9.82% 9= 8.03% 28= 25.00% 16
Looking after children
11 = 9.82% 87= 77.67% 10= 8.92% 64= 57.14% 24= 21.42% 17
Dropping Children to School
36= 32.14% 12= 10.71% 34= 30.35% 10= 8.92% 12= 10.71% 18
Taking children for haircut
40= 35.71% 16= 14.28% 40= 35.71% 10= 8.92% 6= 5.35% 19
Taking patients to the doctor
65= 58.03% 36= 32.14% 58= 51.75% 10= 8.92% 33= 29.46% 20
Buying cloths or other fabric accessories
33= 29.46% 78= 69.64% 13= 11.60% 38= 33.92% 60= 53.57% 21
Paying bills –Rent, water
, electricit y, etc. 82= 73.21% 28= 25.00% 80= 71.42% 12= 10.71% 18= 16.07% 22
Routine Banking transactions
85= 75.89% 23= 20.53% 59= 52.67% 2= 1.78% 51= 45.53% 23 W
ashing the utensils
0= 00.00% 110= 98.21% 0= 00.00% 99= 88.39% 13= 11.60% 24 W ashing clothes by hand or in machine 10= 8.92% 34= 30.35% 2= 1.78% 98= 87.5% 12= 10.71% 25 Performing Dev-puja 30= 26.78% 55= 49.10% 25= 22.32% 27= 24.10% 60= 53.57% 26
Cleaning the kitchen platform
0= 00.00% 92= 82.14% 0= 00.00% 106= 94.64% 6= 5.35% 27
Cleaning the dining table
10= 8.92% 88= 78.57 9= 8.03% 83= 74.10% 20= 17.85% 28
Brooming or Sweeping the house
29
Dusting or Cleaning furniture
2= 1.78% 78= 69.64% 2= 1.78% 100= 89.28% 10= 8.92% 30
Cleaning the lofts
4= 3.57% 89= 79.46% 4= 3.57% 104= 92.85% 4= 3.57% 31
Cleaning the bathroom and toilet
0= 00.00% 86= 76.78% 0= 00.00% 112= 100.00% 0= 00.00% 32 W
iping the floor
0= 00.00% 33= 29.46% 0= 00.00% 112= 100.00% 0= 00.00% 33 W ashing of V ehicle 33= 29.46% 18= 16.07% 78= 69.64% 12= 10.71% 22= 19.64% 34 Servicing
or repair and maintenan
ce of vehicle 87= 77.67% 10= 8.92% 99= 88.39% 2= 1.78% 11 = 9.82% 35
Maintenance of garden
13= 11.60% 20= 17.85% 3= 2.67% 5= 4.46% 25= 22.32% 36 W
atering the plants
10= 8.92% 47= 41.96% 6= 5.35% 31= 27.67% 20= 17.85% 37
Hospitability of guests
33= 29.46% 78= 69.64% 11 = 9.82% 12= 10.71% 89= 79.46% 38
Simple stitching and mending
2= 1.78% 98= 87.5% 0= 00.00% 100= 89.28% 2= 1.78% 39
Looking after patients in the family
13= 11.60% 87= 77.67% 13= 11.60% 67= 59.82% 32= 28.57% 40
Arranging or Cleaning Cupboards
18= 16.07% 91= 81.25% 3= 2.67% 92= 82.14% 17= 15.17% 41
Ironing the cloths
Table 1, shows the distribution of the 42 ‘everyday family chores’ divided into five categories. Out of these the major three categories that constituted almost three fourth of the ‘everyday family chores’ by contributing about one quarter portion each are namely, Kitchen and food related work (23.8%), cleaning related chores (23.8%), and routine maintenance work (26.19%). ‘Routine maintenance work’ emerged as the biggest category of everyday family chores with 11 chores listed under the same, while the chores related to children and elders in family appeared as the smallest category with only 5 chores listed in it.
Table No. 2 shows that some of the ‘everyday family chores’ are not at all done by men of the sample population, such as, cleaning the bathroom and toilet, wiping the floor, brooming or sweeping the house, cleaning the kitchen platform, washing the utensils and bathing small children in the family and works like simple stitching and mending, cleaning the lofts, dusting or cleaning furniture, serving the food, preparing Tiffin for family members and cooking are done by less than 5% men in the sample population. On the other hand, buying milk, dropping children to school, taking children for haircut, washing of vehicle, servicing or repair and maintenance of vehicle, maintenance of garden are the less popular chores among women and less than 20% women found doing them with ‘servicing or repair and maintenance of vehicle’ being the least liked work done by only 8.92% women. However, as a fact not a single ‘everyday family chore’ was not done by women. Cooking, preparing Tiffin for family members and washing the utensils were done by more than 98% women in the sample population in spite of their gainfully working status.
Men were considered accountable for only five outside the house chores from 42 listed ‘everyday family chores’ like buying fish, mutton, chicken, etc. (50.03%), taking patients to the doctor (51.75%), paying bills –rent, water, electricity, etc. (71.42%), routine banking transactions (52.67%), washing of vehicles (69.64%). While, only 2 chores of servicing or repair and maintenance of vehicle (88.39%) and paying bills – rent, water, electricity, etc. (71.42%) were seen as mainly a man’s liability by majority i.e. more than 70% women under study.
Table 3. Mean values of Everyday Family Chores
Total family chores
Usually done by Women
Responsi-bility of Women
Usually done by Men
Responsi-bility of
Men
Responsi-bility of
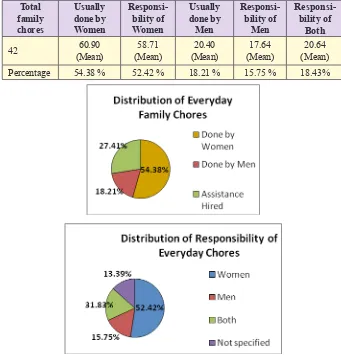
Both 42 (Mean)60.90 (Mean)58.71 (Mean)20.40 (Mean)17.64 (Mean)20.64
Percentage 54.38 % 52.42 % 18.21 % 15.75 % 18.43%
than 50% of the ‘everyday family chores’. In contrast, only18% ‘everyday family chores’ were done by men and responsibility of only 16% of ‘everyday family chores’ was held by men.
Table 4. Statistical Validation
Everyday Family
chores Gender N Mean S.D. t-value SignificanceLevel of
Usually done by
Women F 42 60.90 31.79 6.72 0.05
Usually done by Men M 42 20.40 22.65 significantHighly Responsibility of
Women F 42 58.71 39.83 5.67 0.05
Responsibility of Men M 42 17.64 24.91 significantHighly
The table value of t-test at 0.05% level of significance is 1.99 and the calculated value of t-test is 6.72 in case of ‘everyday family chores’ usually had done by women or men. This indicated that women usually did significantly more work than men. The calculated value of t-test, for responsibility of ‘everyday family chores’ assumed by women or men, was 5.67. This t-value was much higher than the table value which denotes a significantly high difference between the responsibility of ‘everyday family chores’ assumed by men and women. Women assumed considerably more responsibility of ‘everyday family chores’ in spite of their working and earning status.
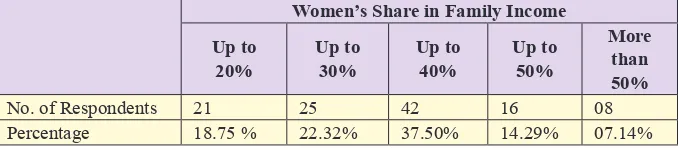
Table 5. Women’s Share in Family Income
Women’s Share in Family Income Up to
20% Up to 30% Up to 40% Up to 50%
More than 50%
No. of Respondents 21 25 42 16 08
Percentage 18.75 % 22.32% 37.50% 14.29% 07.14%
Figure 2. Contribution of Women to Family Income
Conclusion
The present research showed that in spite of the working and earning status of women the everyday domestic responsibilities of family living were not shared on fair basis by men and women. Some of the backbreaking ‘everyday family chores’ were not at all done by men in the sample population. Other low status or tedious domestic chores were done by a negligent percentage of men. On the other hand, as a fact the women did not desert even a single ‘everyday family chore’. Only four chores were considered as responsibility of both men and women out of the 42 ‘everyday family chores’ by nearly half of the respondents. Women were found assuming responsibility for more than 52% of the ‘everyday family chores’. Data reveal that more than 21% women earned equal income for the family as their male counterparts while nearly 60% women were earning 40% and more monthly income for the family. The statistical estimation showed a highly significant difference in the ‘Everyday family chores’ done and its responsibility assumed by women and men, even though the women are working outside home to earn a significant income for the family.
This inequality in work distribution and shouldering responsibility could be an outcome of the prevalent patriarchal or male dominant family system in India. Nashik being a religious town seems to follow the traditional role-patterns of women and men even though due to the economic reasons women have taken up the additional function of earning for the family.
References
Iyengar, Padmaja. (2013) ‘Working Women ‘still do Housework’, Siliconindia.http:// women.siliconindia.com/women-expert/Working-Women-still-do-Housework-eid-329.html
Salaria, Neeru. (2012) ‘Meaning of the term- descriptive survey research method’, International Journal of Transformations in Business Management, Vol. No. 1, Issue No. 6, Apr-Jun.
http://www.ijtbm.com/webmaster/upload/Apr_2012_NEERU%20SALARIA%202.pdf Sifferlin, Alexandra. (2014) ‘Women Are Still Doing Most of the Housework’, Time
Magazine, 18 June 2014 http://time.com/2895235/men-housework-women/
Yapp, Robin. (2014) ‘Working women-still do housework’, Daily Mail. http://www. dailymail.co.uk/news/article-206381/Working-women-housework.html